Interpreting Box Plots WORKSHEET
Interpreting Box Plots WORKSHEET DESCRIPTION
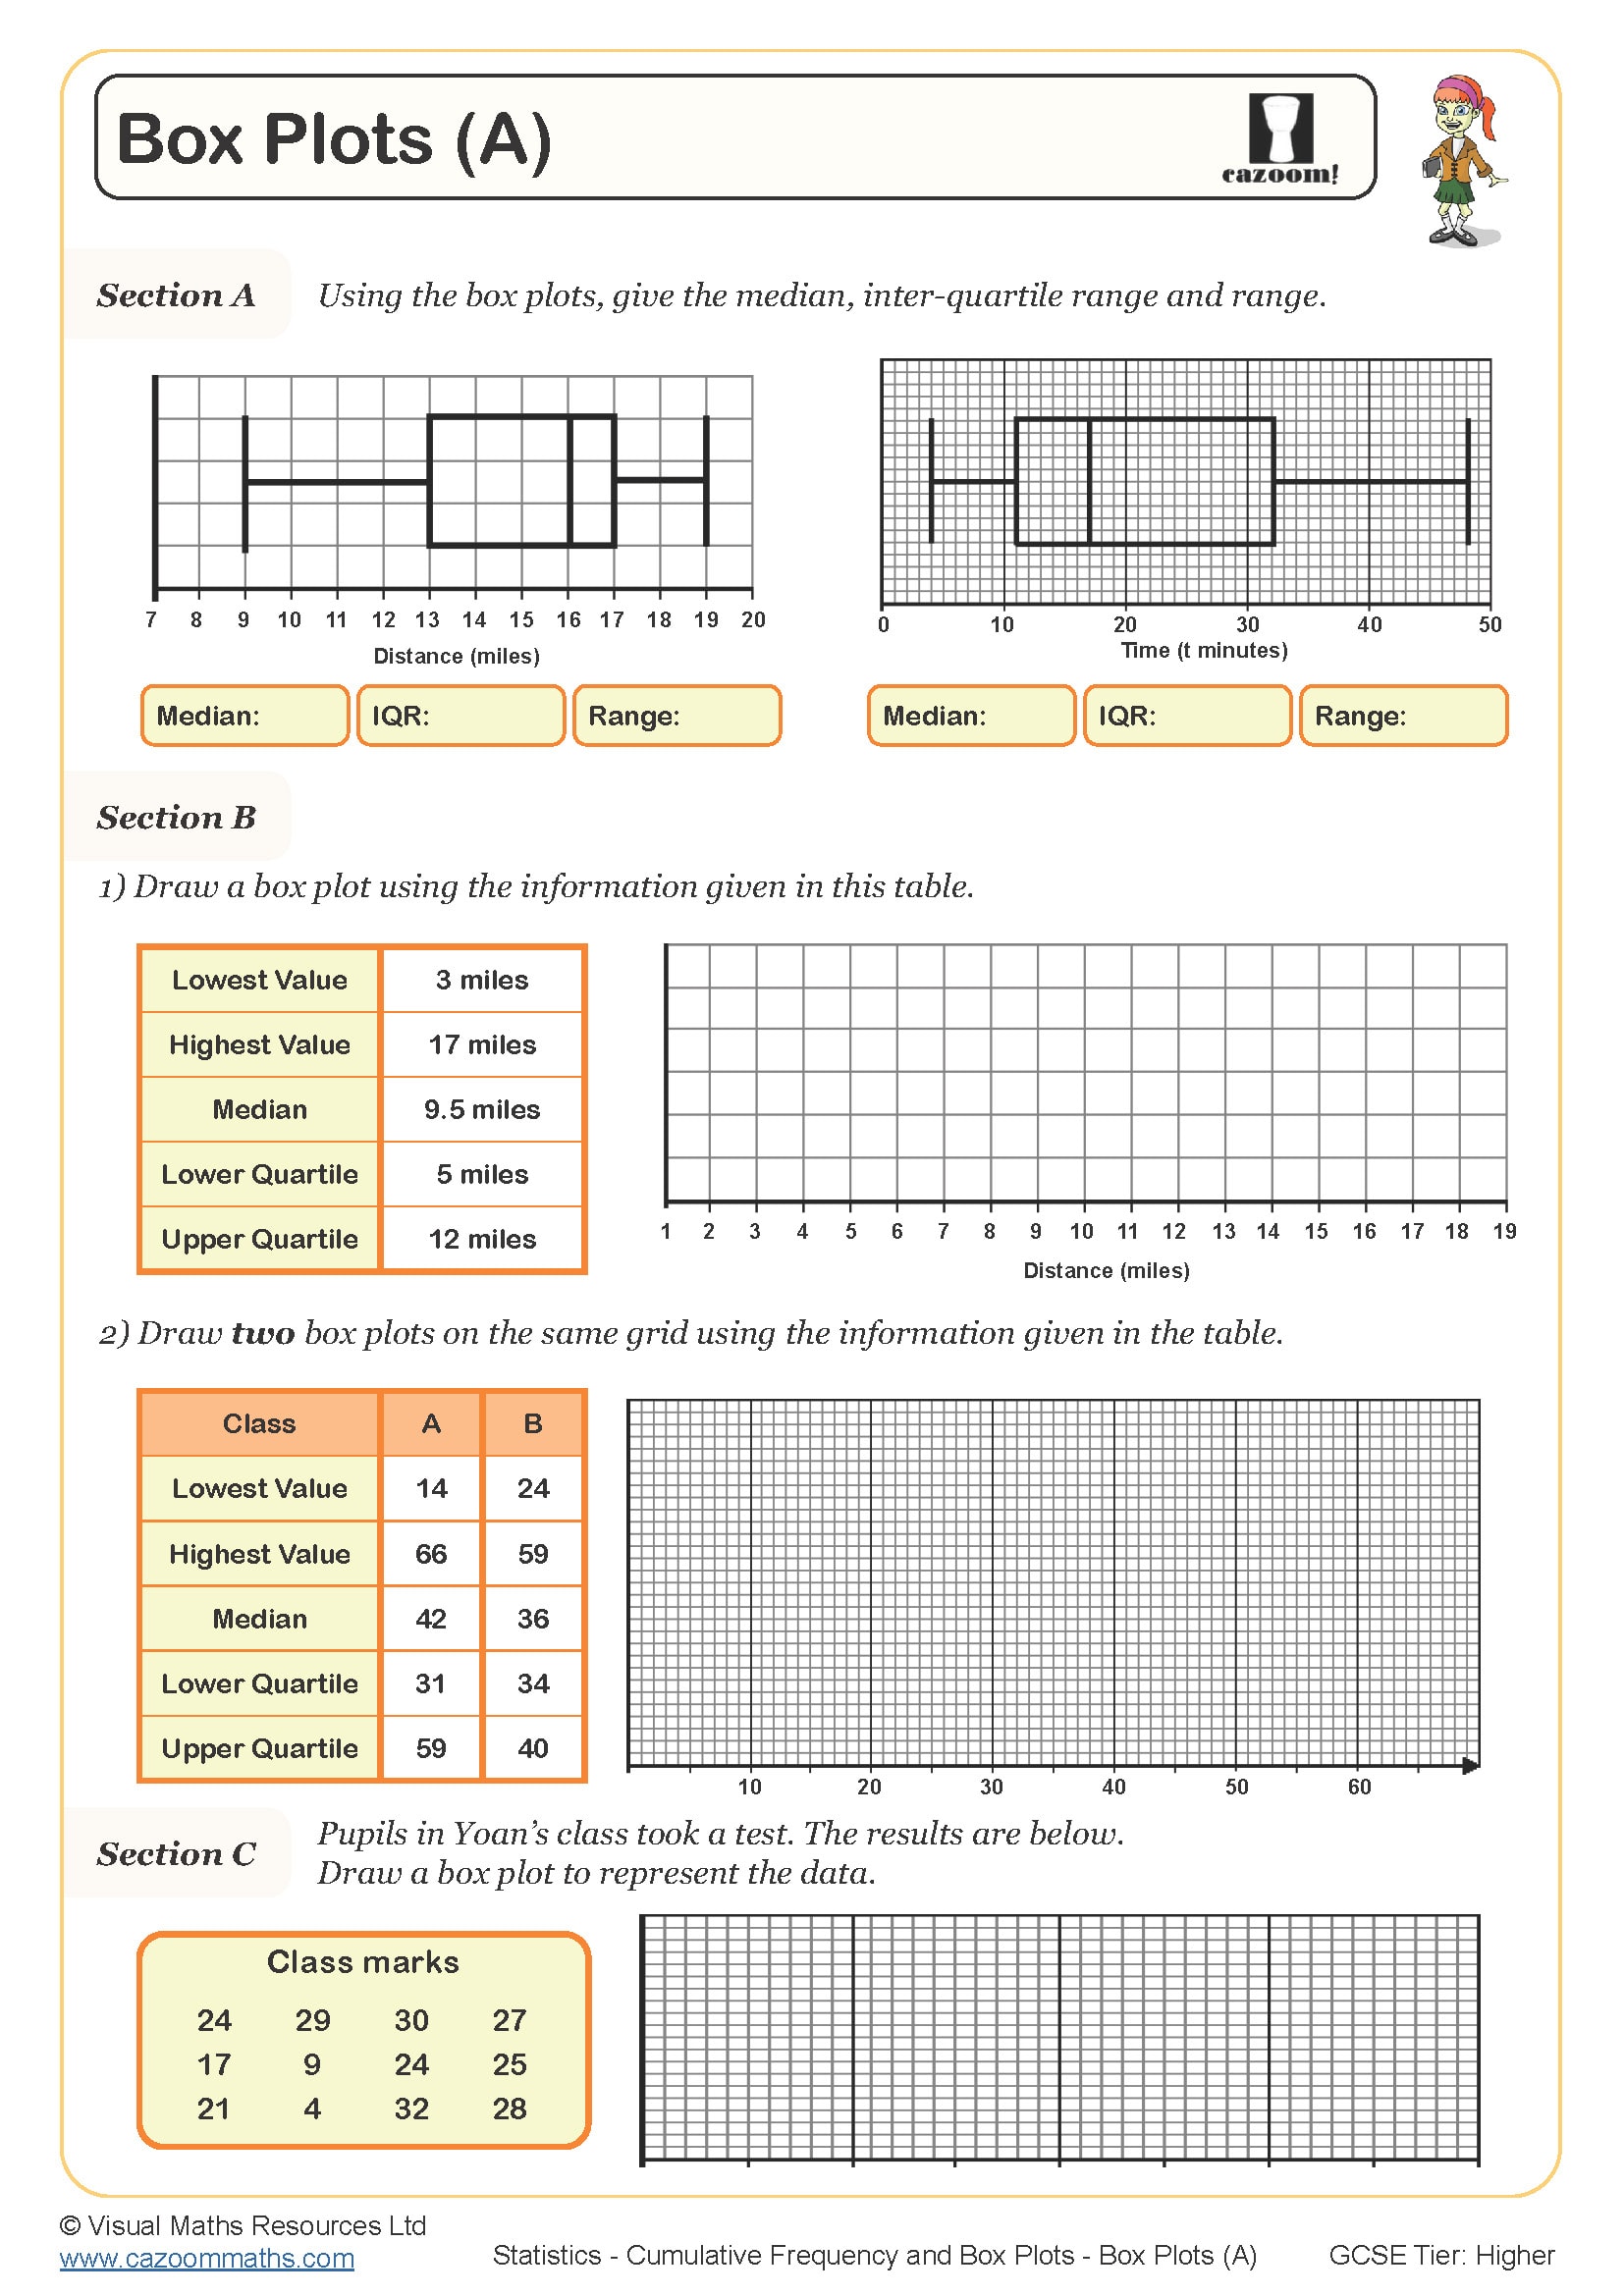
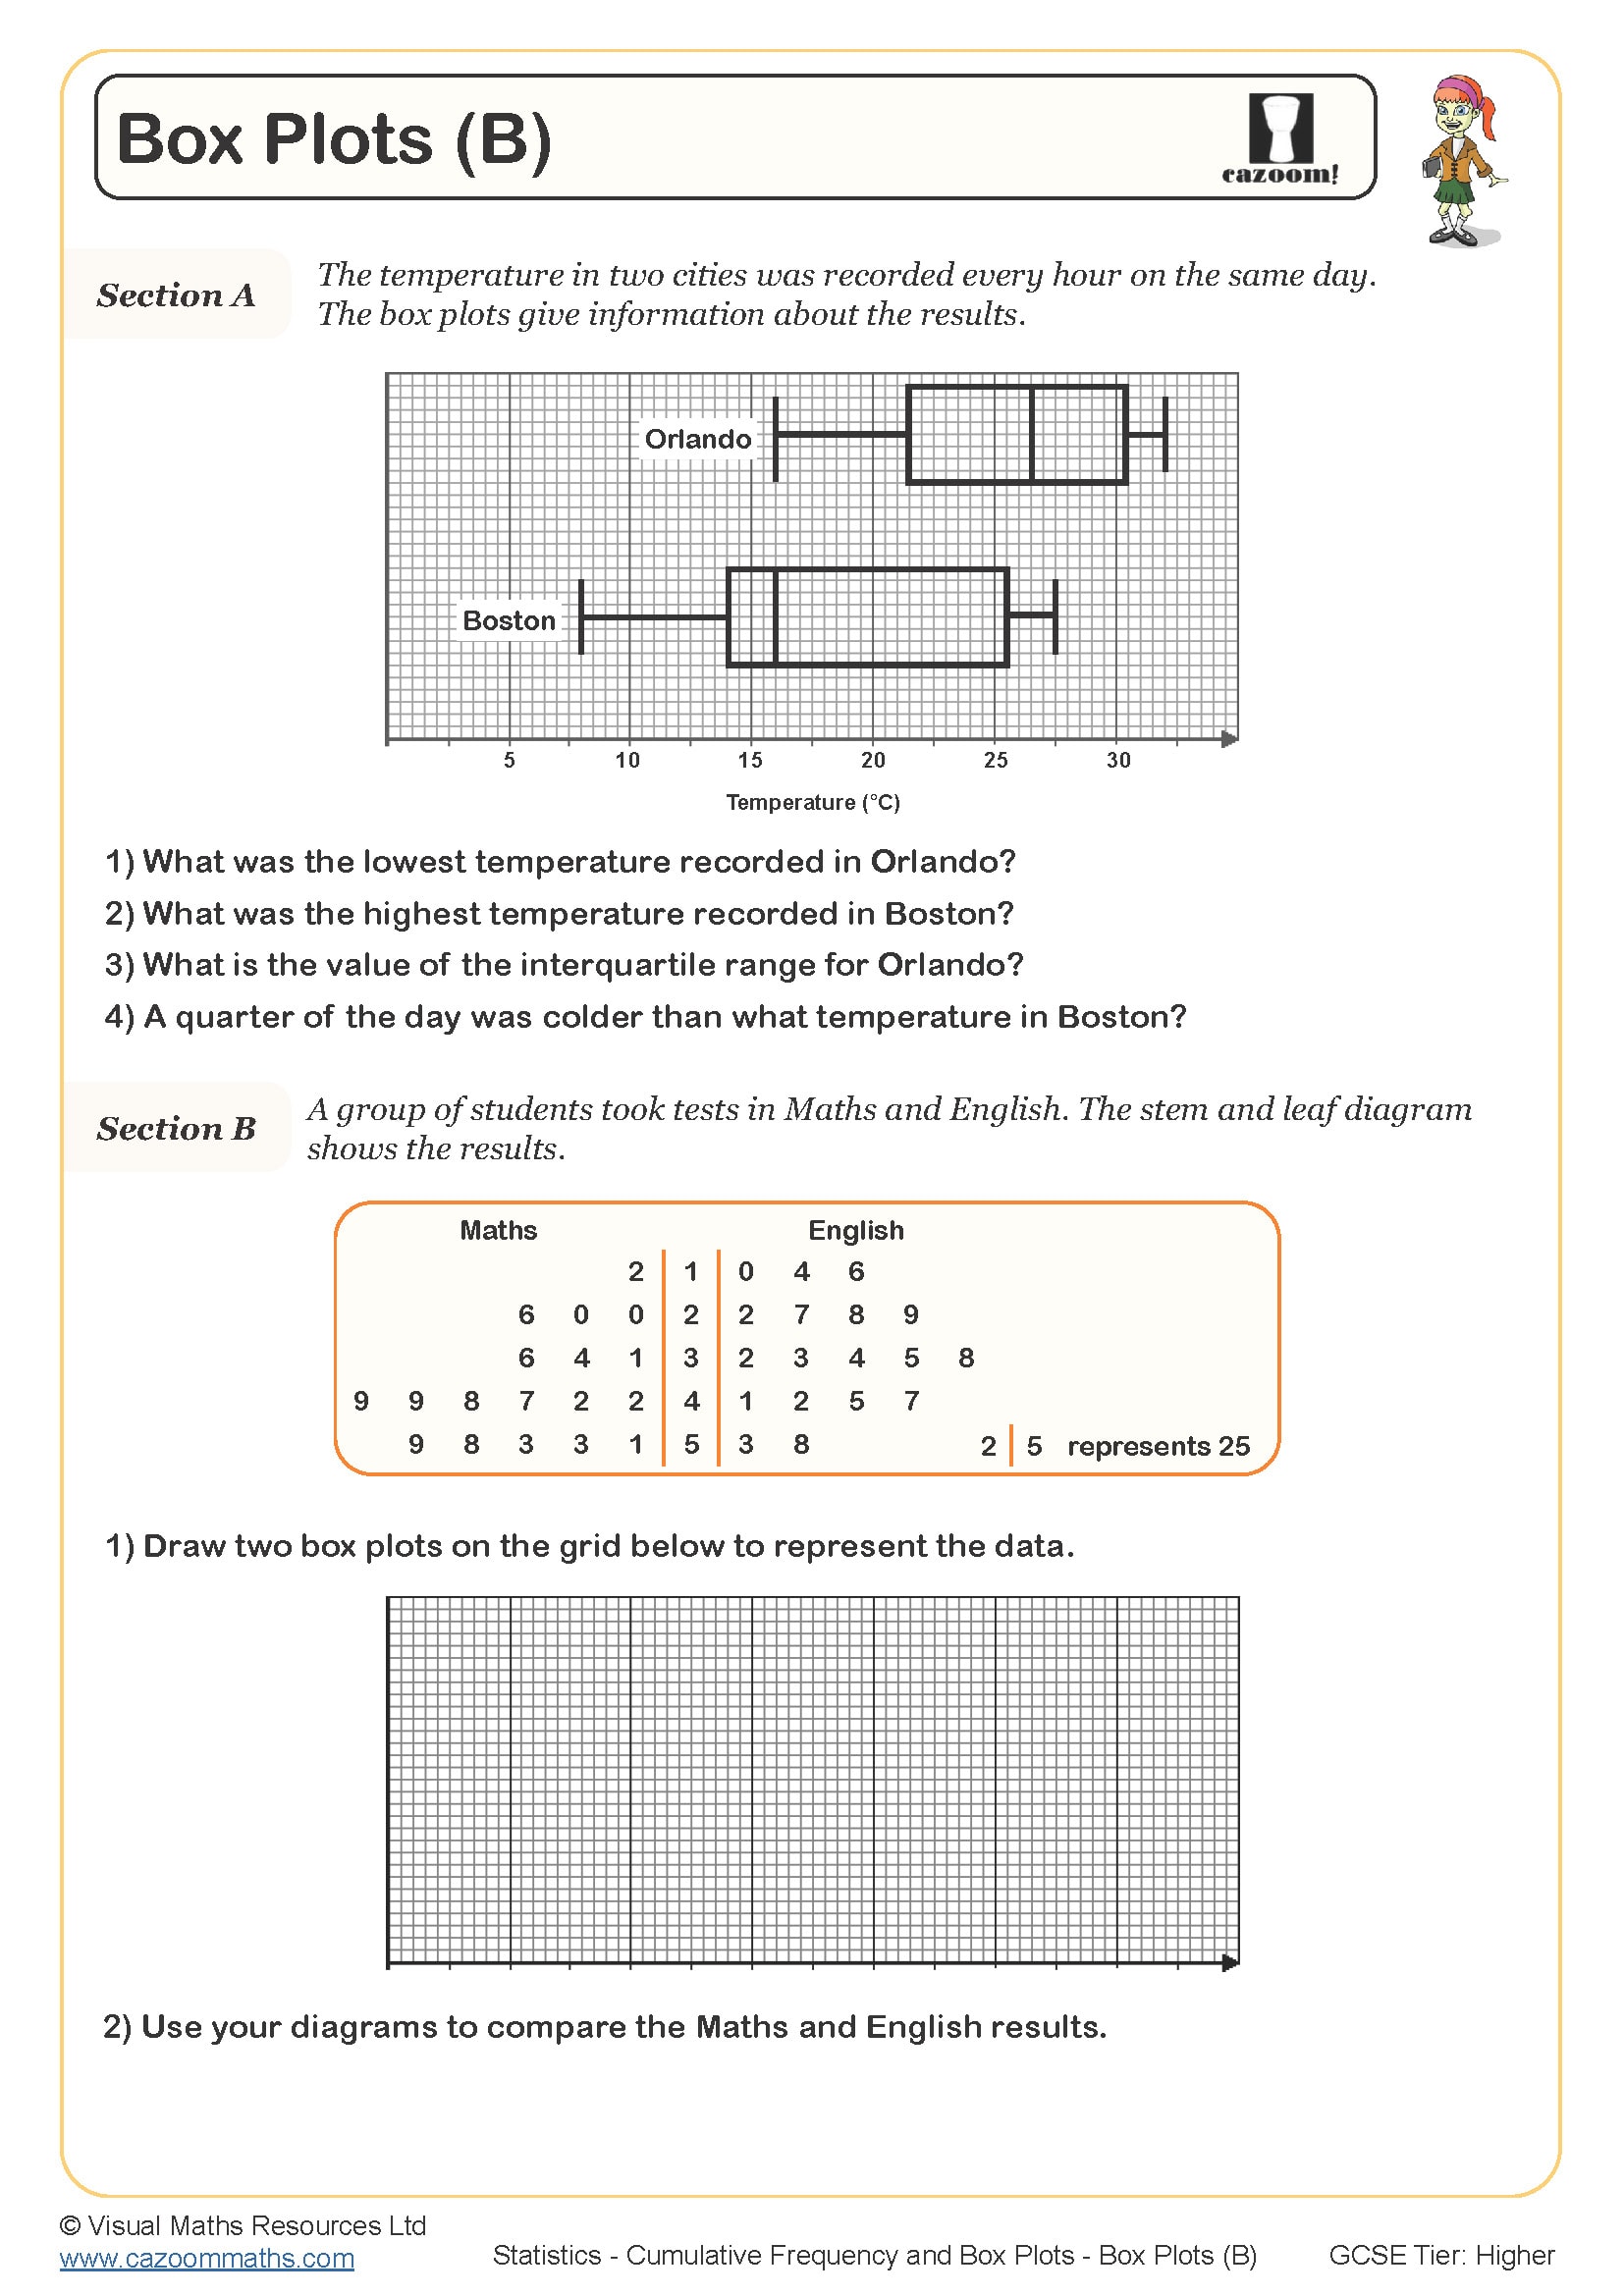
This worksheet gives learners practice of reading from a plotted box plot.
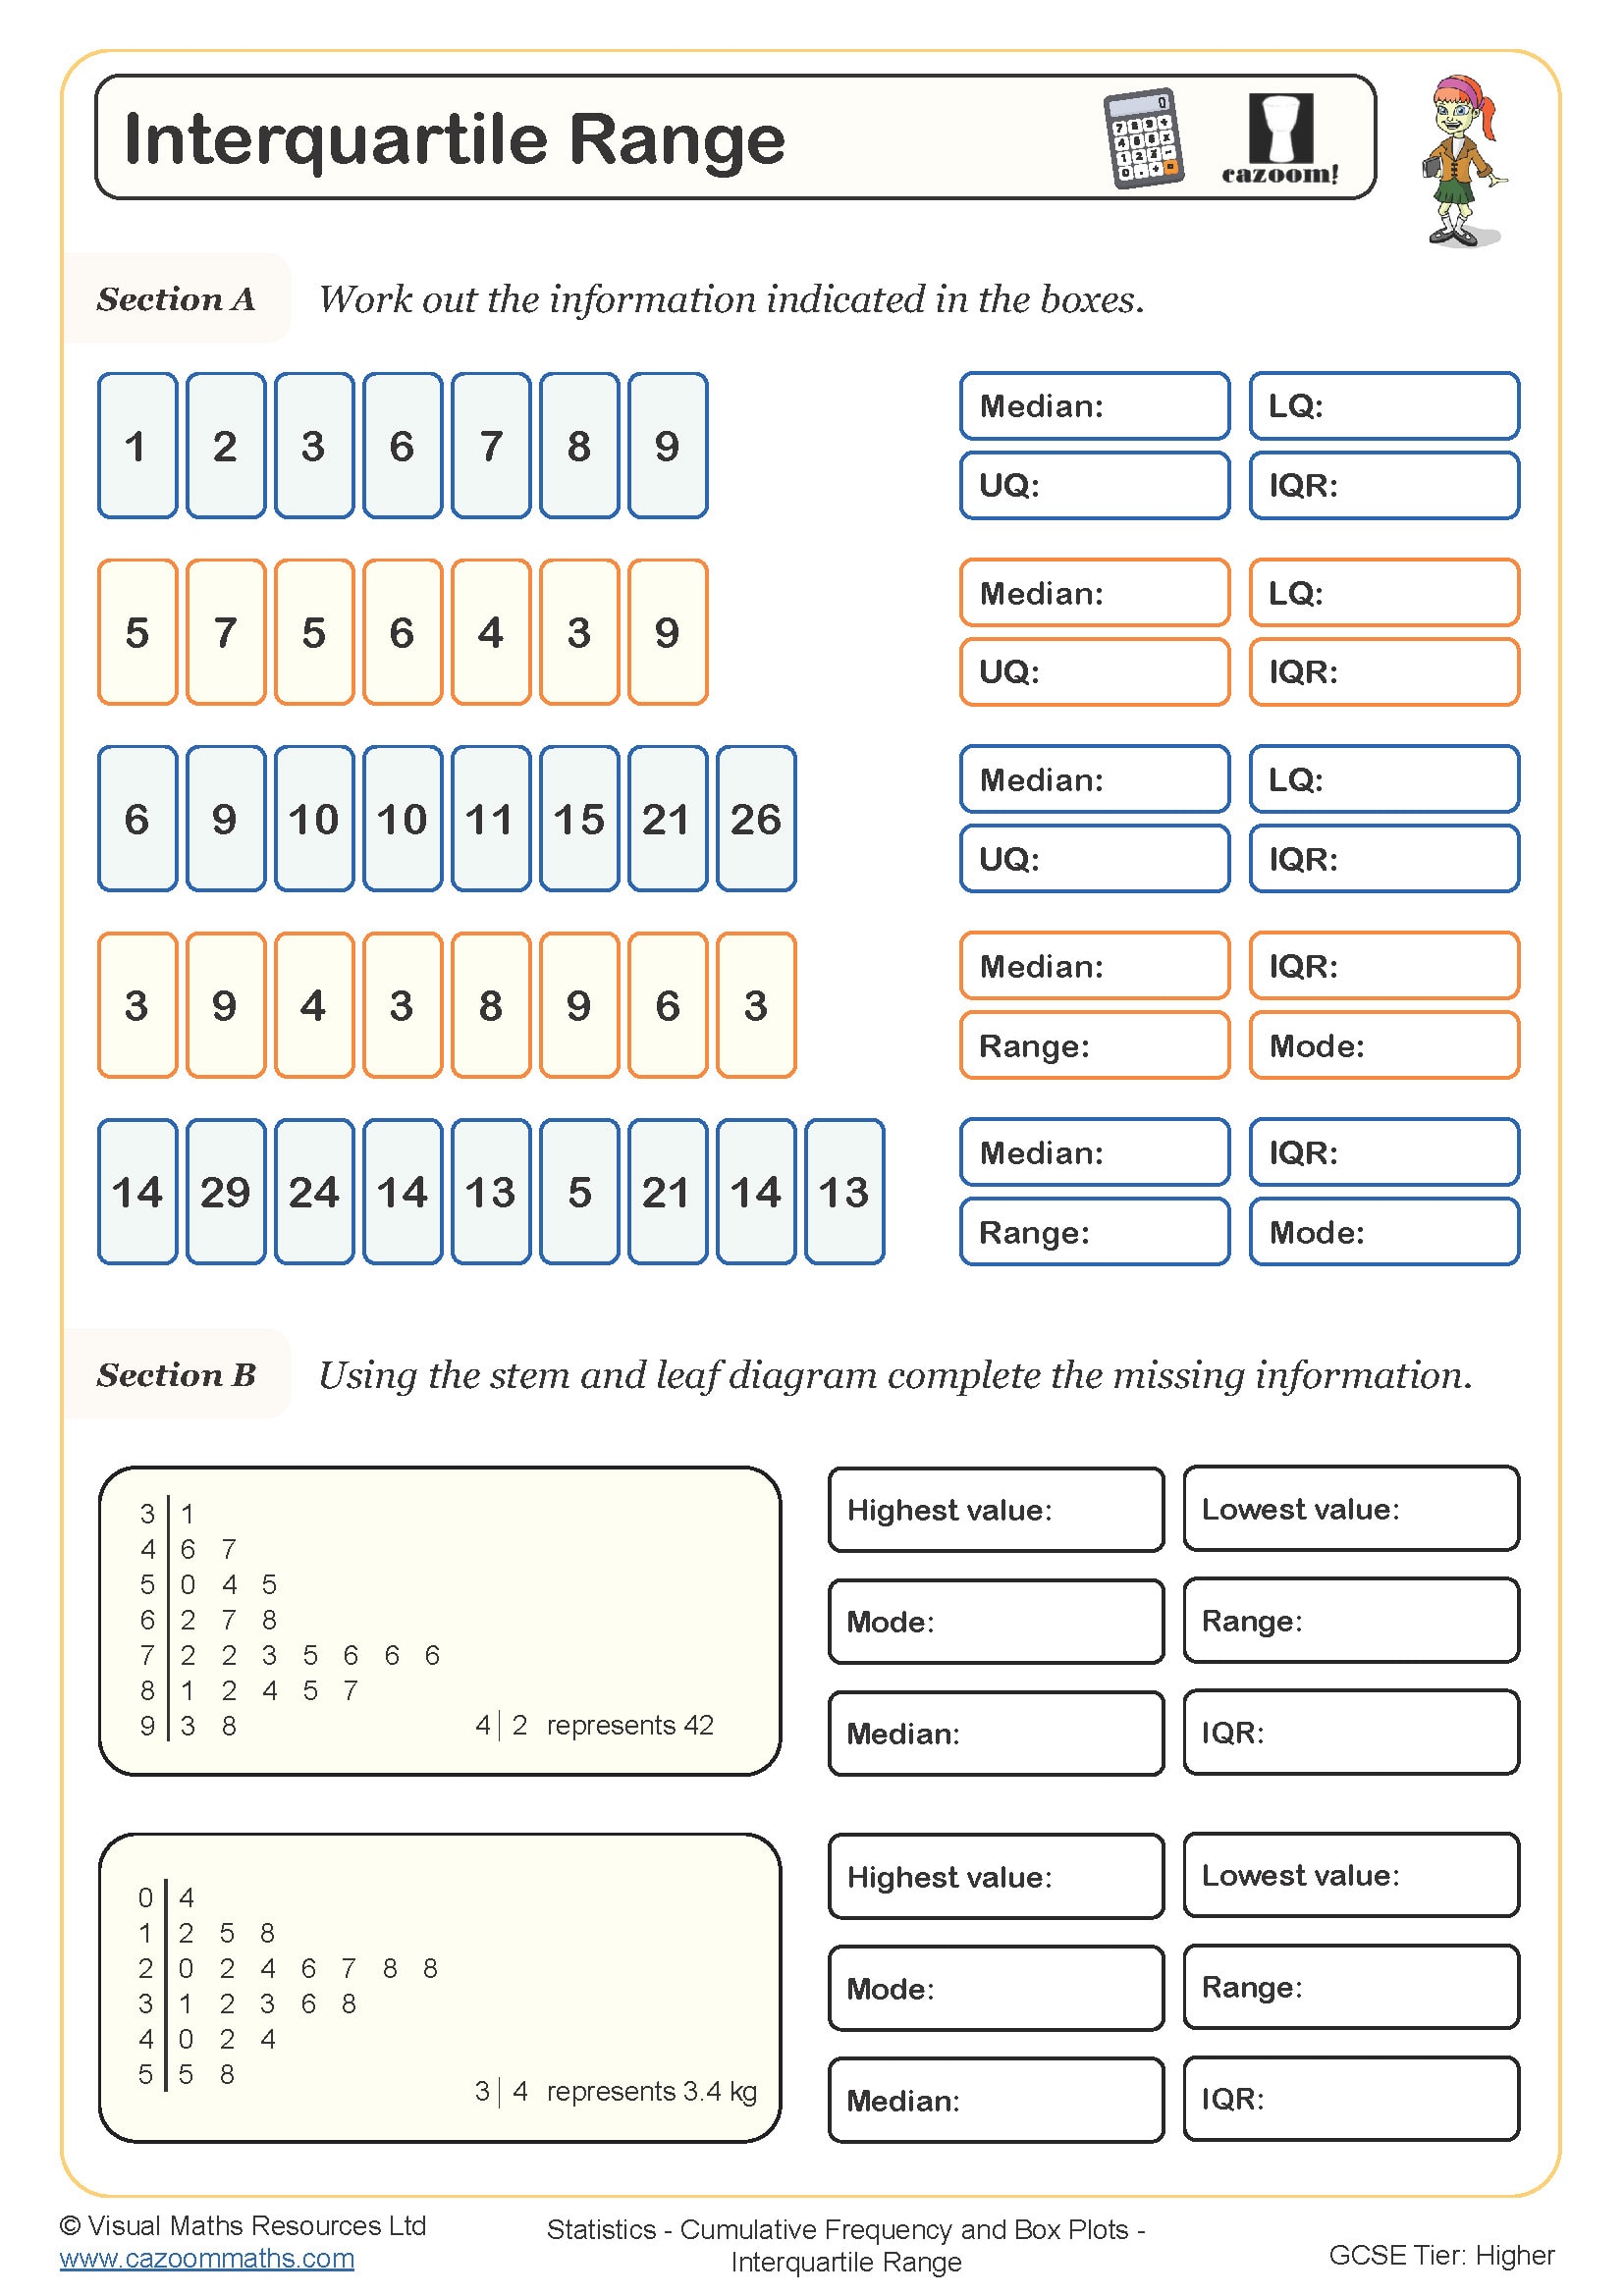
In section A, learners will need to read the lowest value, highest value, lower quartile, upper quartile and median from a given box plot and also calculate the interquartile range.
In section B, learners will need to use some given values of box lots to identify the scale on the axis, before then finding the other data points.
All worksheets are created by the team of experienced teachers at Cazoom Maths.

RELATED TO Interpreting Box Plots WORKSHEET
Frequently Asked Questions
Students should be comfortable working with averages and ranges from listed data before tackling box plots. This foundational understanding will help them grasp how the five key values (minimum, lower quartile, median, upper quartile, and maximum) relate to the data set being represented. Having this prerequisite knowledge means learners can focus on interpreting the visual representation rather than struggling with the underlying statistical concepts.