Interpreting Graphs WORKSHEET
Interpreting Graphs WORKSHEET DESCRIPTION
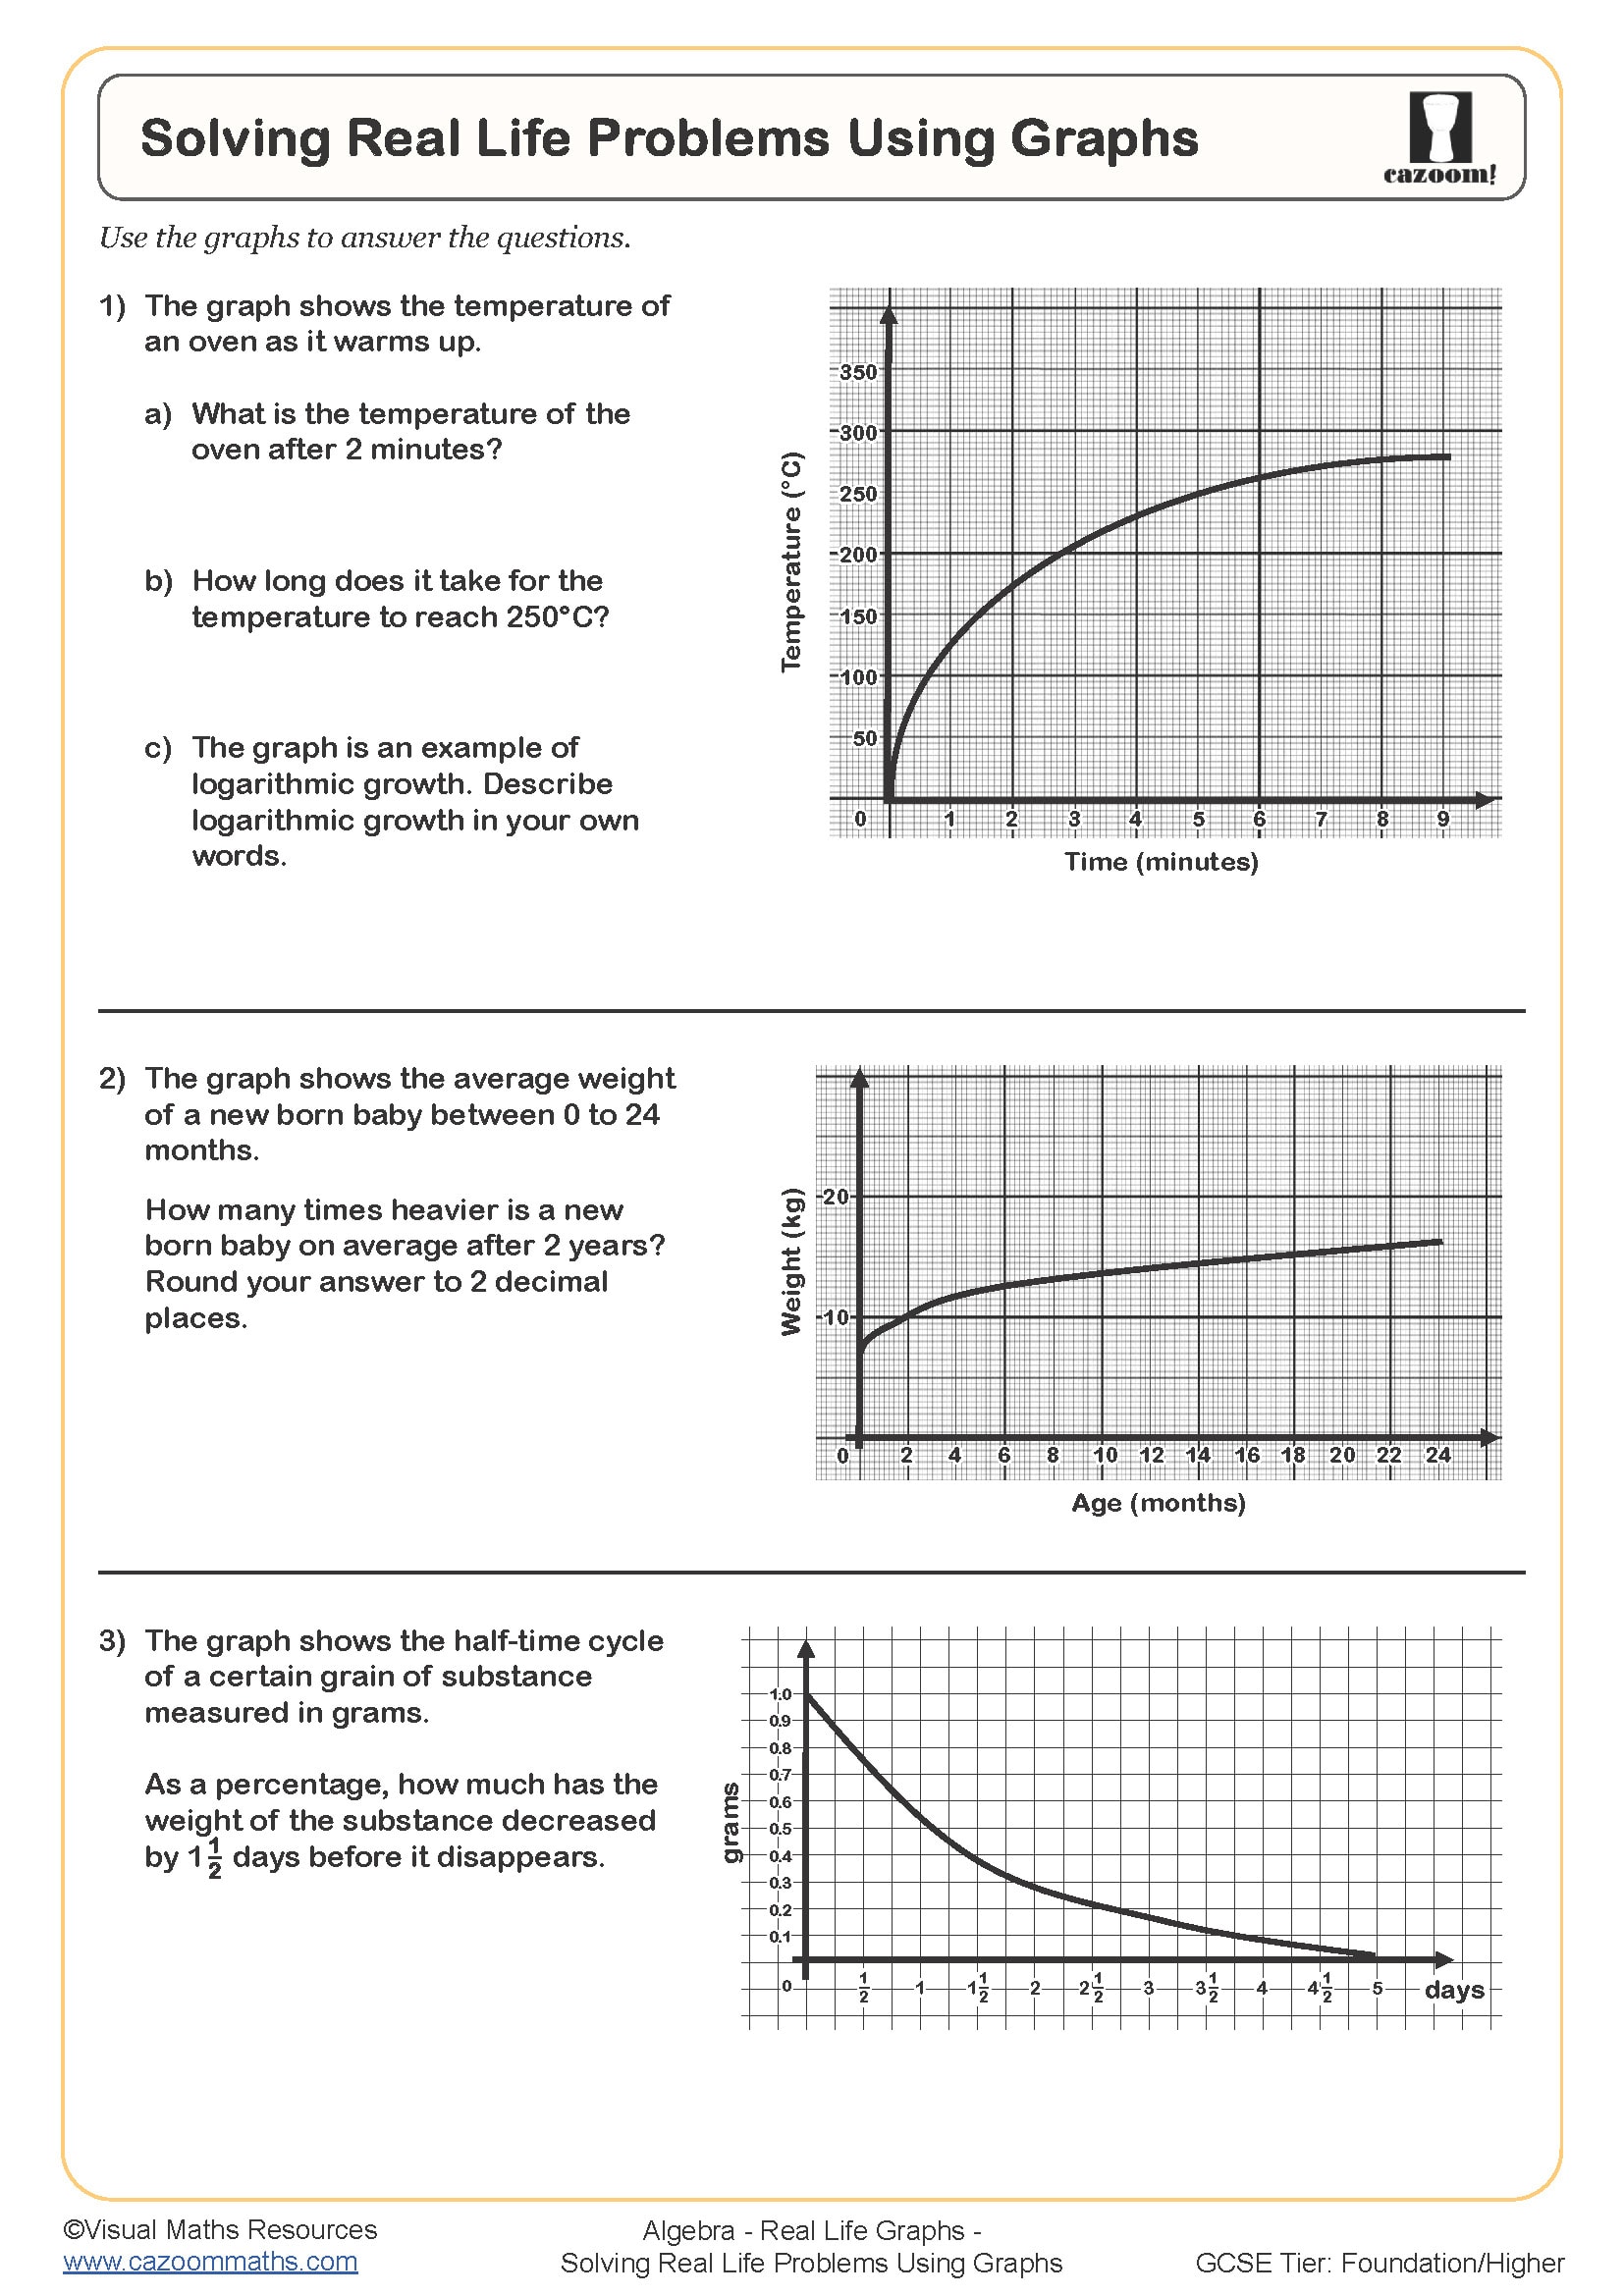
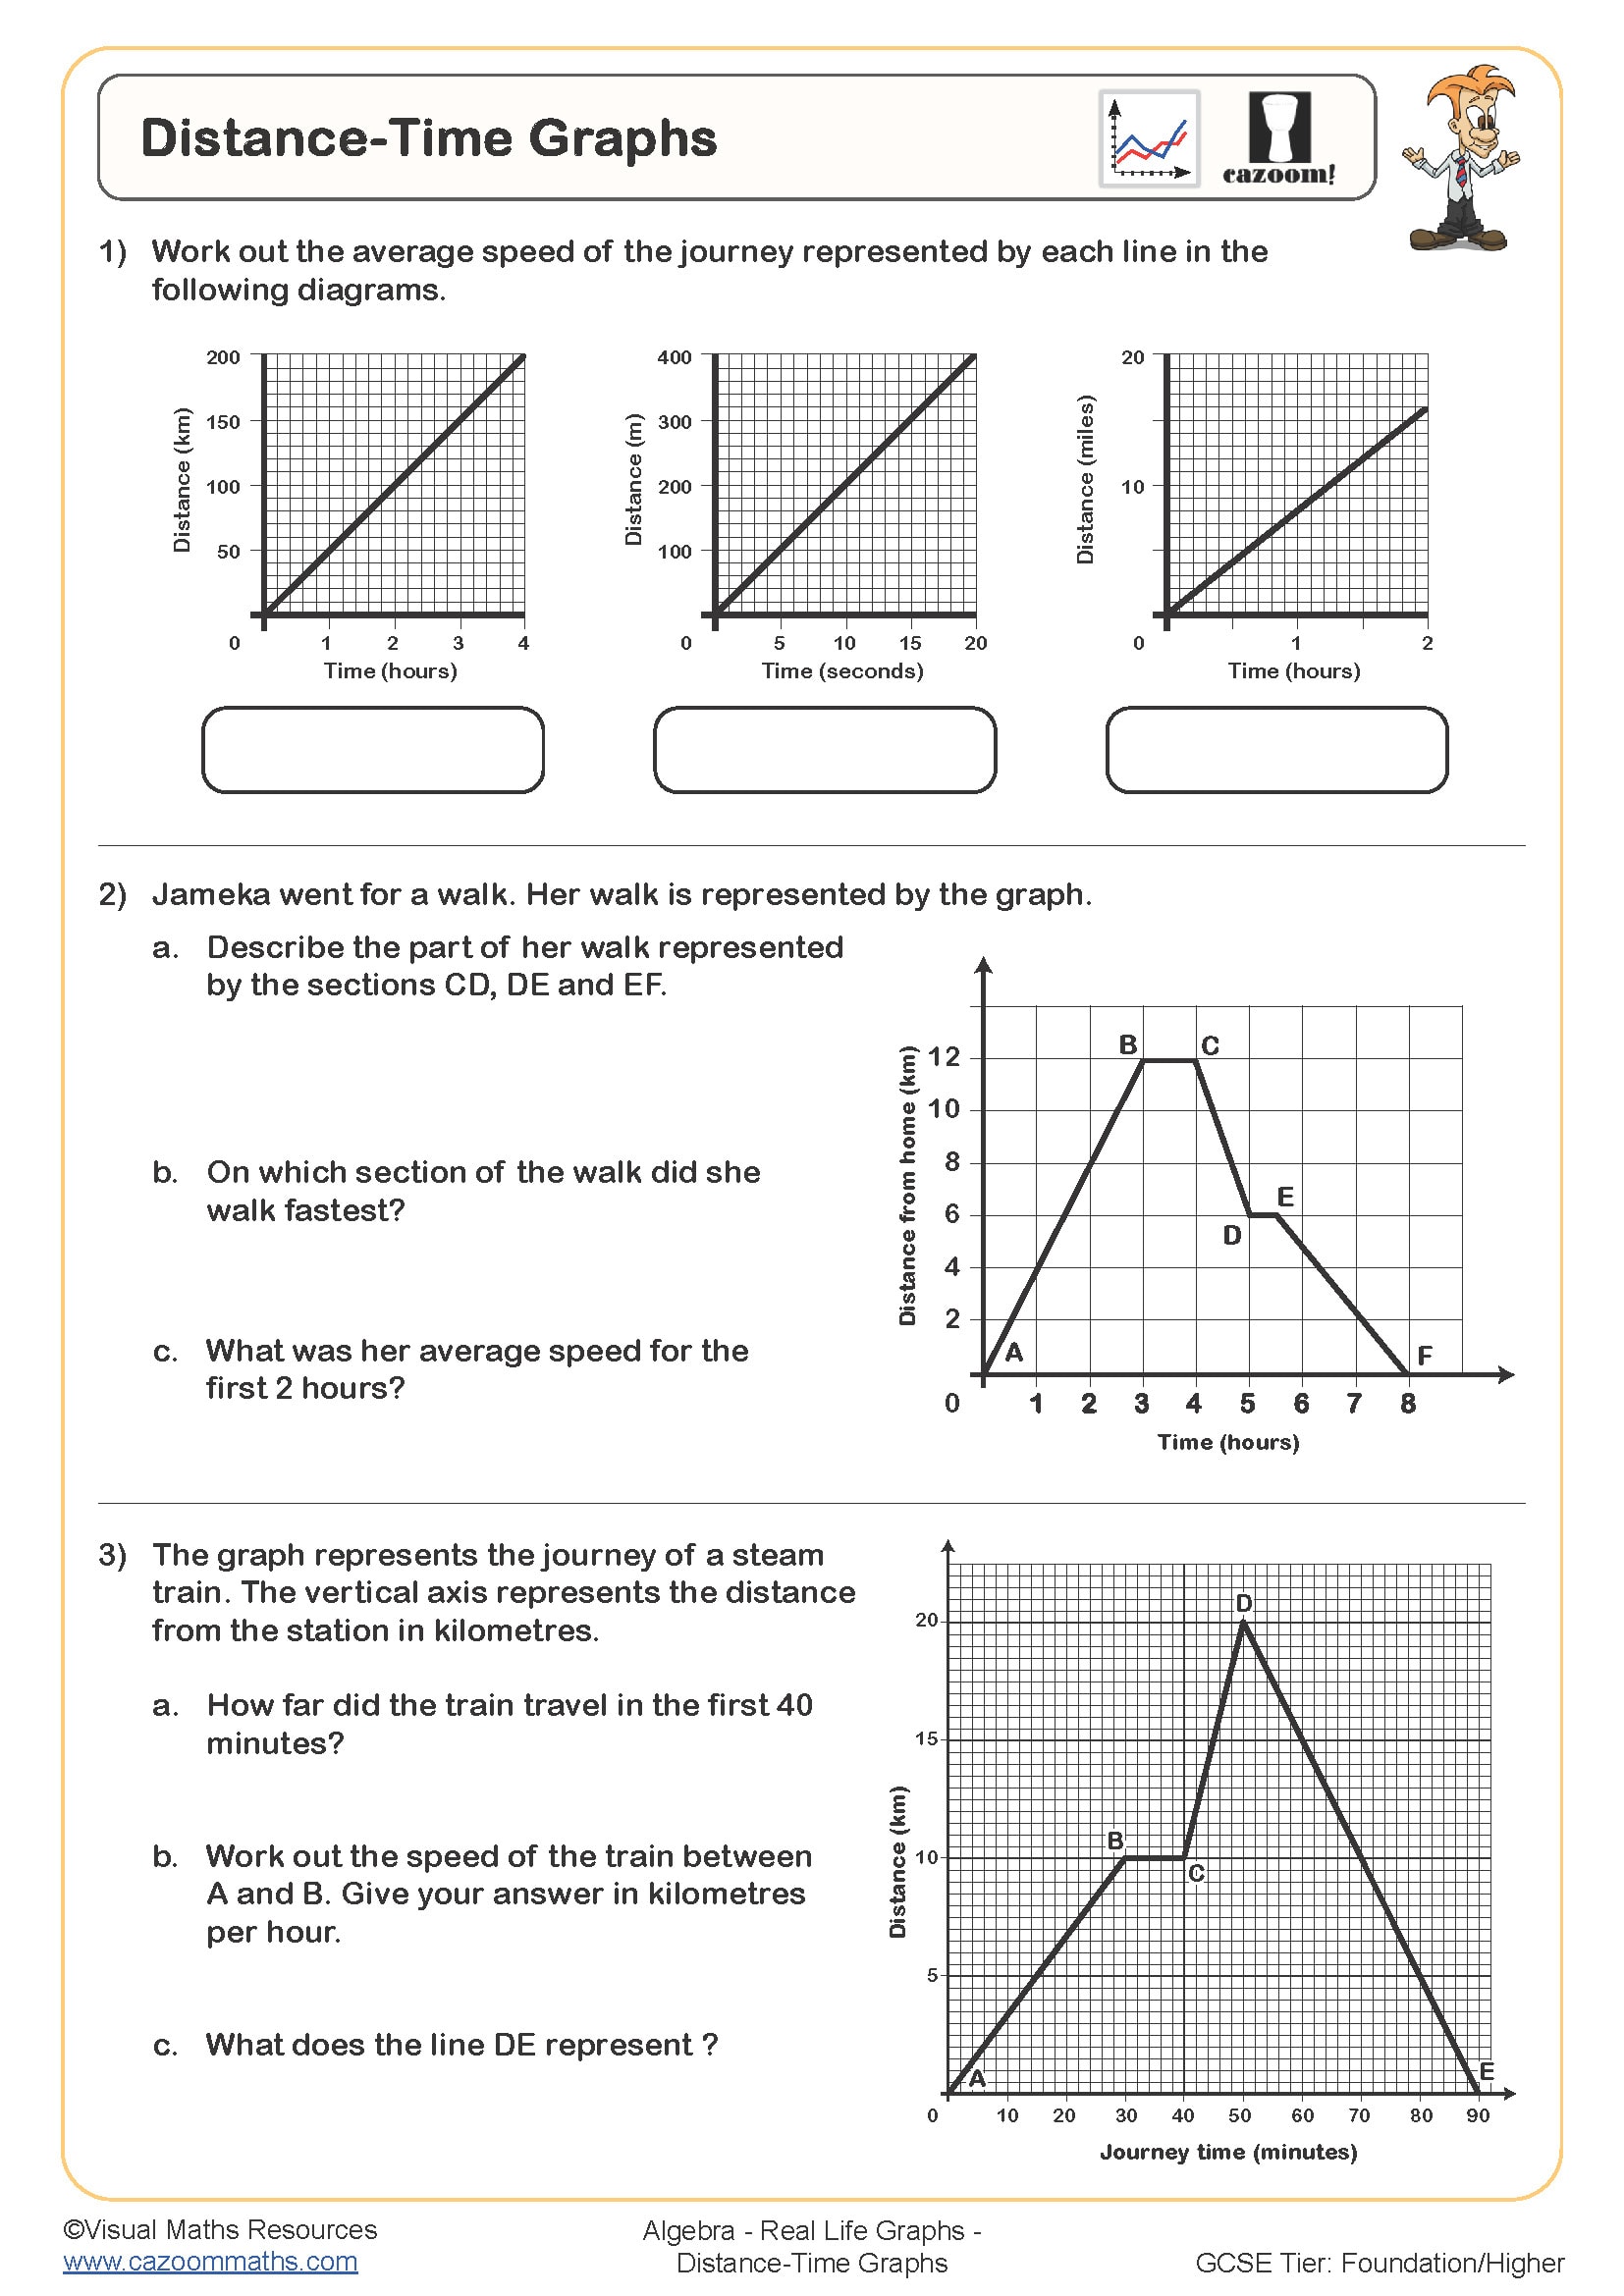
Pupils will interpret various forms of real-life graphs throughout this worksheet.
Students will start by matching different graphs to scenarios that they could represent in section A. Graphs include straight lines and increasing and decreasing curves, starting from the origin or otherwise. Scenarios include “Unemployment rose slowly for 5 years, but now it is rising dramatically” and “The temperature during the 24 hours of a summer's day.”
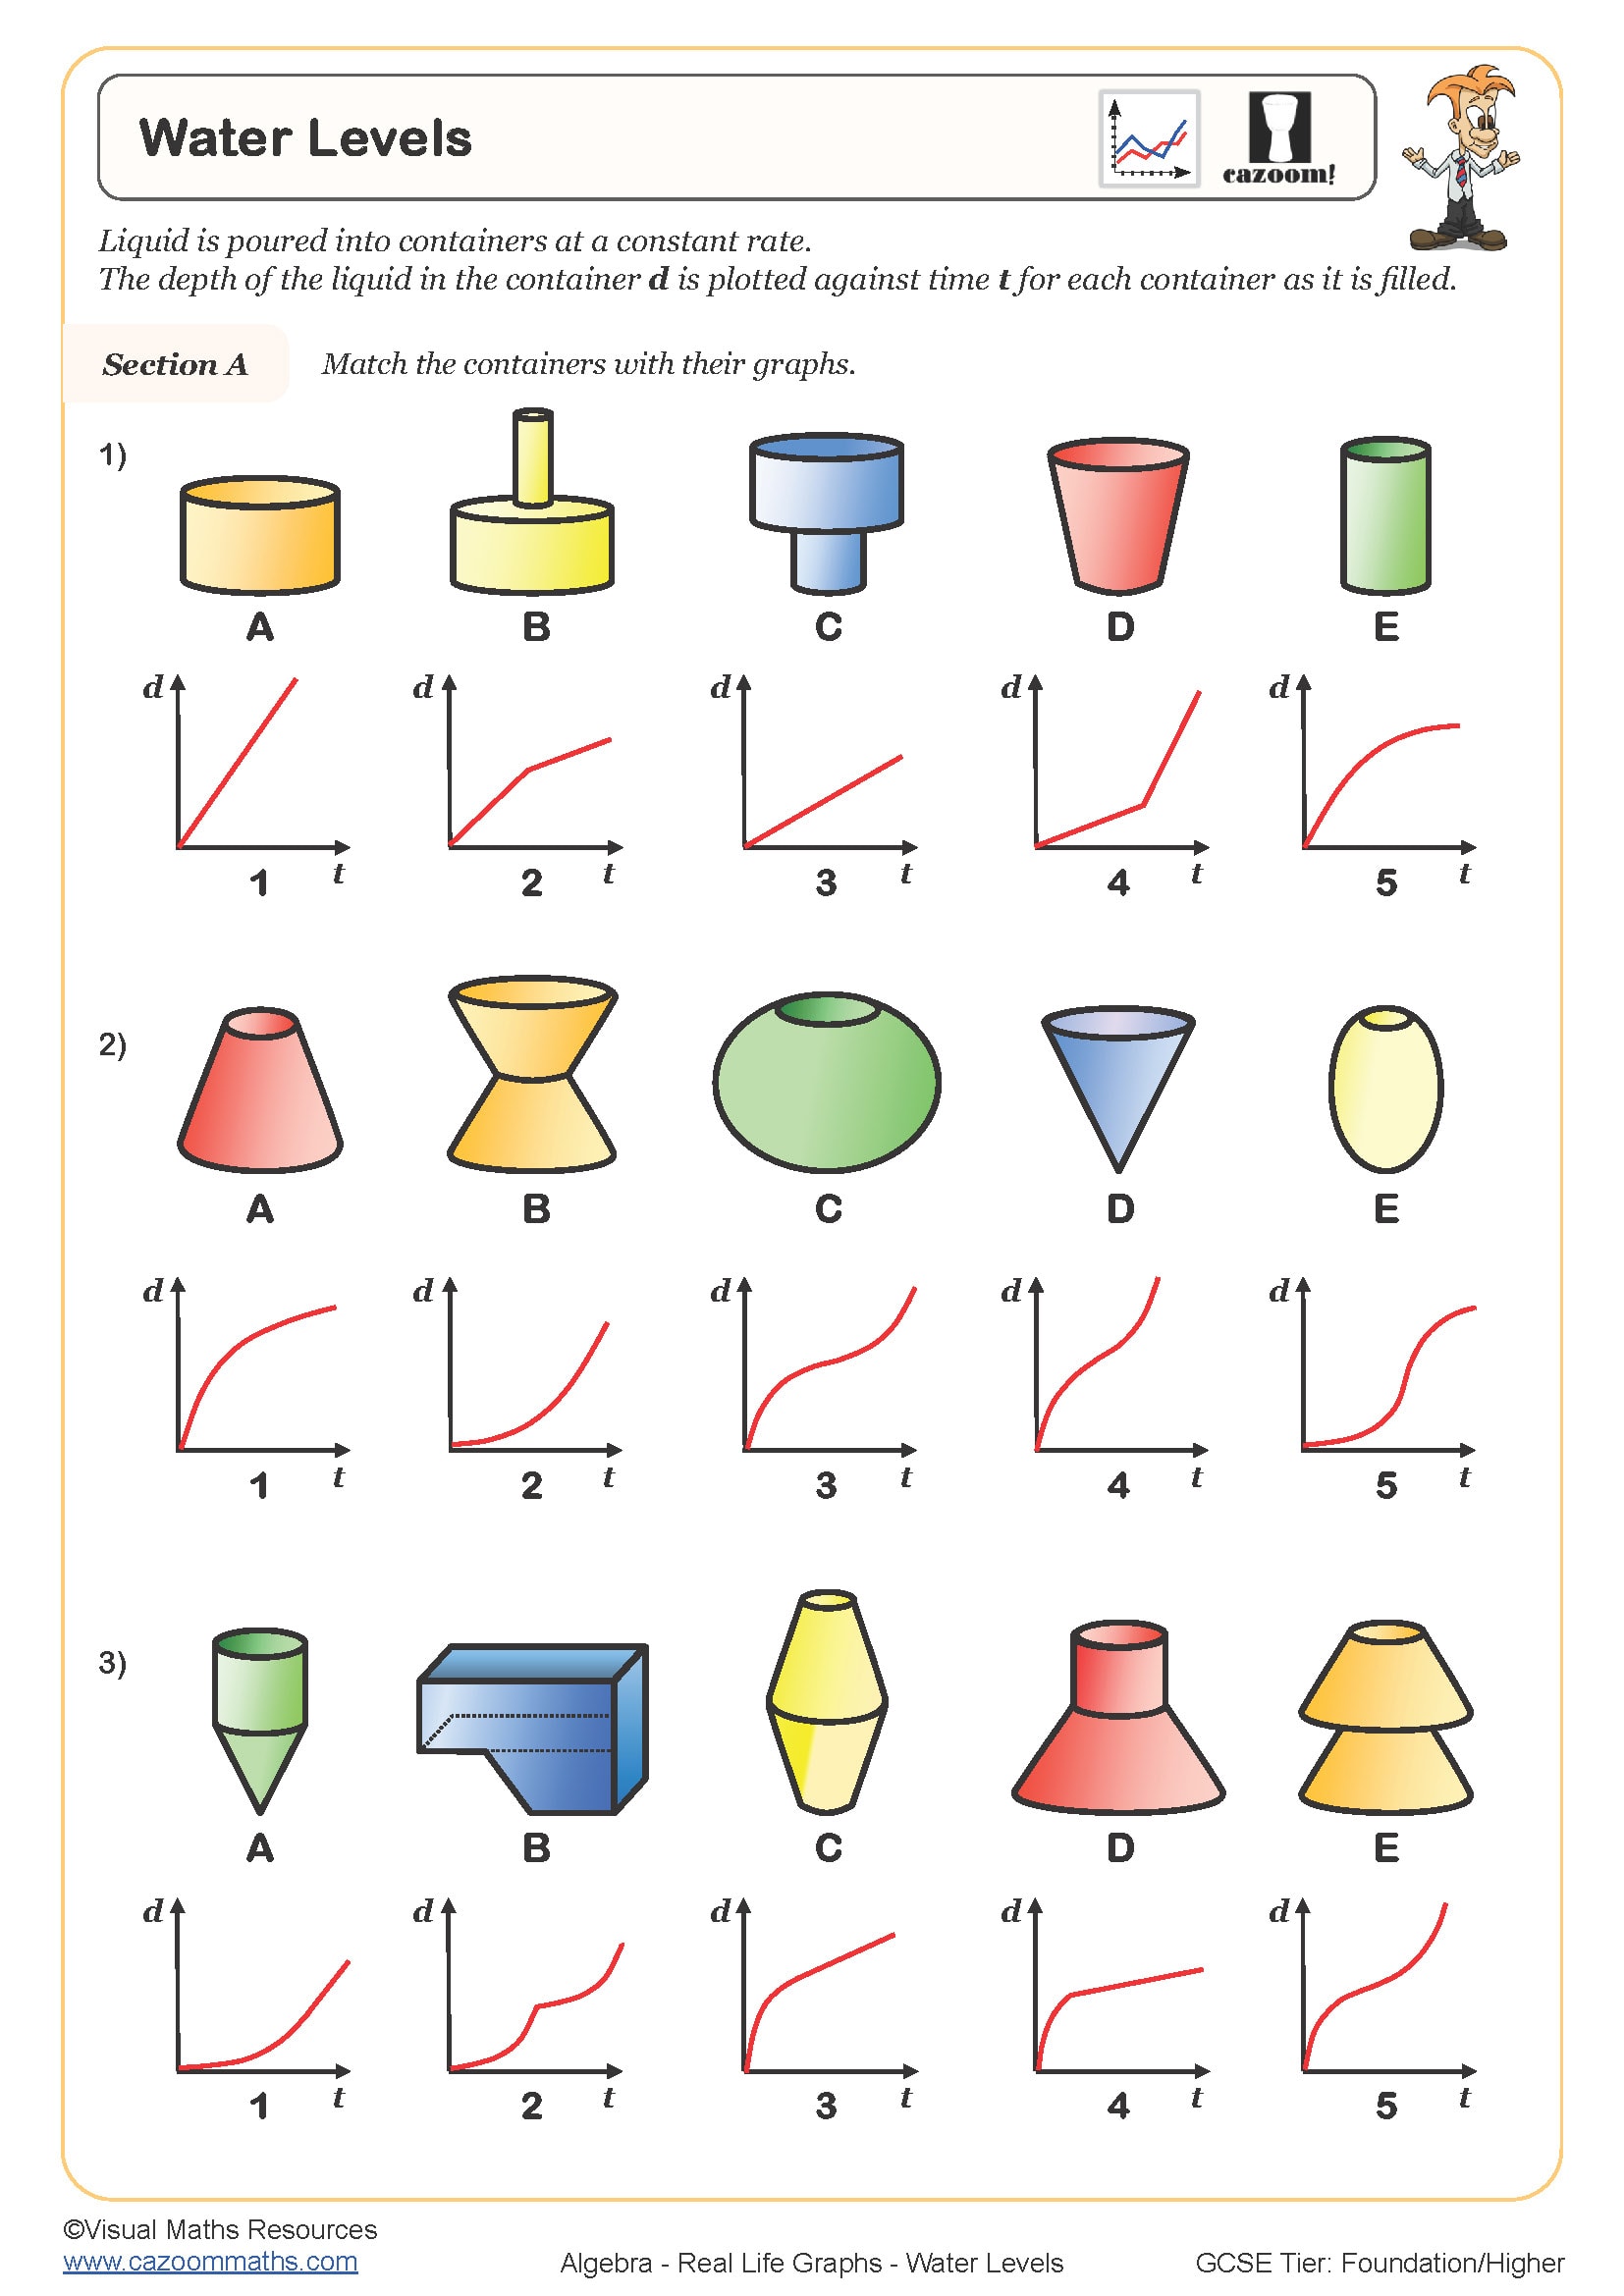
In section B, students have four different depth and time graphs of bathtubs being filled to interpret.
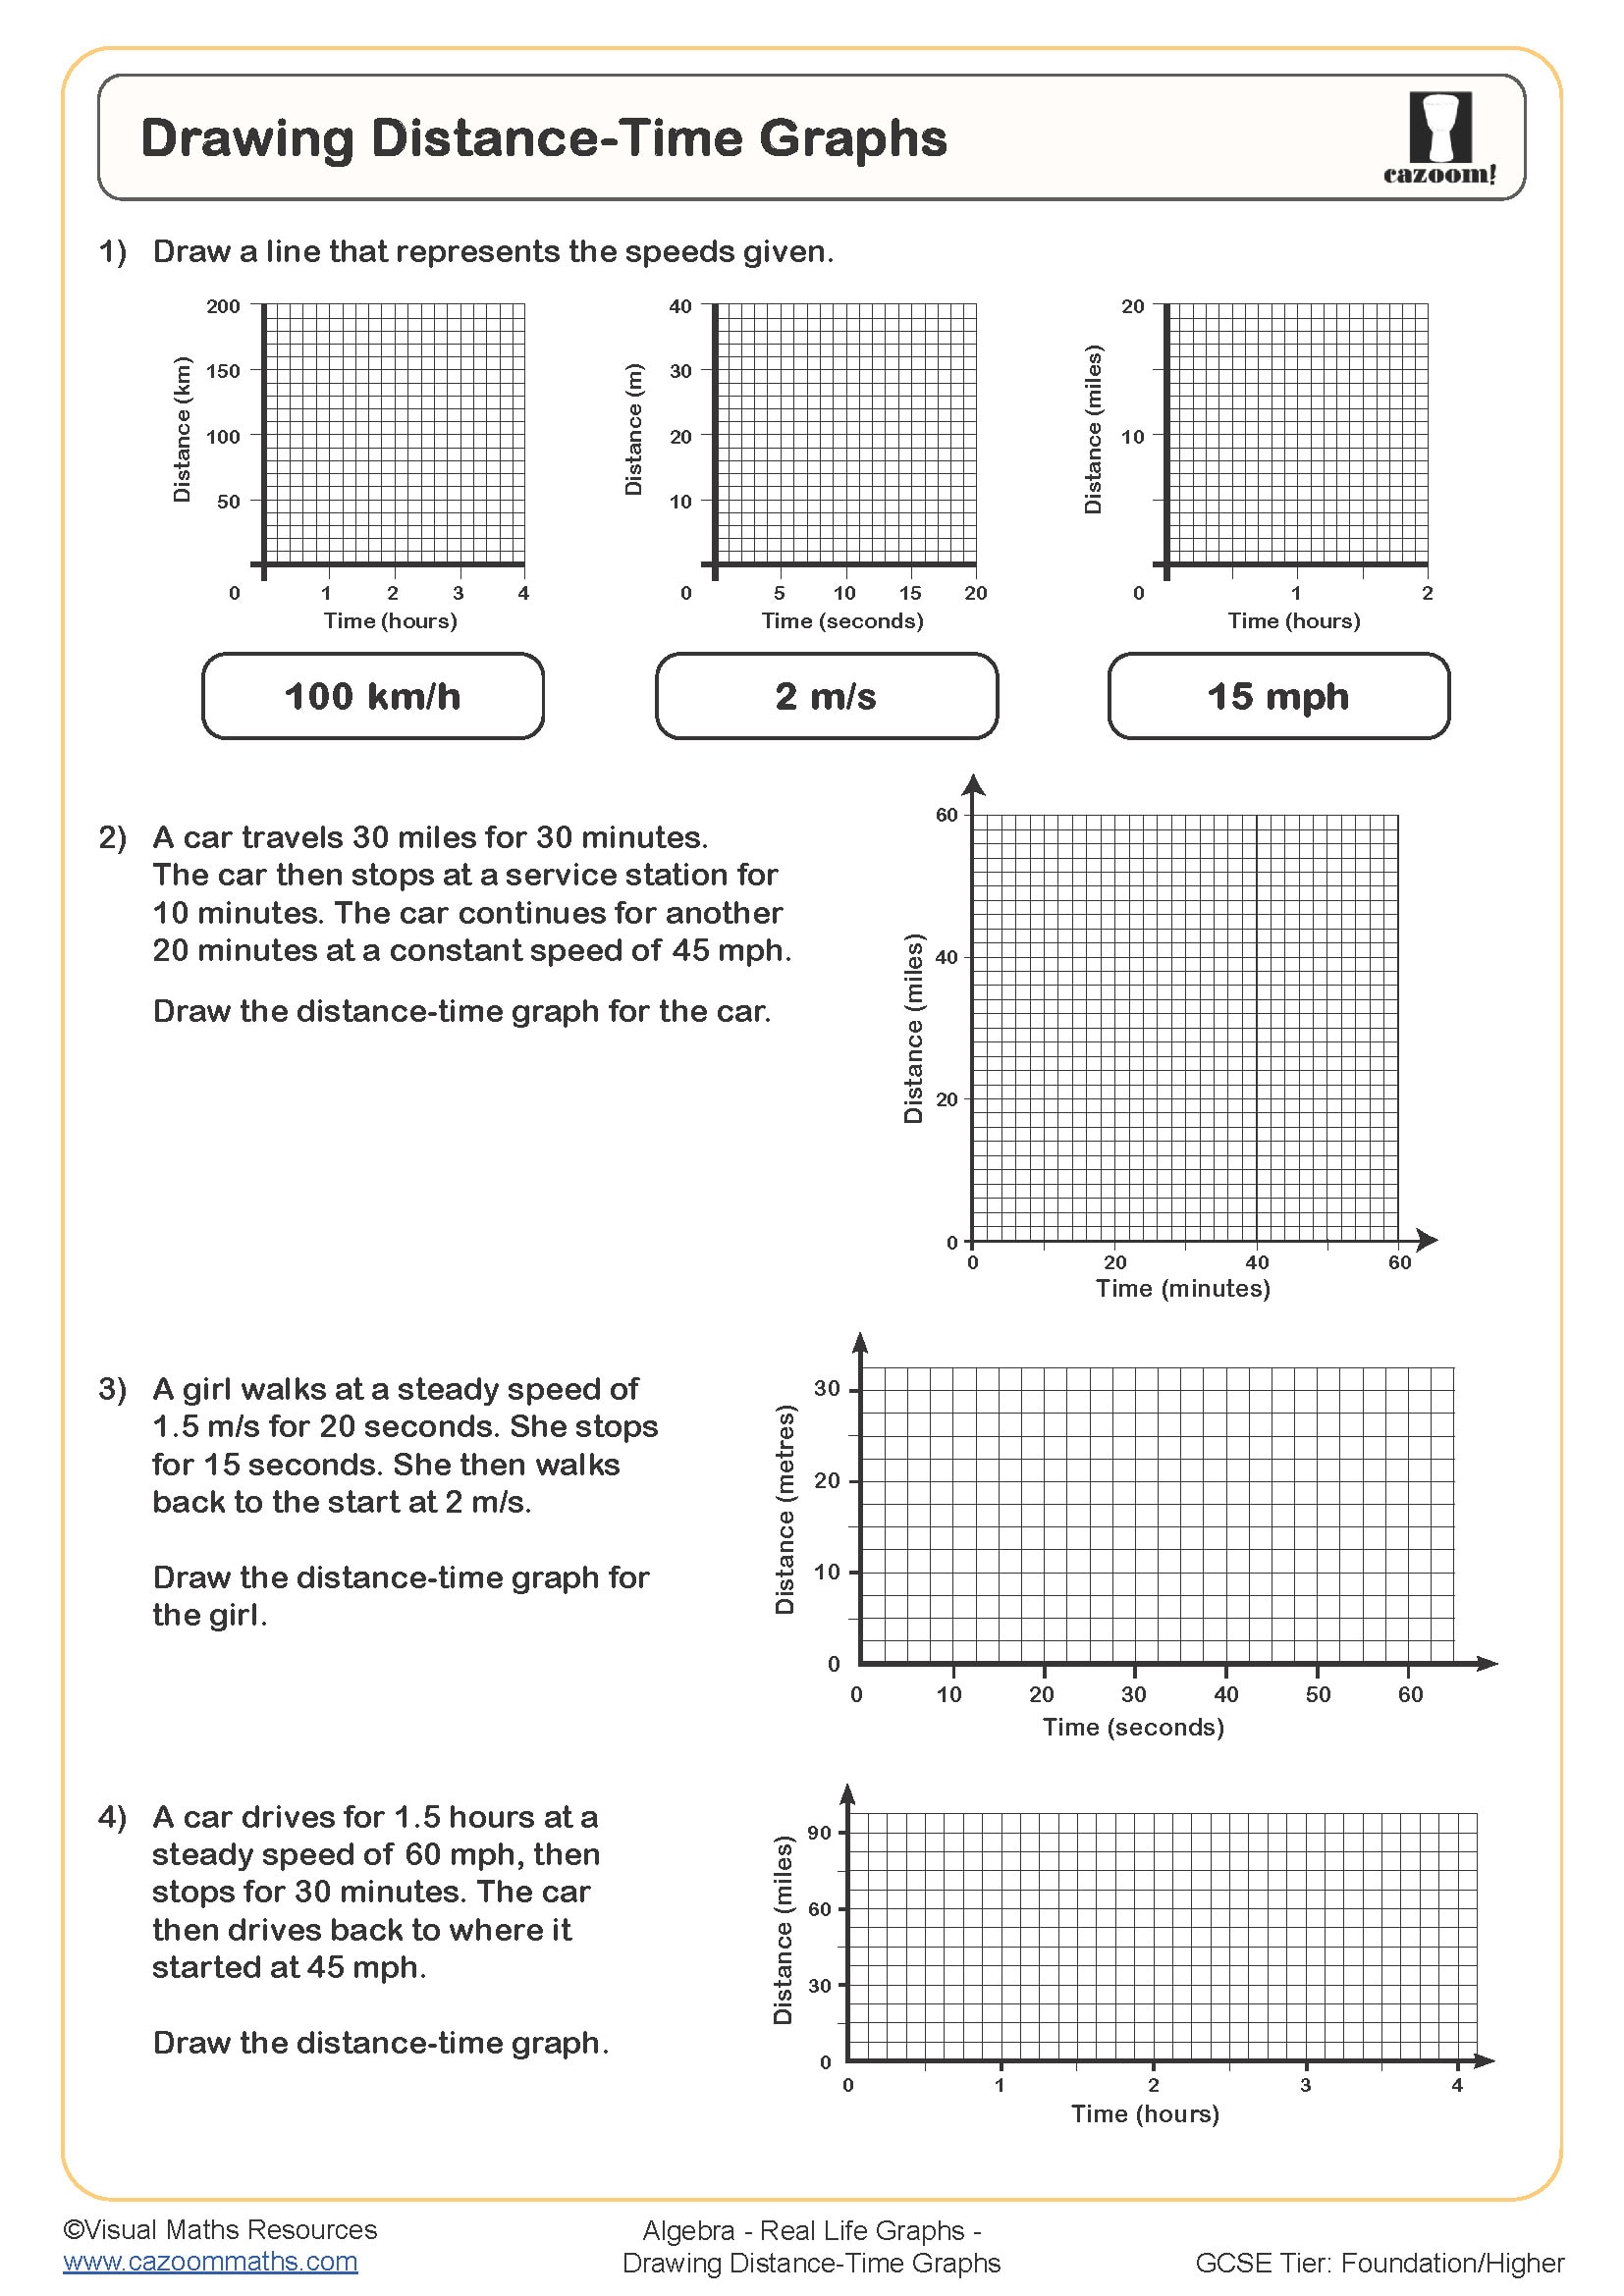
Then in section C, learners will sketch graphs to illustrate four different situations. Axes are pre-drawn for your students.
All worksheets are created by the team of experienced teachers at Cazoom Maths.

RELATED TO Interpreting Graphs WORKSHEET
Frequently Asked Questions
This worksheet is designed for Year 8 and Year 9 students who are developing their graph interpretation skills. It's particularly useful for pupils working towards GCSE grades 4-5, as it builds the foundation for understanding how mathematical graphs represent real-world situations. The variety of contexts, from unemployment statistics to temperature changes, helps students at this level connect abstract mathematical concepts to everyday scenarios.