Investigating Quadratic Graphs WORKSHEET
Substitution into algebraic expressions. Understanding of coordinates and plotting points on Cartesian axes. Knowledge of basic graph shapes, especially y = x2.
Investigating Quadratic Graphs WORKSHEET DESCRIPTION
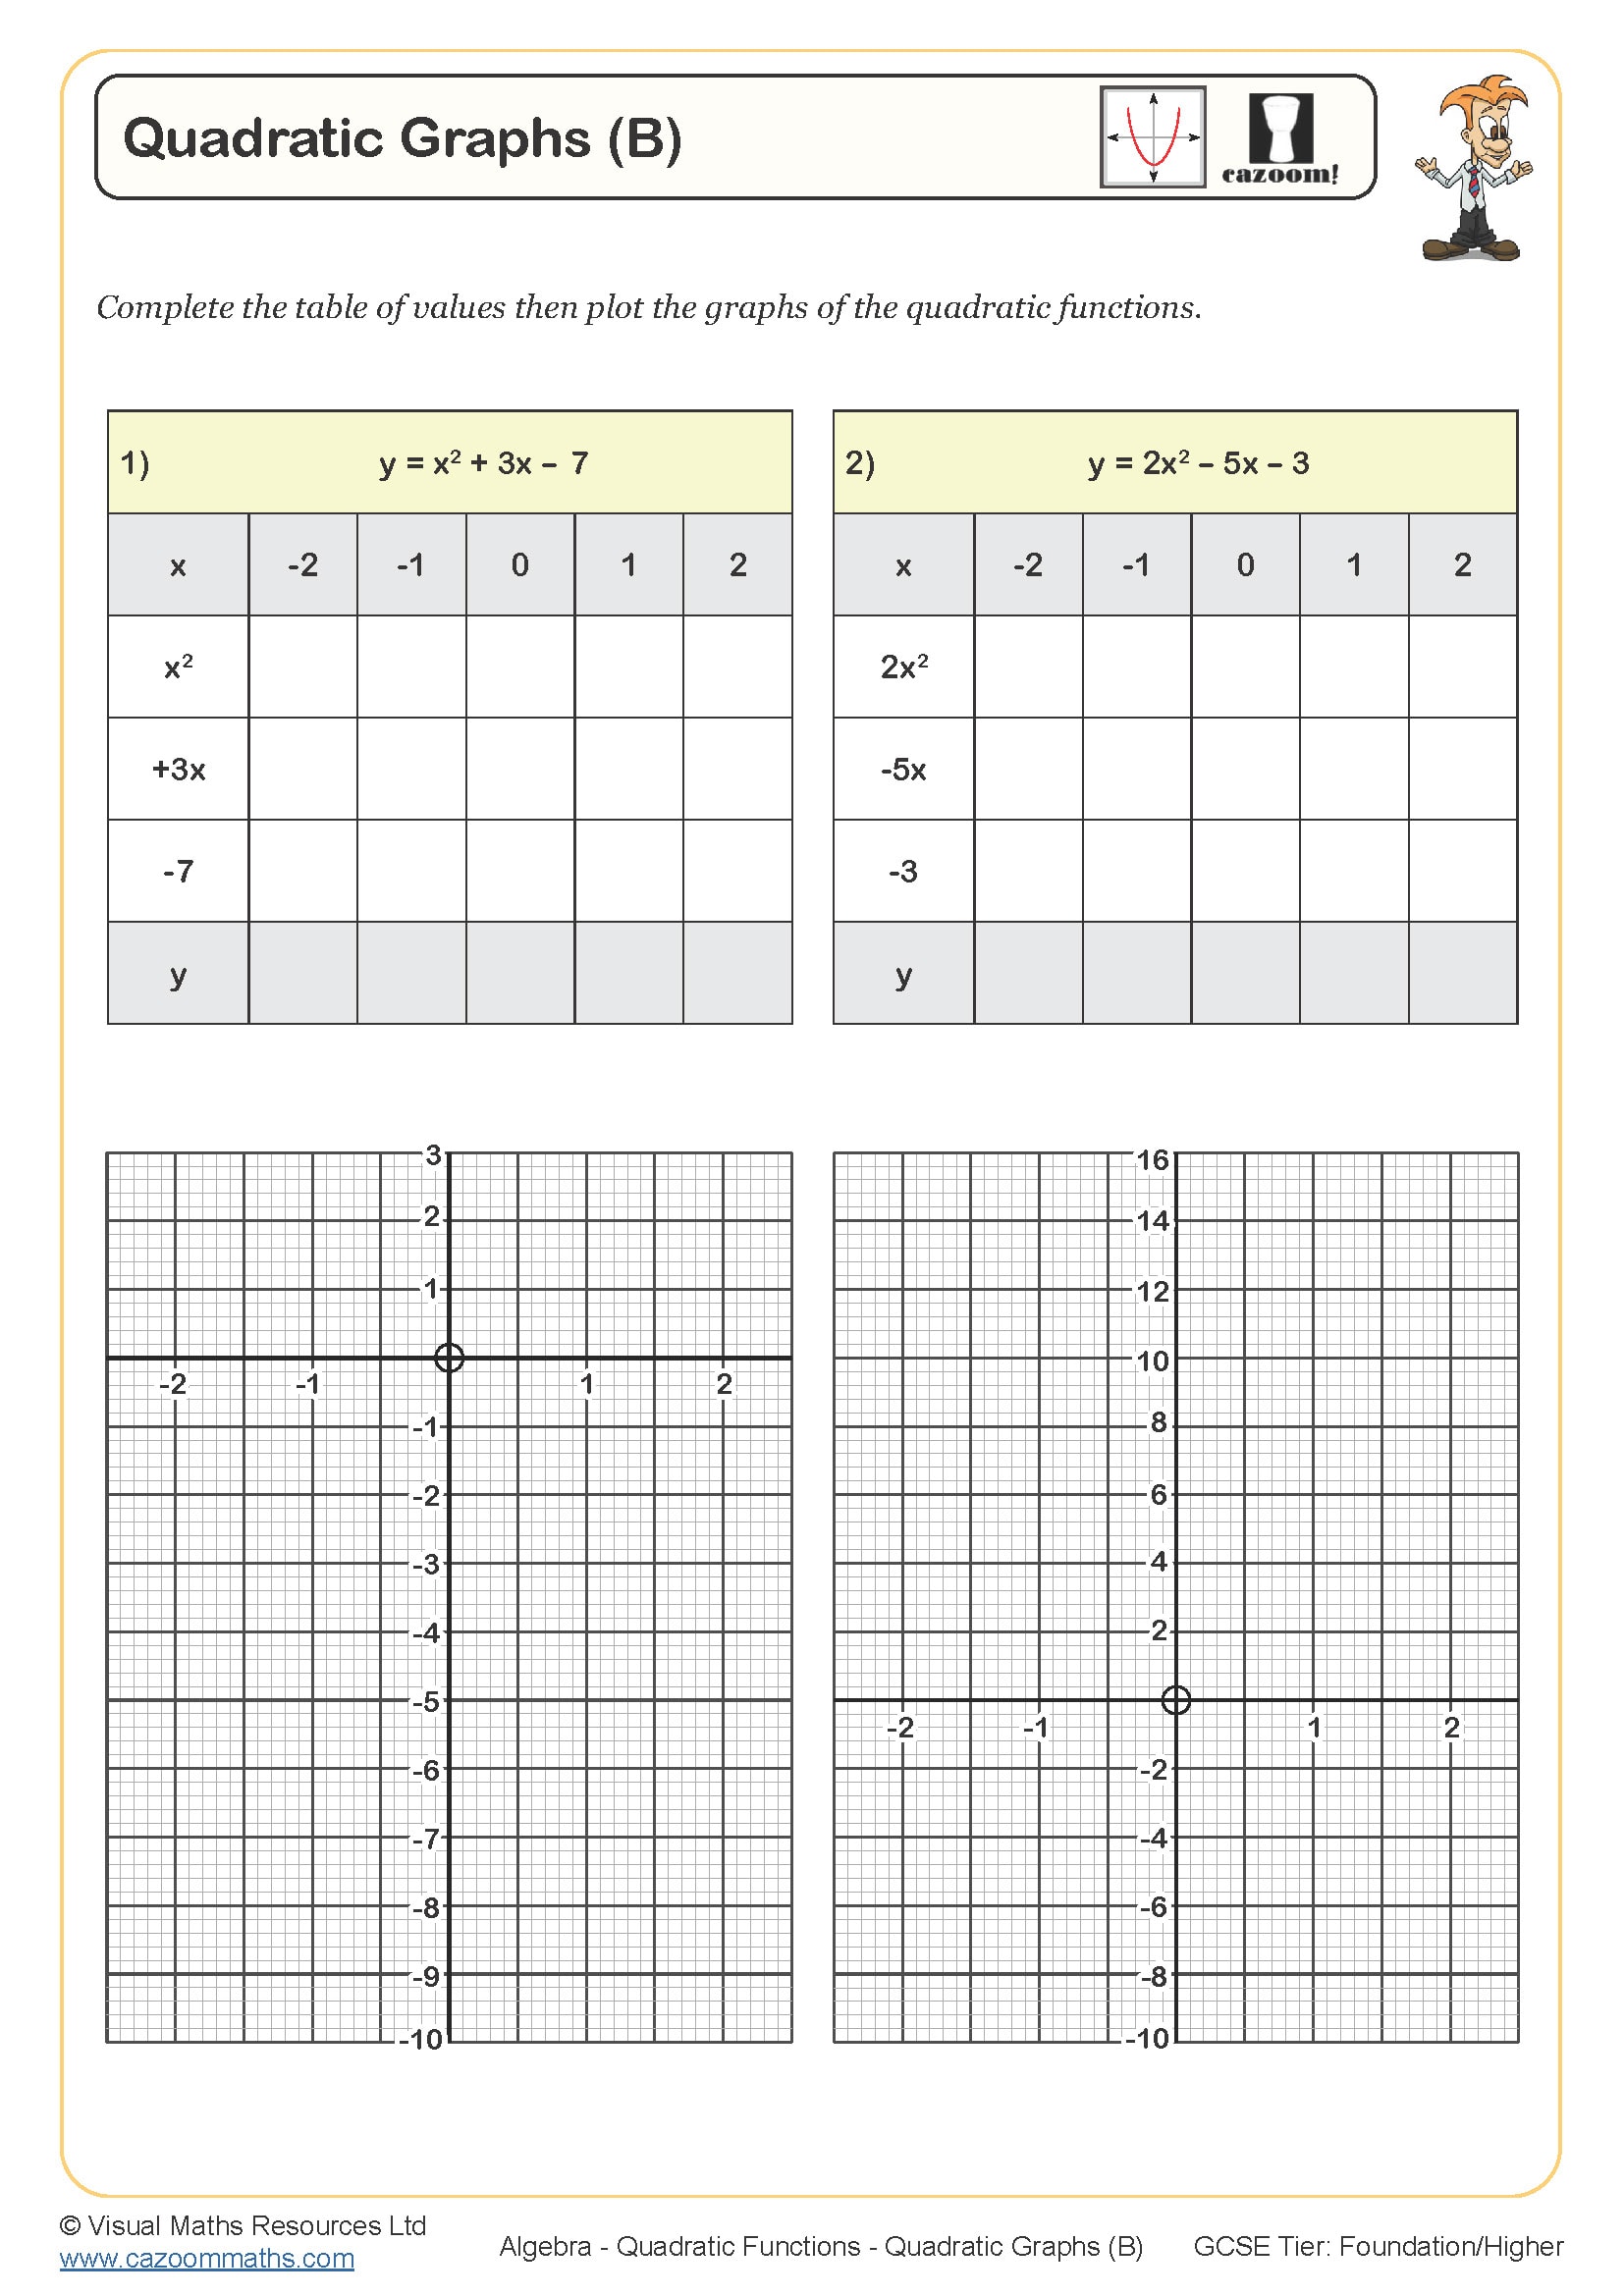
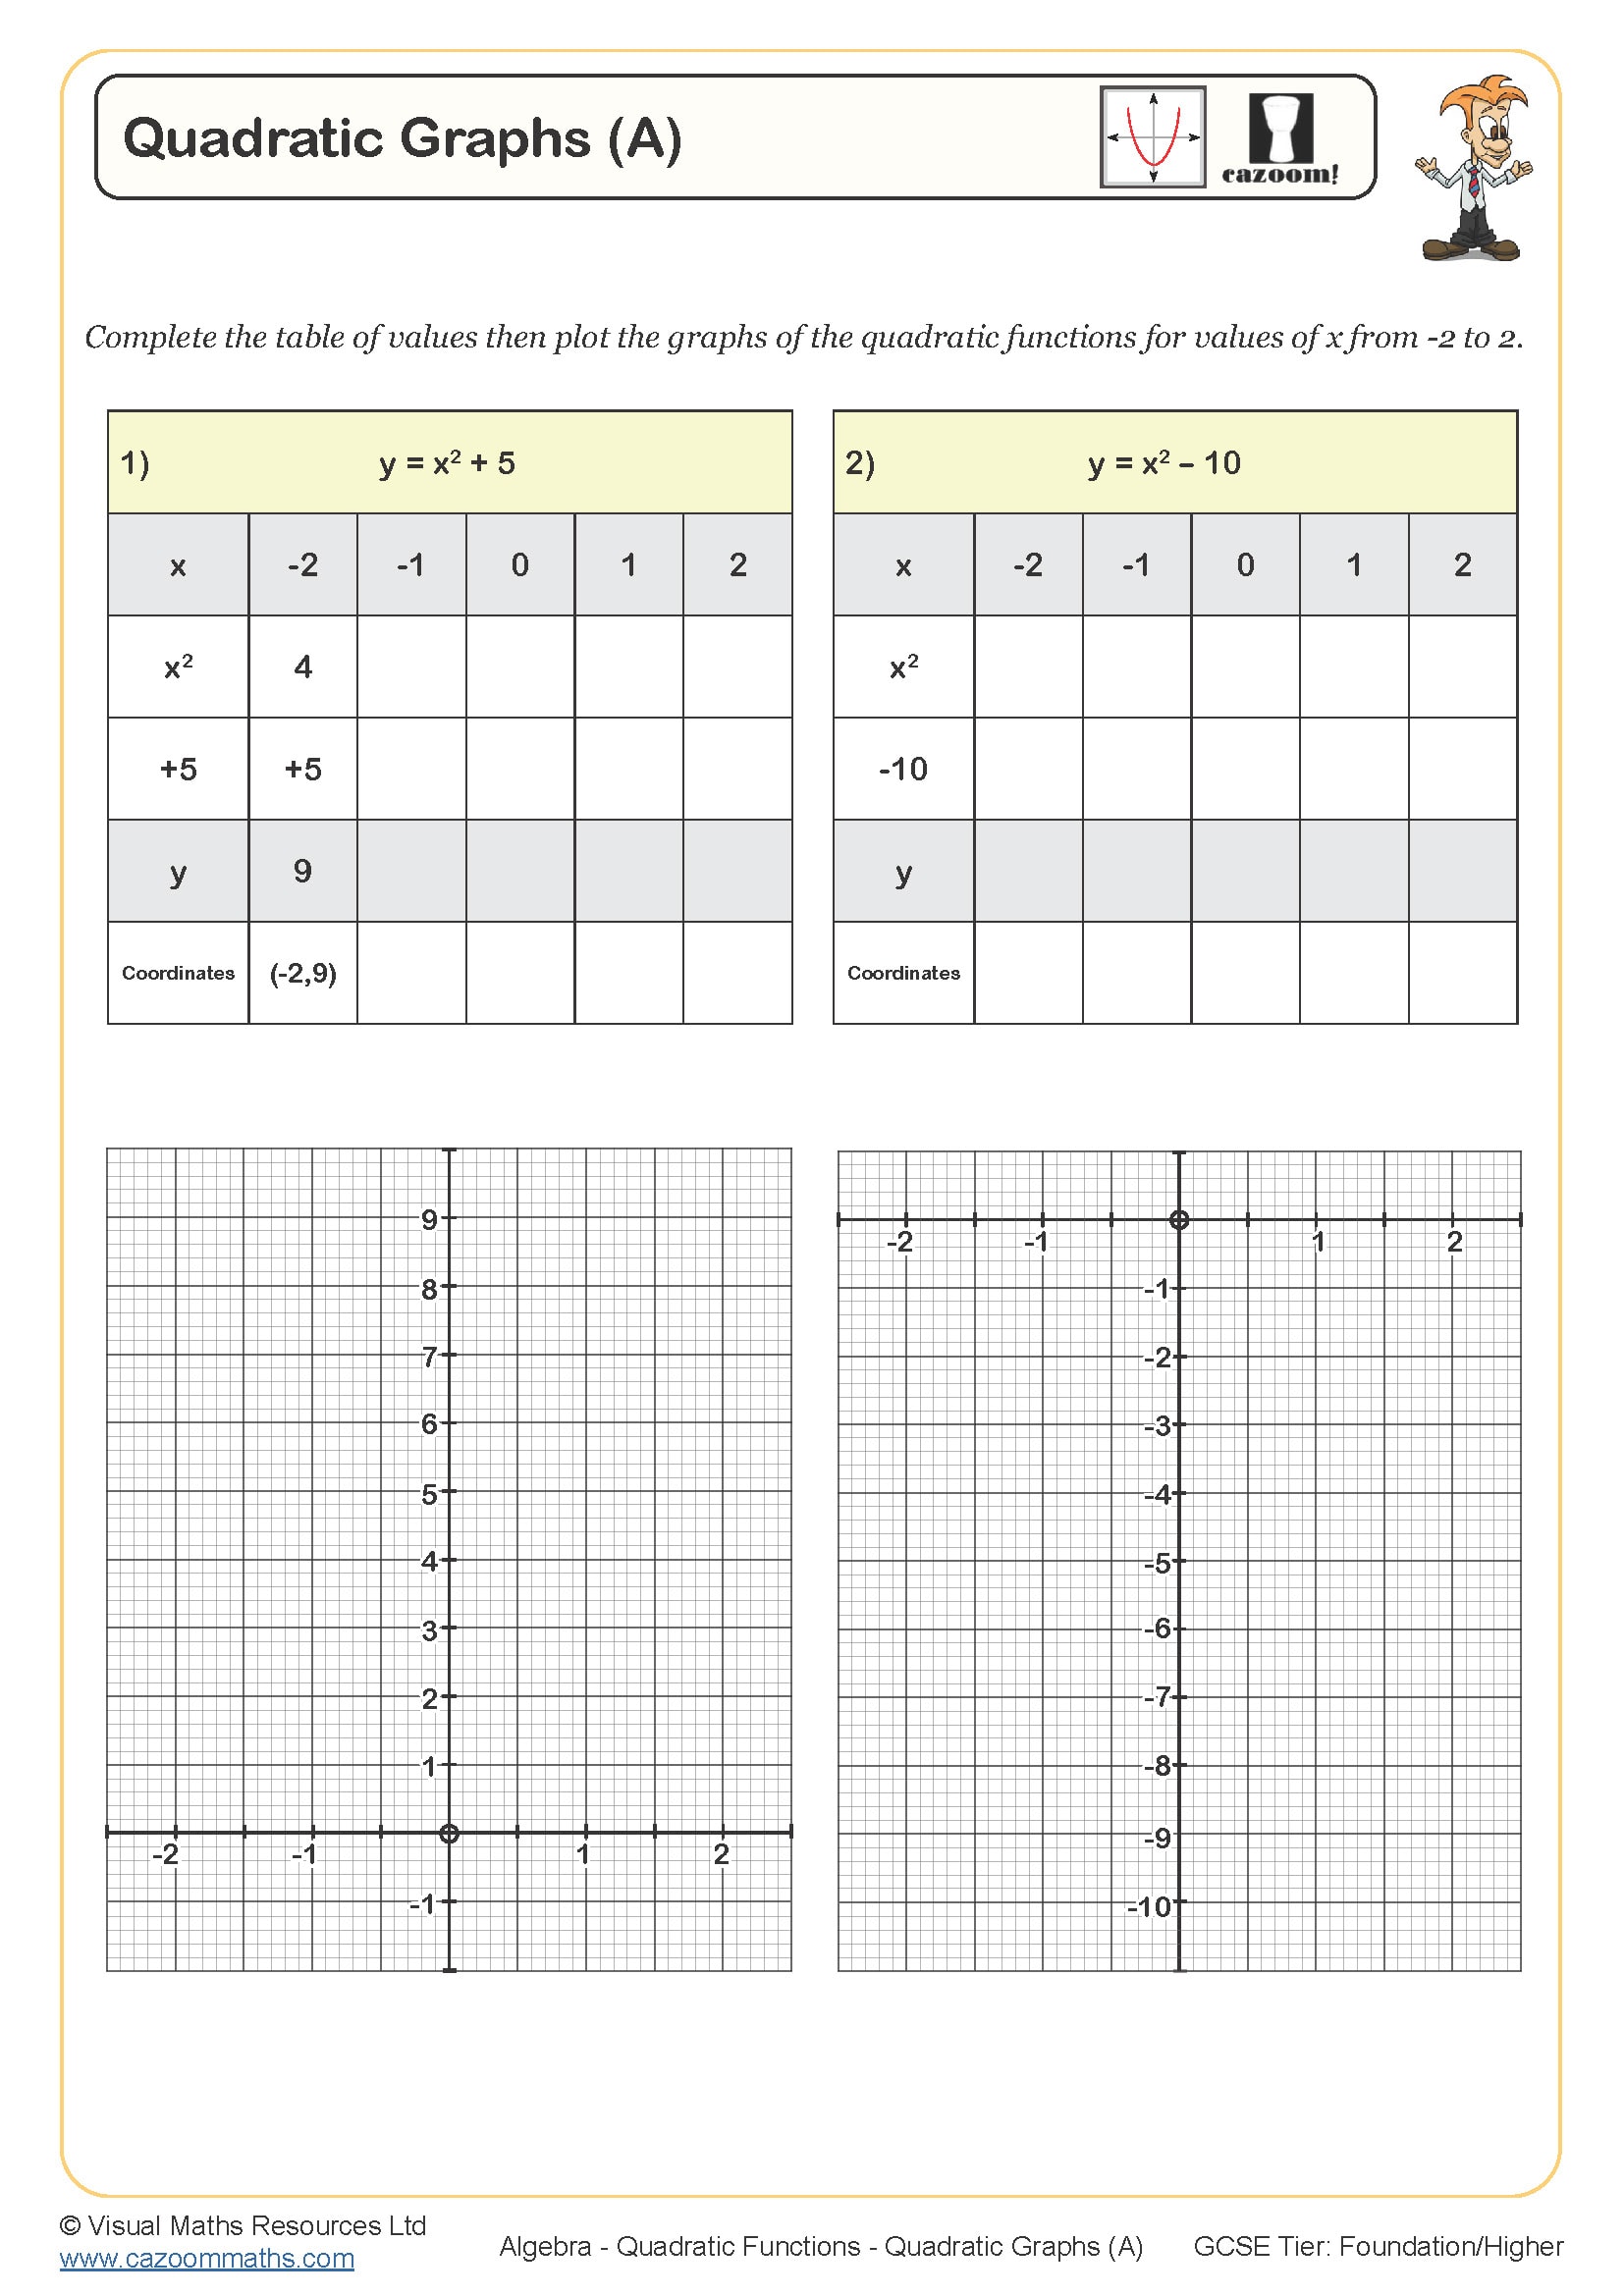
This investigation helps students explore how changing variables in quadratic equations of the form y = ax2 + c affects the shape and position of quadratic graphs, through the use of graphing software such as Desmos or GeoGebra.
In Section A, learners experiment with y = ax2 to discover how the value of a influences the direction and steepness of the parabola. Section B focuses on vertical translations using y = x2 + c, allowing students to observe how the constant term moves the curve up or down. Section C combines both parameters, deepening understanding of how these features interact to produce a range of parabolic graphs. Finally, Section D challenges students to match equations to points, construct new parabolas with specific features, and form equations from given conditions. The worksheet supports conceptual fluency, linking graphical representations to algebraic equations through visual reasoning.
All worksheets are created by the team of experienced teachers at Cazoom Maths.

RELATED TO Investigating Quadratic Graphs WORKSHEET

Frequently Asked Questions
Recognise, sketch and interpret graphs of quadratic functions.