Mean from a Frequency Table WORKSHEET
Suitable for Year groups: Year 8, Year 9
GCSE Tier: Foundation/Higher
Targeting grades: 4 - 5
Prerequisite knowledge: Constructing and interpreting ungrouped frequency tables. Finding the mean from data in lists.
Learning Objective: Describe, interpret and compare distributions using appropriate measures of central tendency and spread.
Mean from a Frequency Table WORKSHEET DESCRIPTION
This worksheet builds a clear progression in calculating the mean from a frequency table, moving from straightforward interpretation to deeper reasoning.
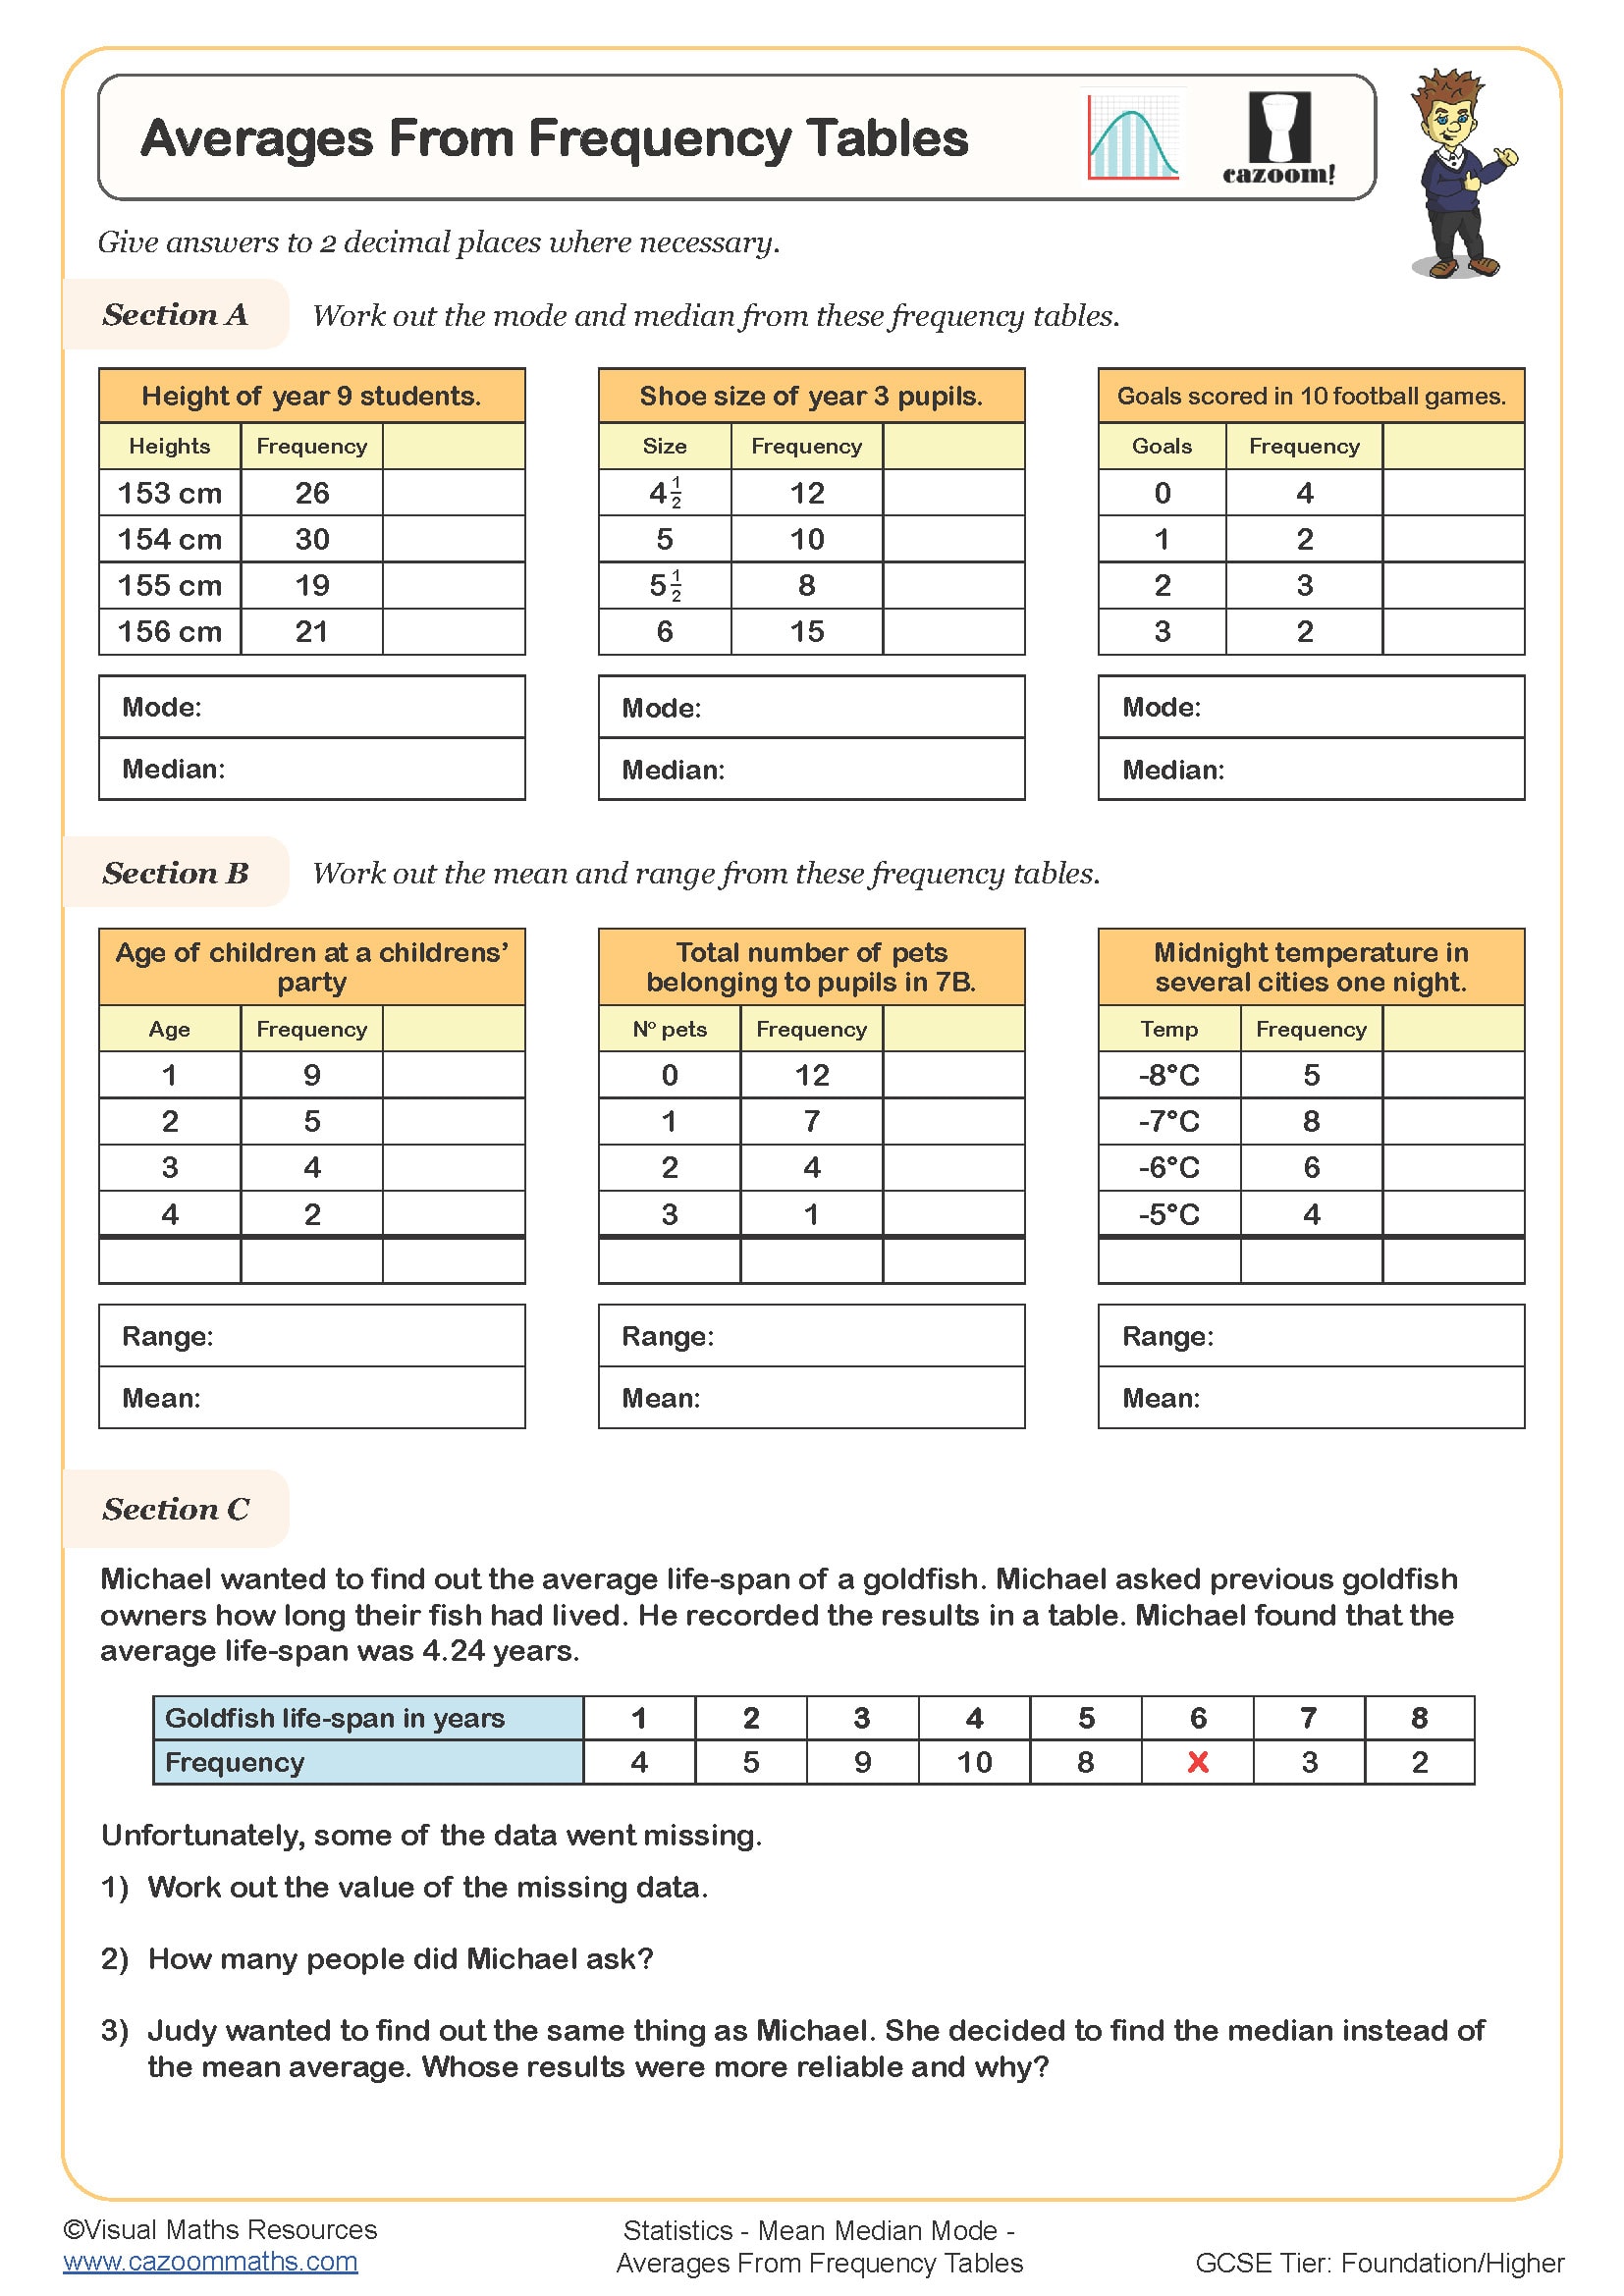
Section A asks students to read a completed table and answer simple interpretative questions, acting to reinforce prior knowledge.
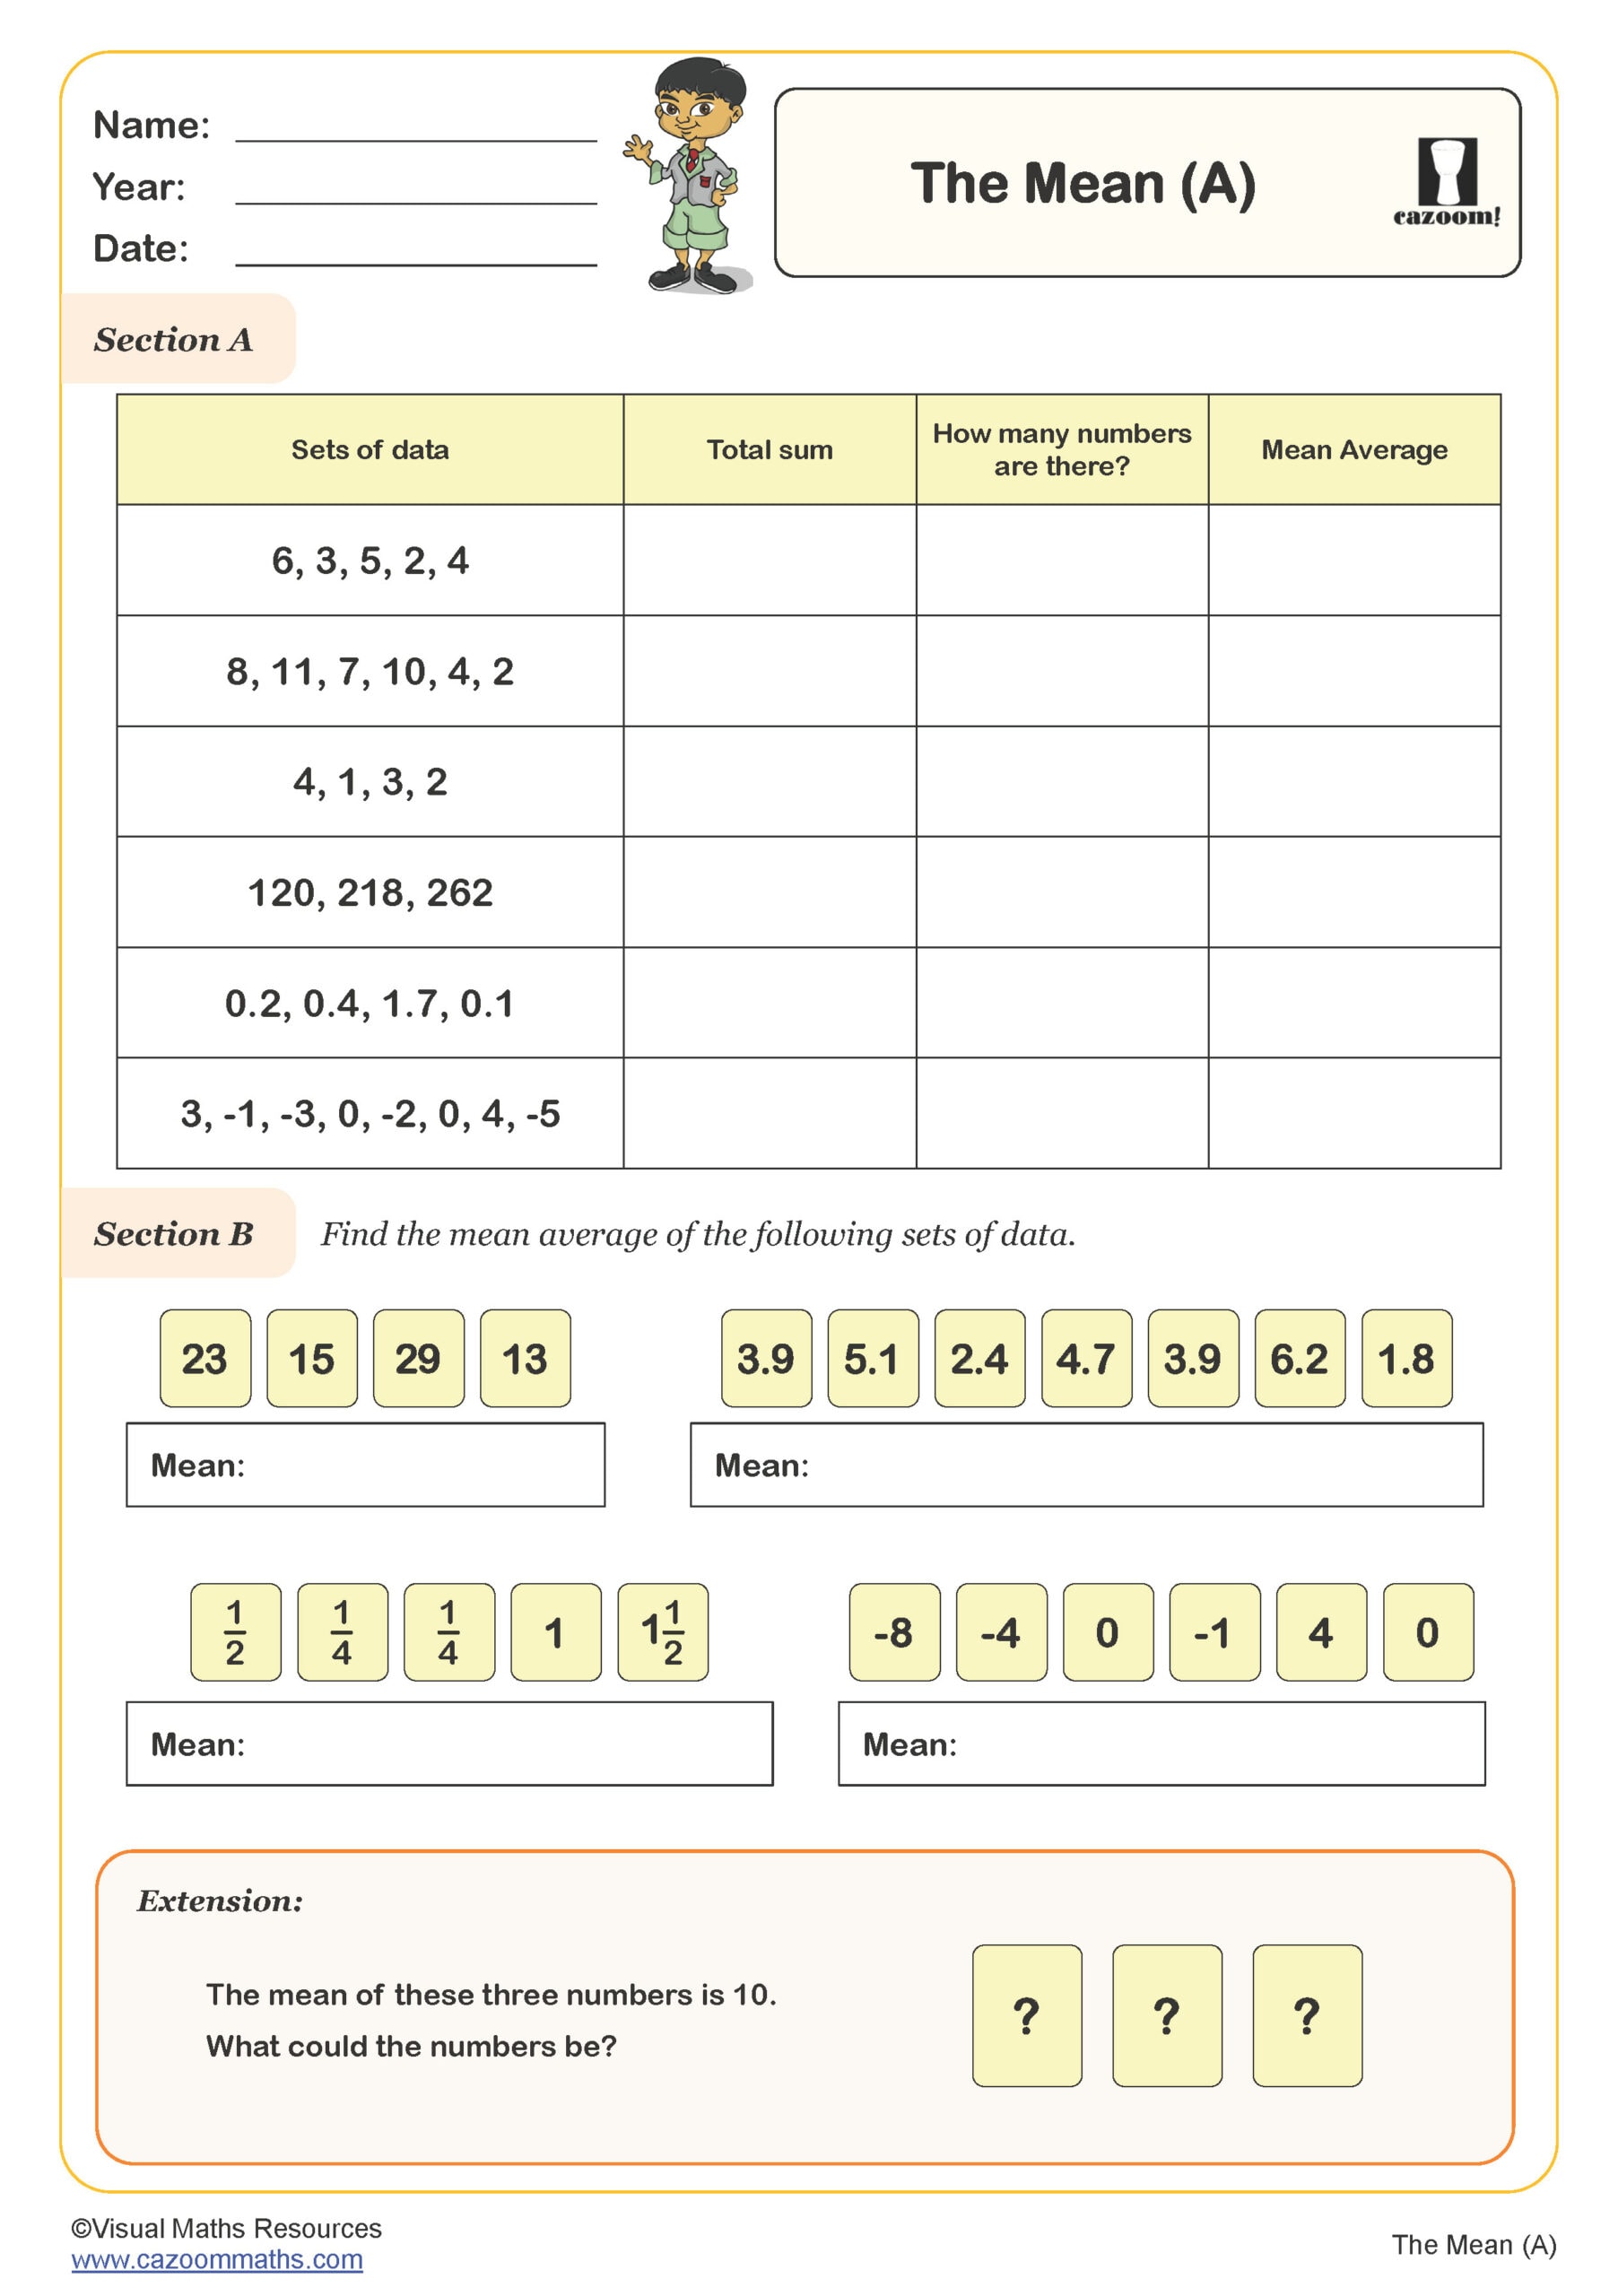
Section B introduces raw data (dice rolls) and requires students to construct their own frequency table before using it to find the total, sum of scores, and mean, strengthening procedural fluency.
Section C provides a series of real-world contexts—goals scored, books read, shoe sizes, and pets per family—where students must use the table structure to calculate totals and compute the mean across varied scenarios.
Section D shifts to higher-level reasoning: learners identify errors in a manager’s incorrect method, complete missing information in a partially filled table, and compare two classes’ quiz results using mean averages.
Section A asks students to read a completed table and answer simple interpretative questions, acting to reinforce prior knowledge.
Section B introduces raw data (dice rolls) and requires students to construct their own frequency table before using it to find the total, sum of scores, and mean, strengthening procedural fluency.
Section C provides a series of real-world contexts—goals scored, books read, shoe sizes, and pets per family—where students must use the table structure to calculate totals and compute the mean across varied scenarios.
Section D shifts to higher-level reasoning: learners identify errors in a manager’s incorrect method, complete missing information in a partially filled table, and compare two classes’ quiz results using mean averages.
All worksheets are created by the team of experienced teachers at Cazoom Maths.

RELATED TO Mean from a Frequency Table WORKSHEET
Frequently Asked Questions
Describe, interpret and compare distributions using appropriate measures of central tendency and spread.