Plotting Cubic Graphs WORKSHEET
Plotting Cubic Graphs WORKSHEET DESCRIPTION
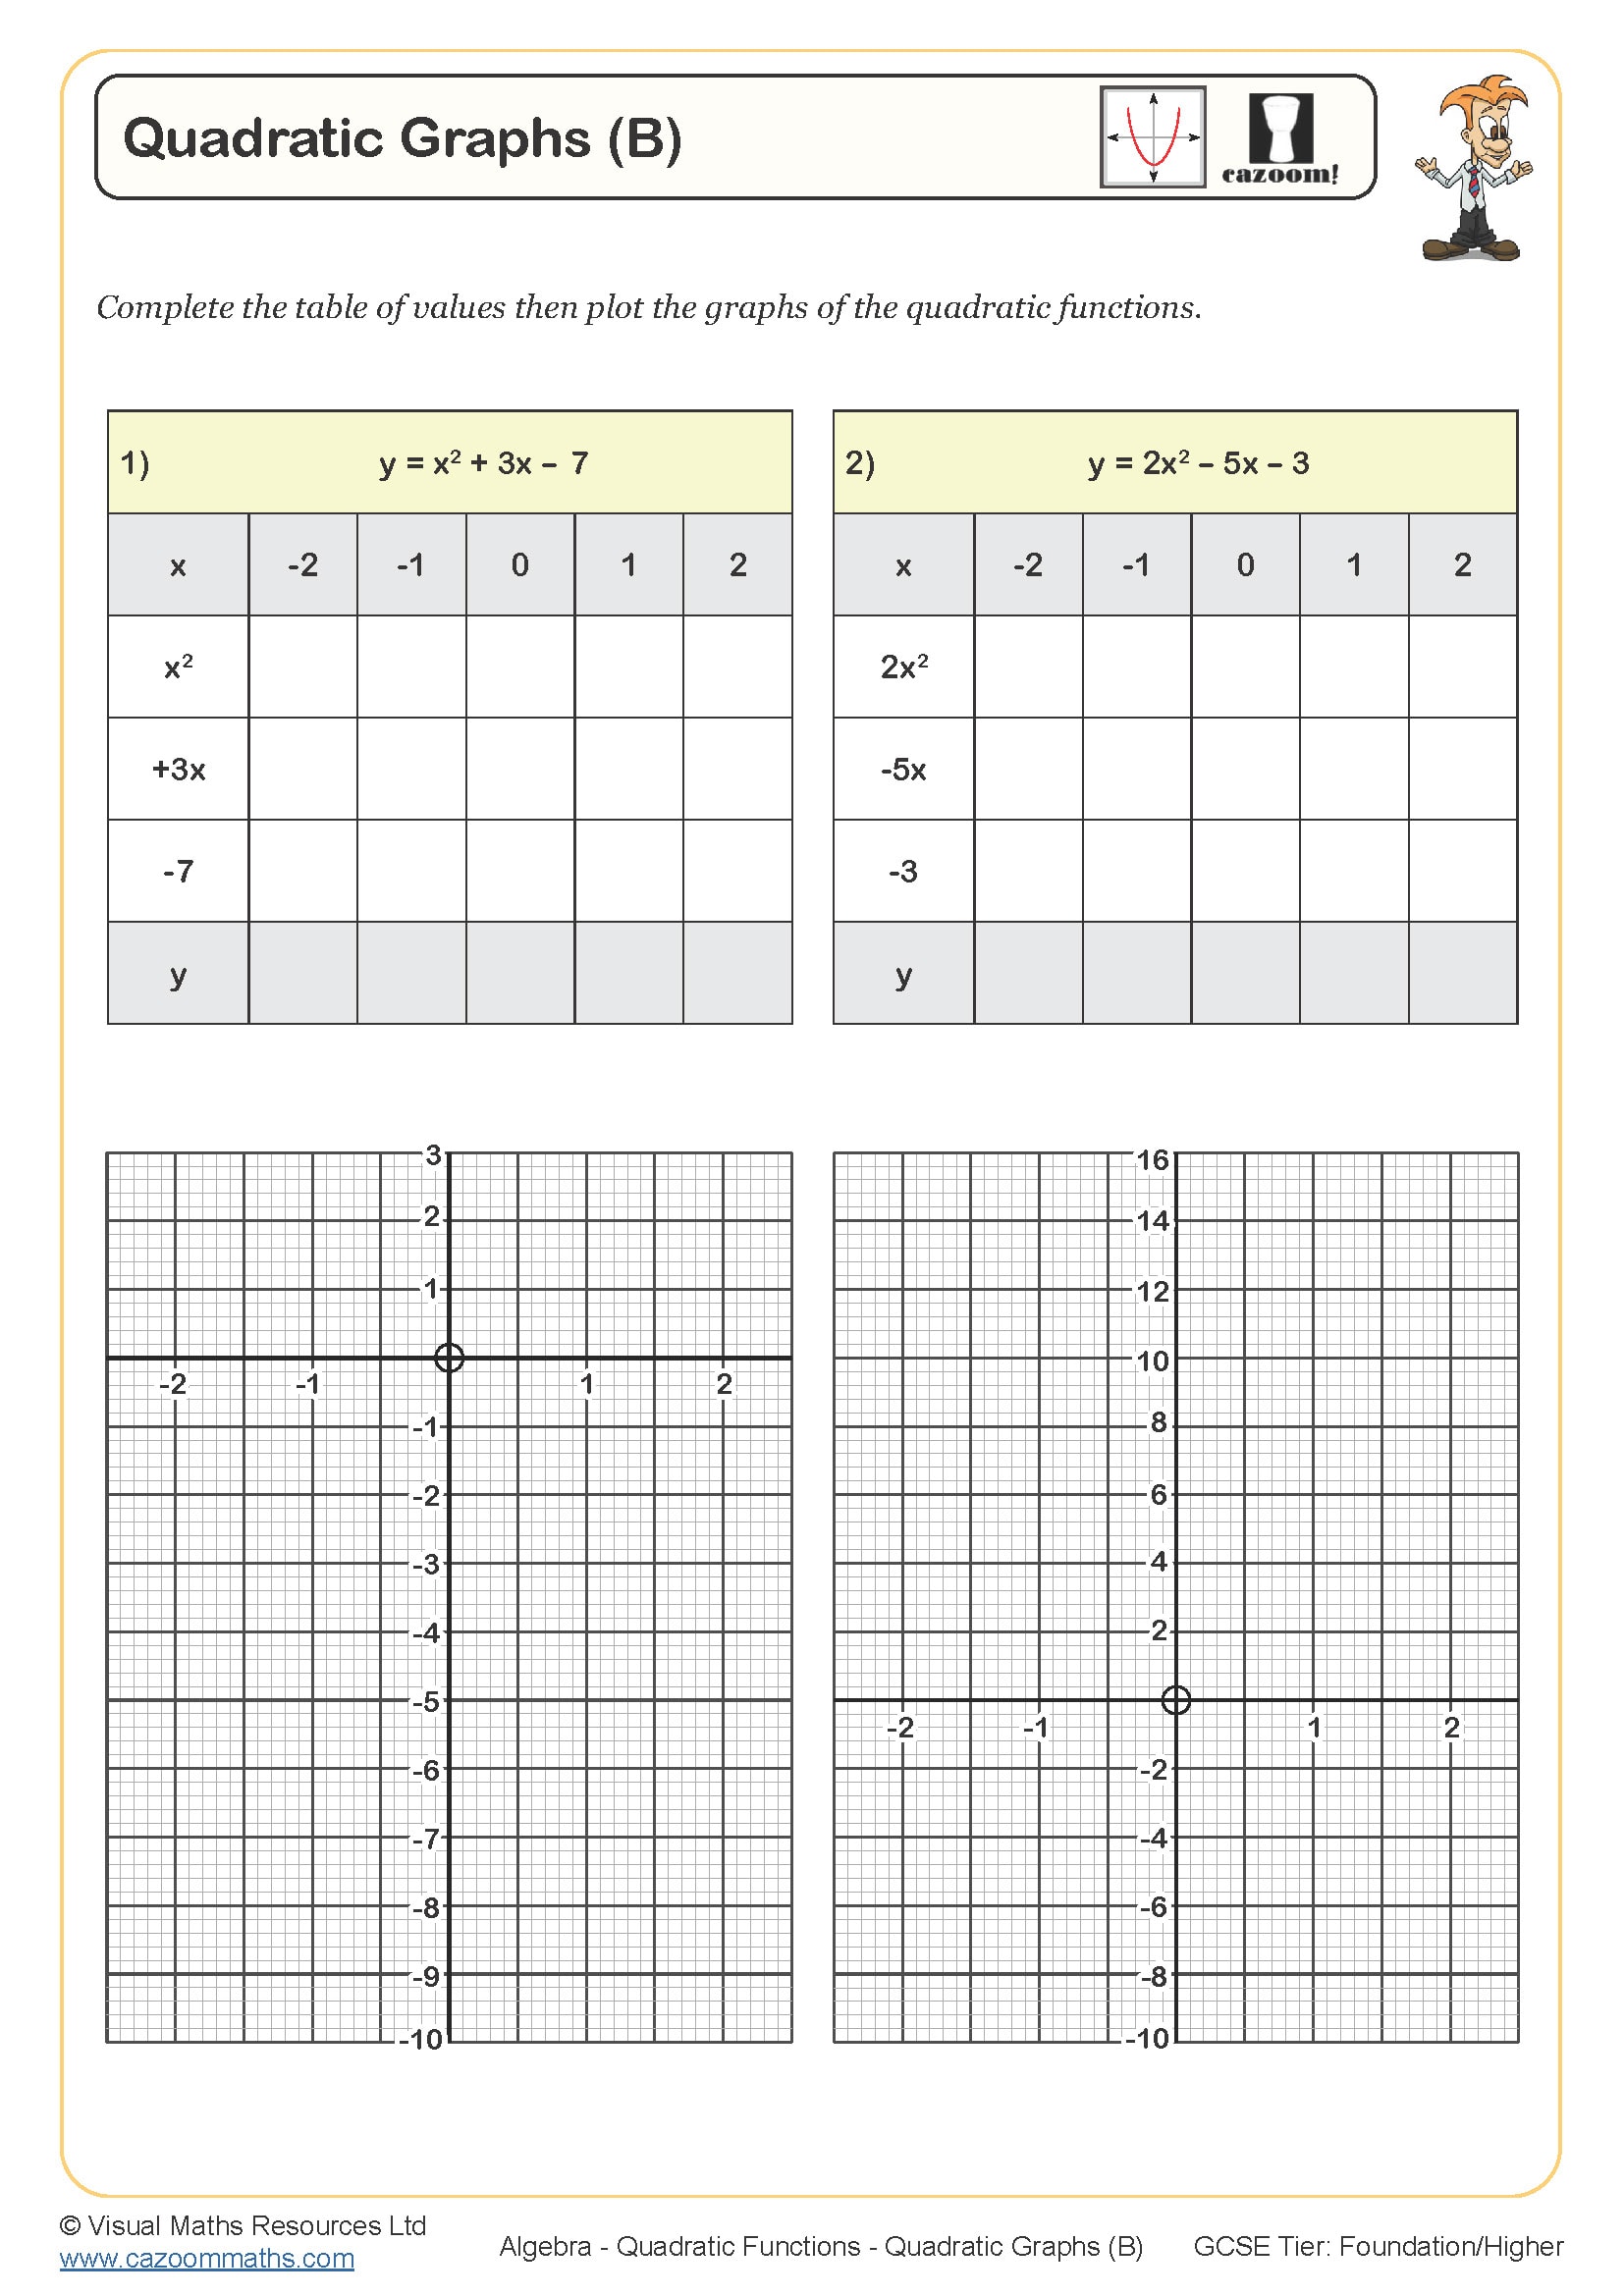
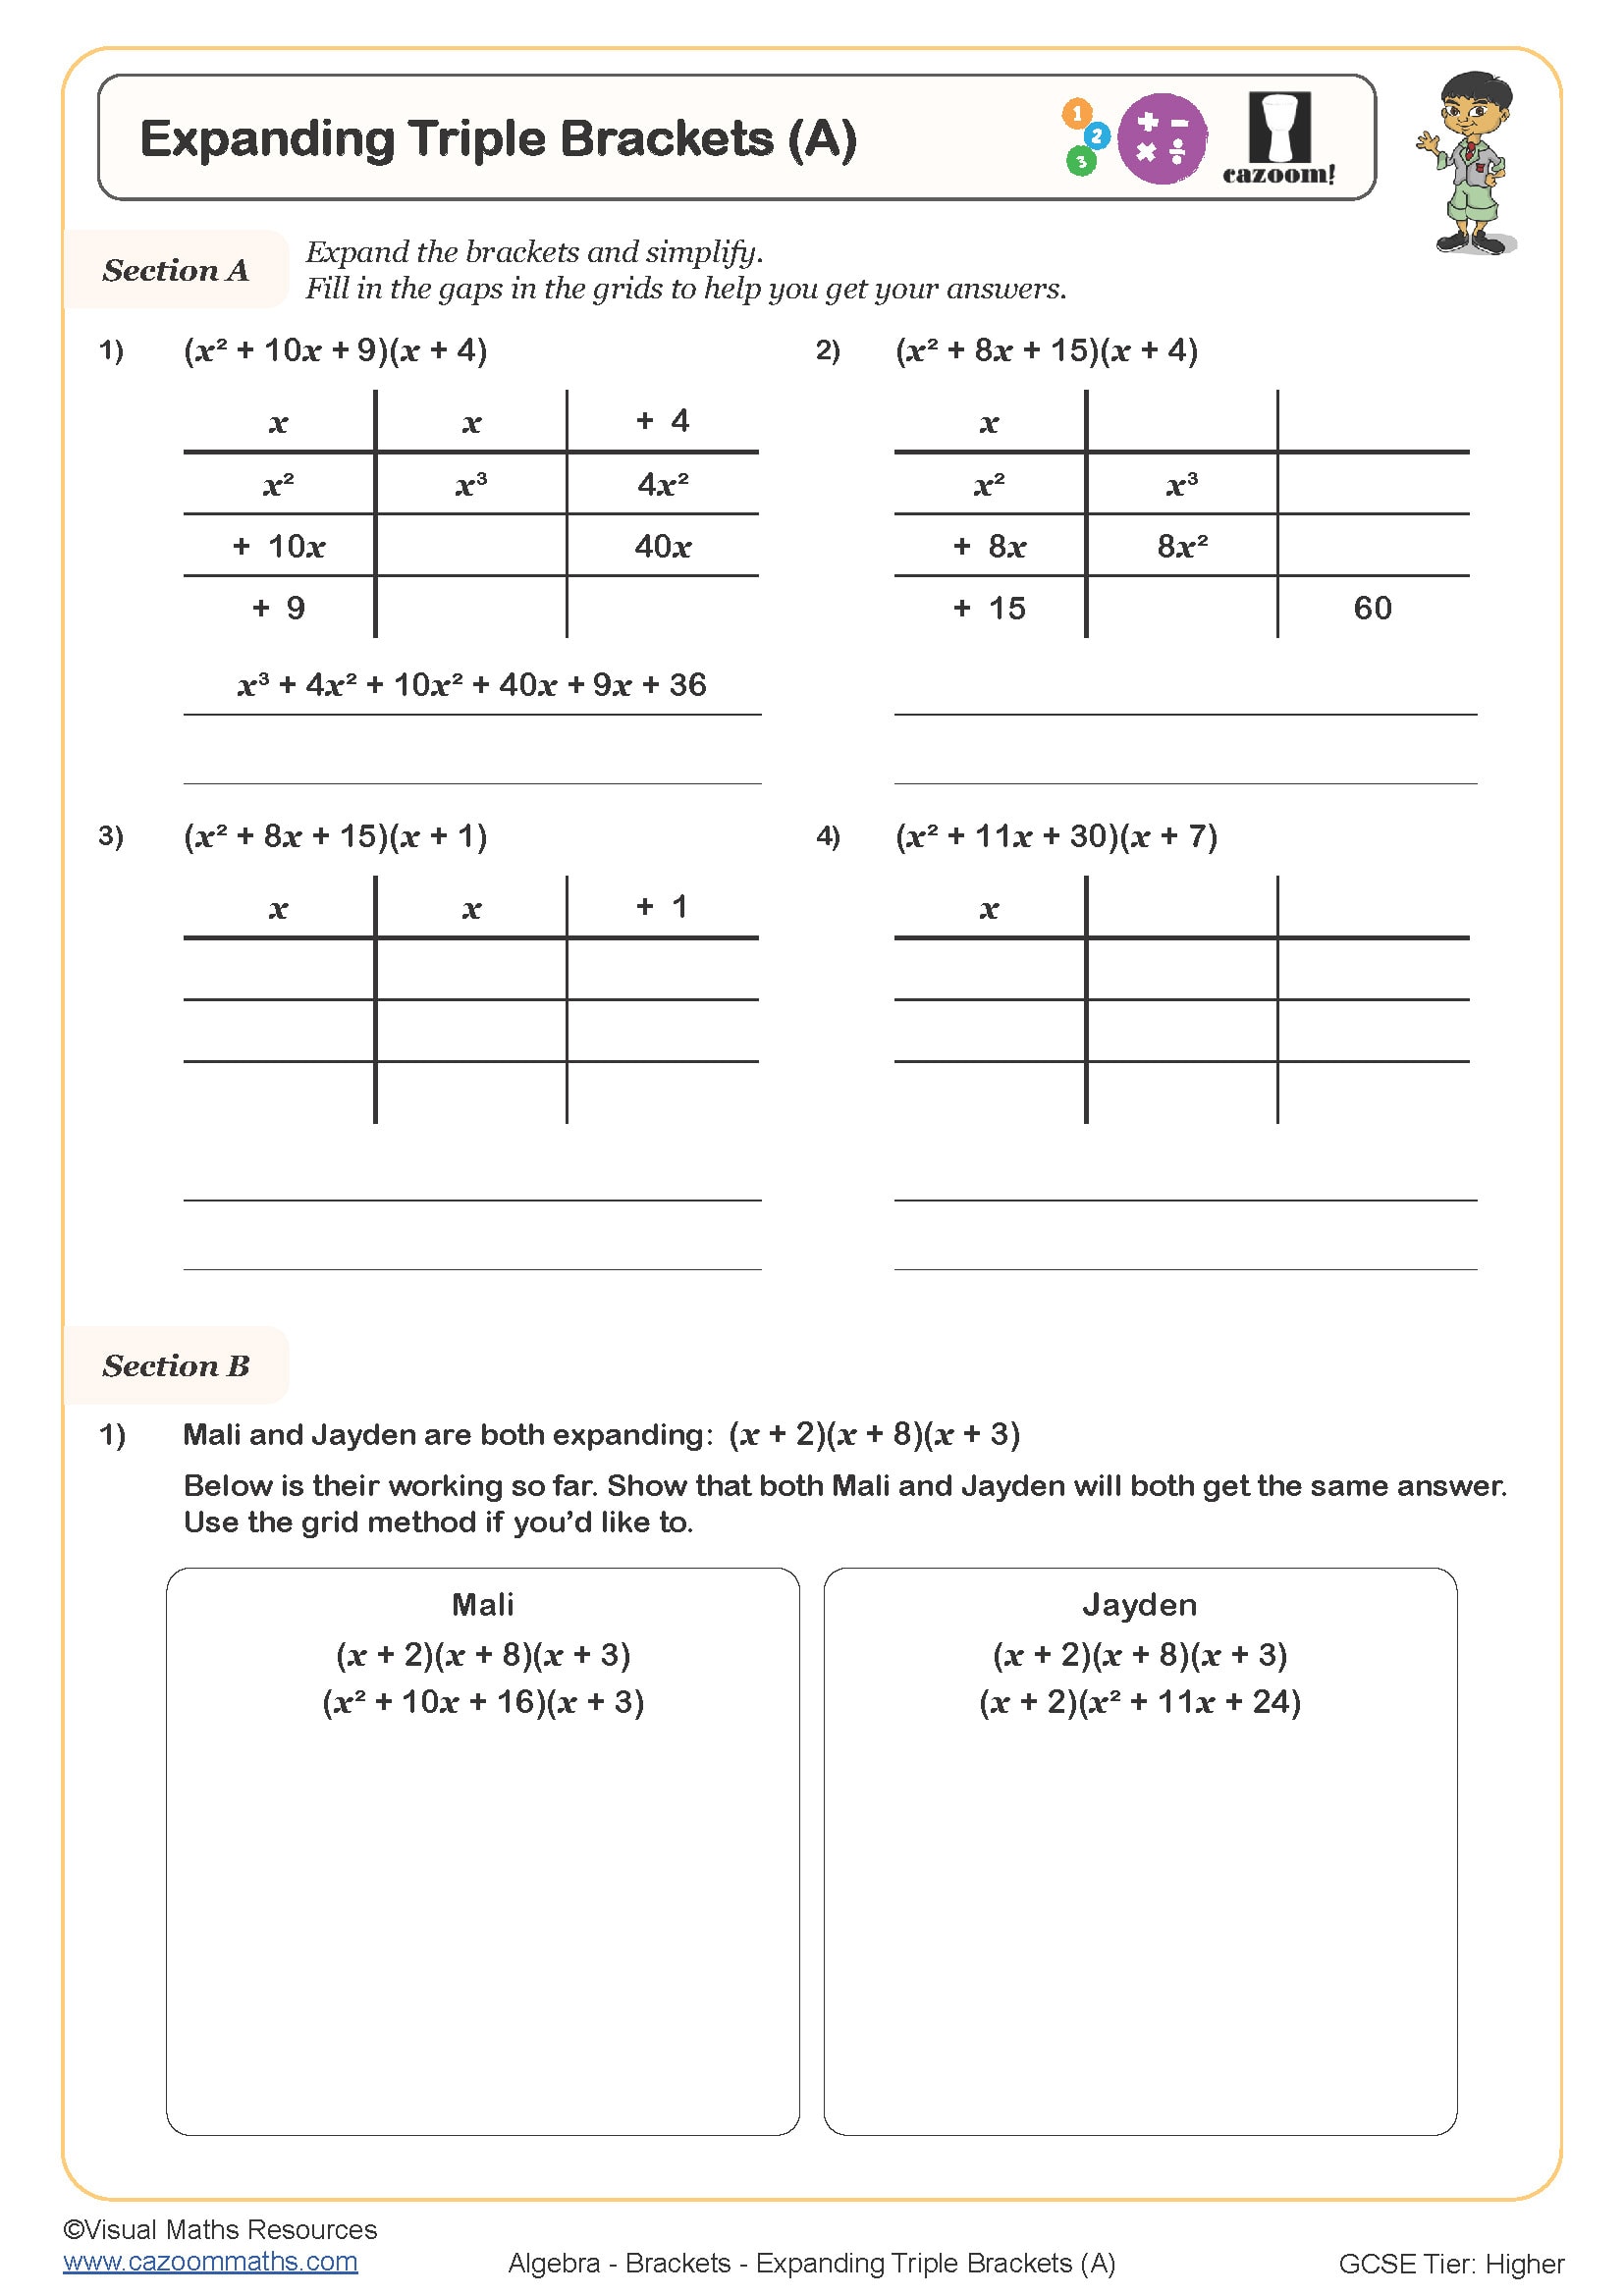
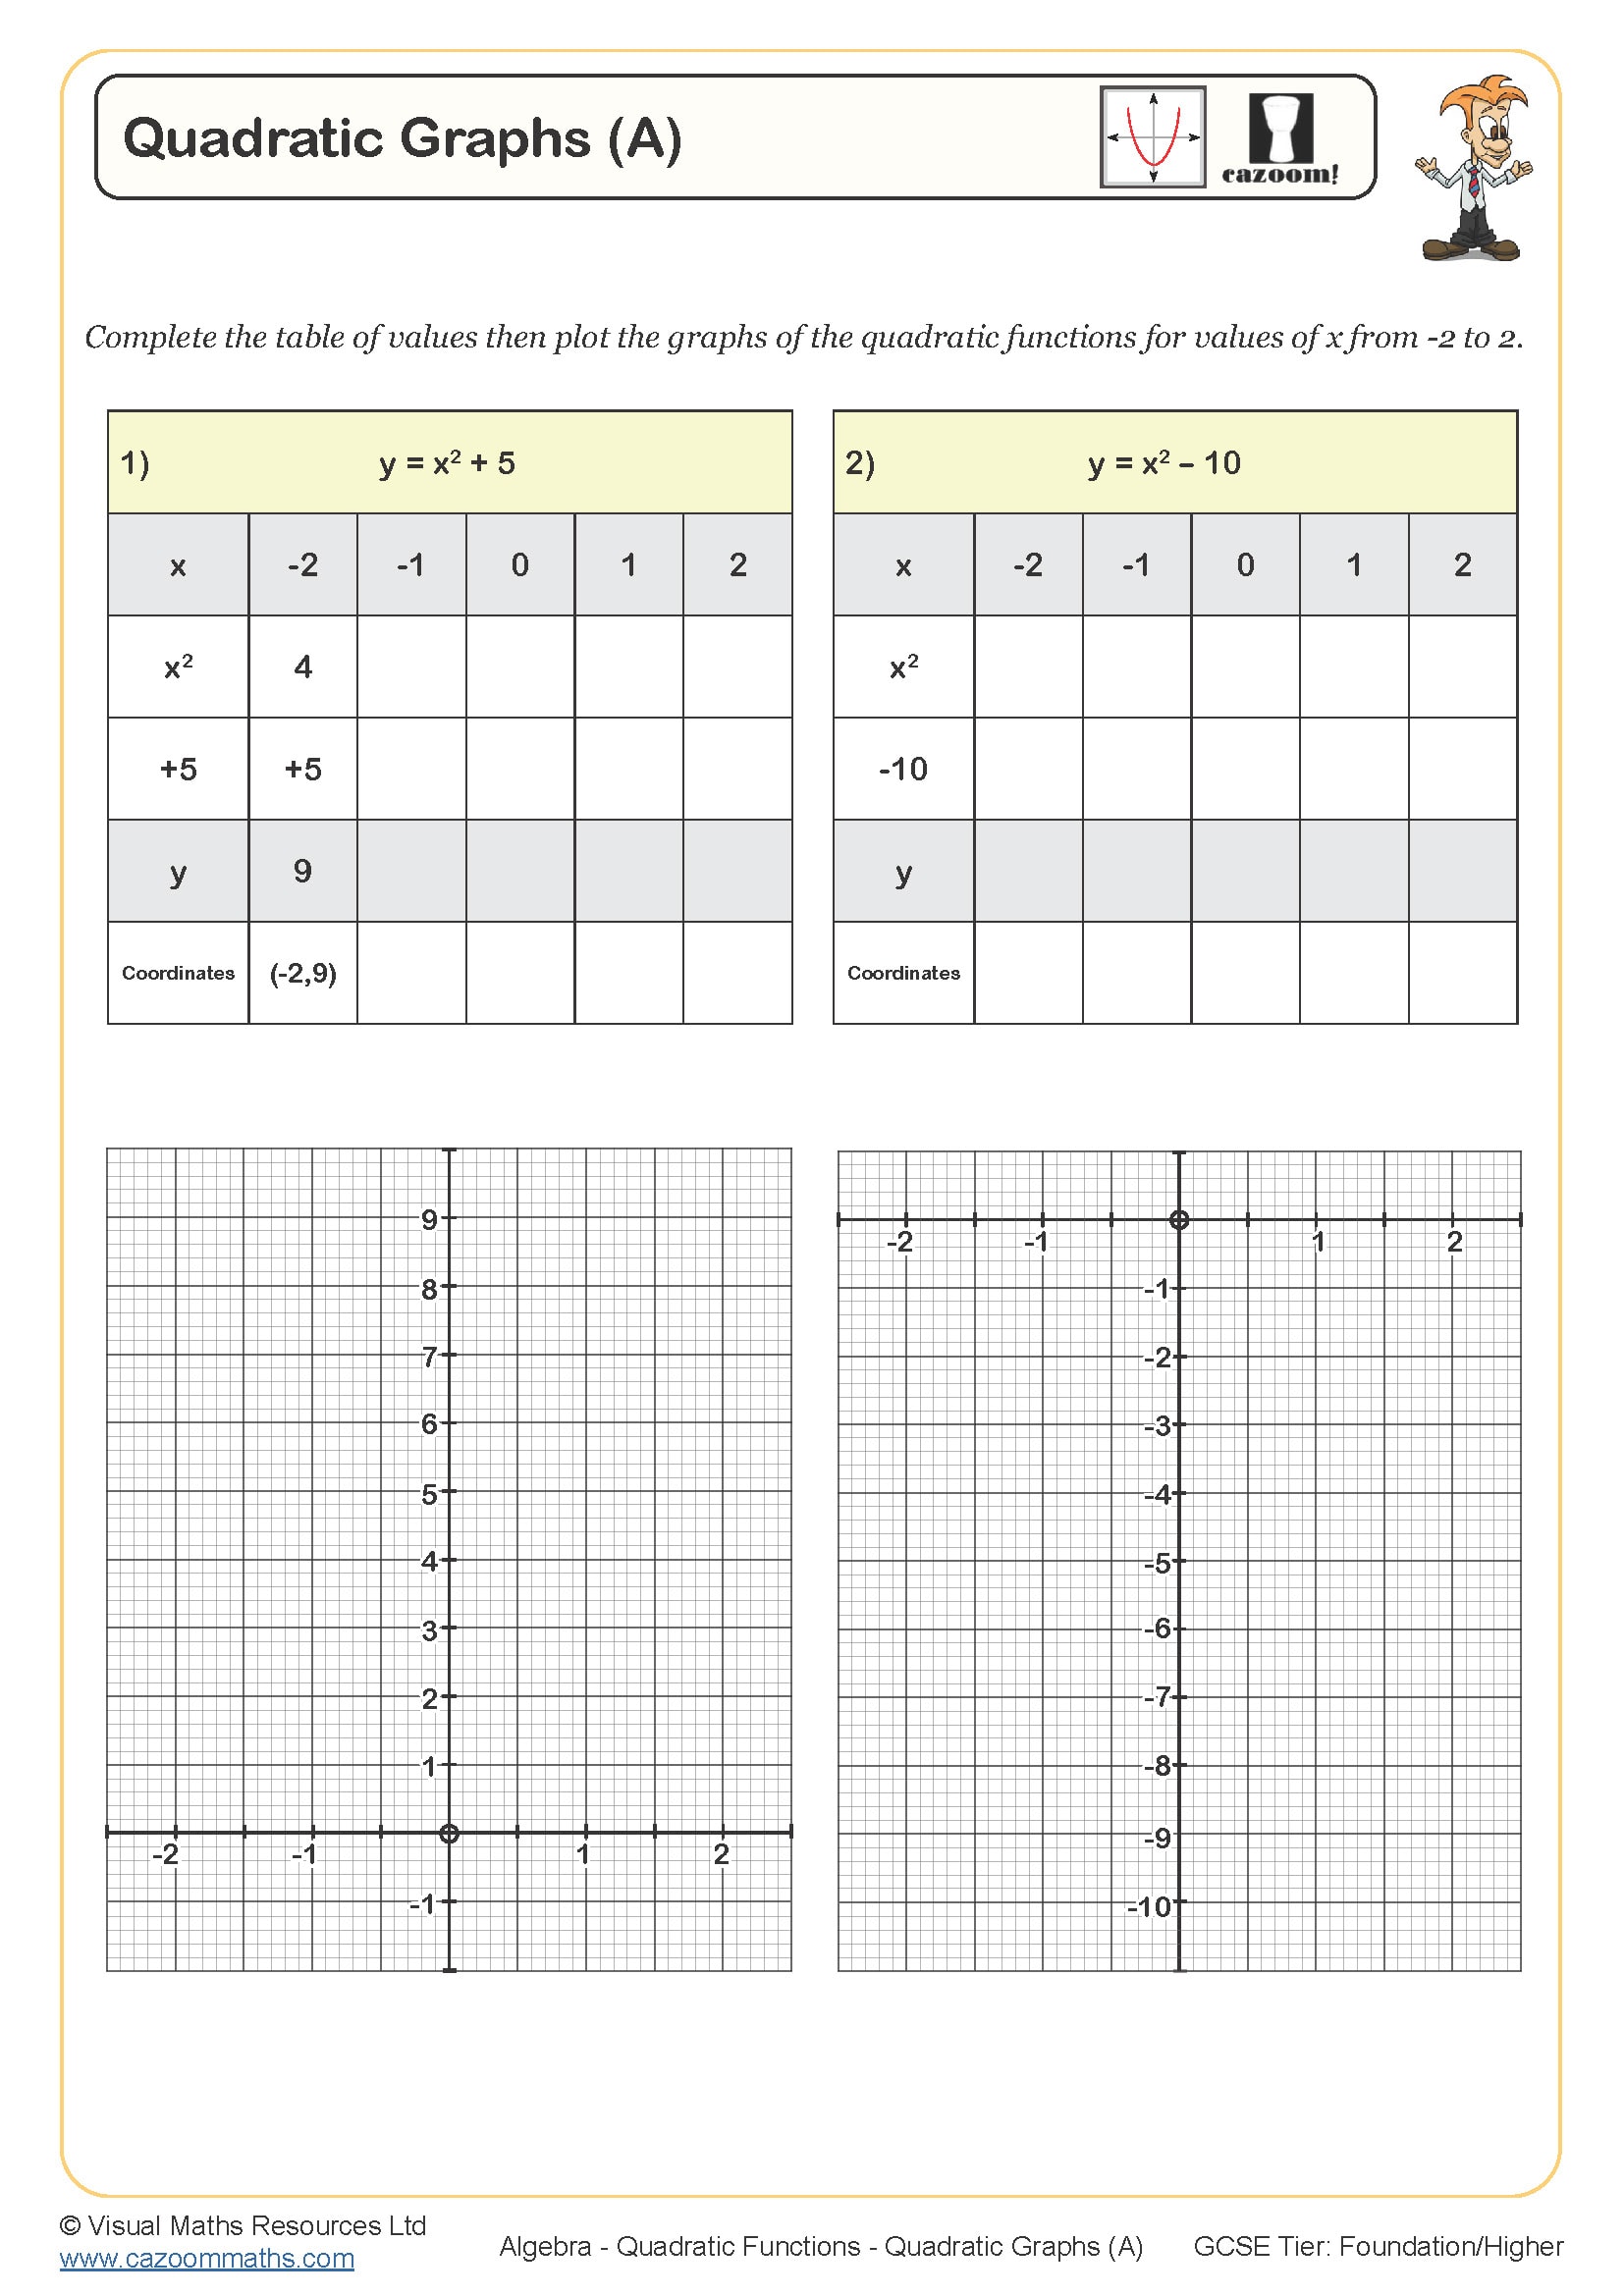
Plotting cubic graphs will see pupils using tables of values to generate coordinate pairs in order to plot cubic functions on a variety of differently scaled axes. The functions that learners will be plotting increase in difficulty as the worksheet progresses from y = x3 - 1 to y = x3 + 2x2 - 4 and there are six functions to plot in total. In each case, the x values range from -2 to 2 and the table of values is already constructed for pupils alongside a separate pair of axes.
We have included a section on the use of a calculator which will guide your pupils through getting the most from their scientific calculators and using them to generate tables of values.
All worksheets are created by the team of experienced teachers at Cazoom Maths.

RELATED TO Plotting Cubic Graphs WORKSHEET
Frequently Asked Questions
This worksheet is designed for Year 10 and Year 11 students who are working towards their GCSE mathematics qualification. It builds upon their existing knowledge of plotting linear and quadratic functions, extending their skills to work with more complex cubic relationships.