Plotting Cubic Graphs WORKSHEET
Suitable for Year groups: Year 10, Year 11
GCSE Tier: Foundation/Higher
Targeting grades: 4-5
Prerequisite knowledge: Using tables of values to plot linear and quadratic functions in four quadrants.
Plotting Cubic Graphs WORKSHEET DESCRIPTION
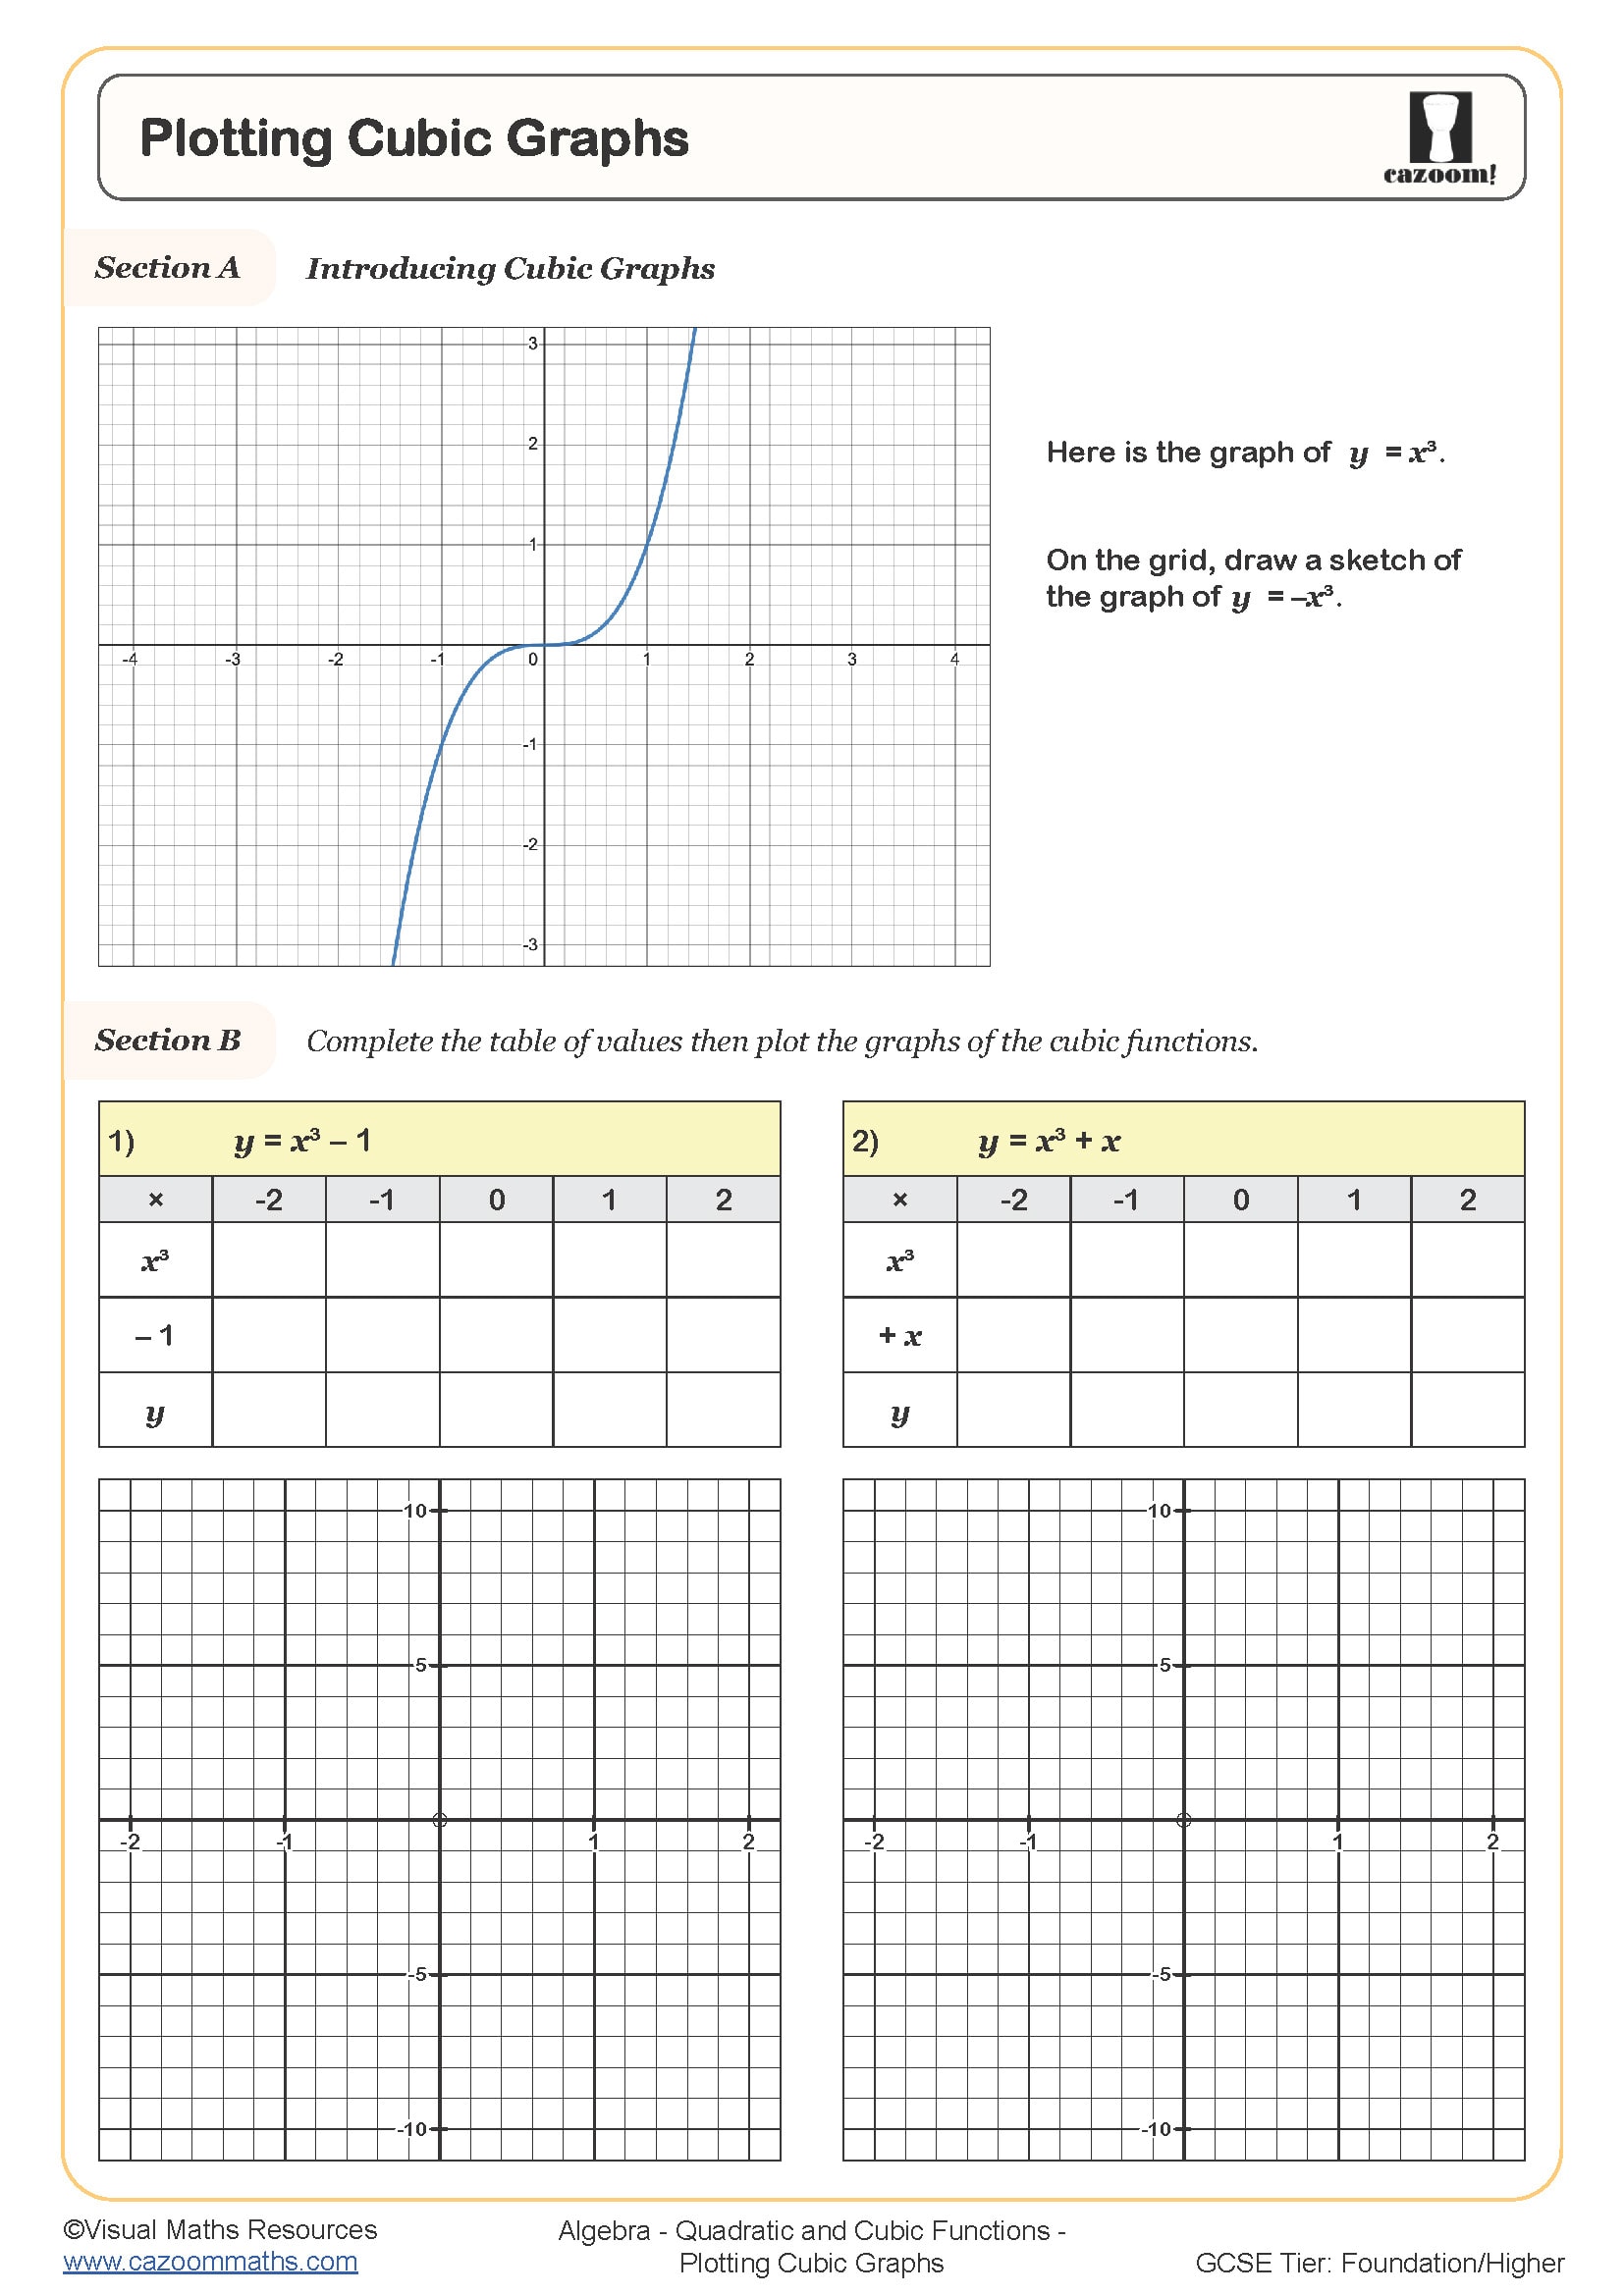
Plotting cubic graphs will see pupils using tables of values to generate coordinate pairs in order to plot cubic functions on a variety of differently scaled axes. The functions that learners will be plotting increase in difficulty as the worksheet progresses from y = x3 - 1 to y = x3 + 2x2 - 4 and there are six functions to plot in total. In each case, the x values range from -2 to 2 and the table of values is already constructed for pupils alongside a separate pair of axes.
We have included a section on the use of a calculator which will guide your pupils through getting the most from their scientific calculators and using them to generate tables of values.