Quadratic Equations and Graphs Match Up WORKSHEET
Quadratic Equations and Graphs Match Up WORKSHEET DESCRIPTION
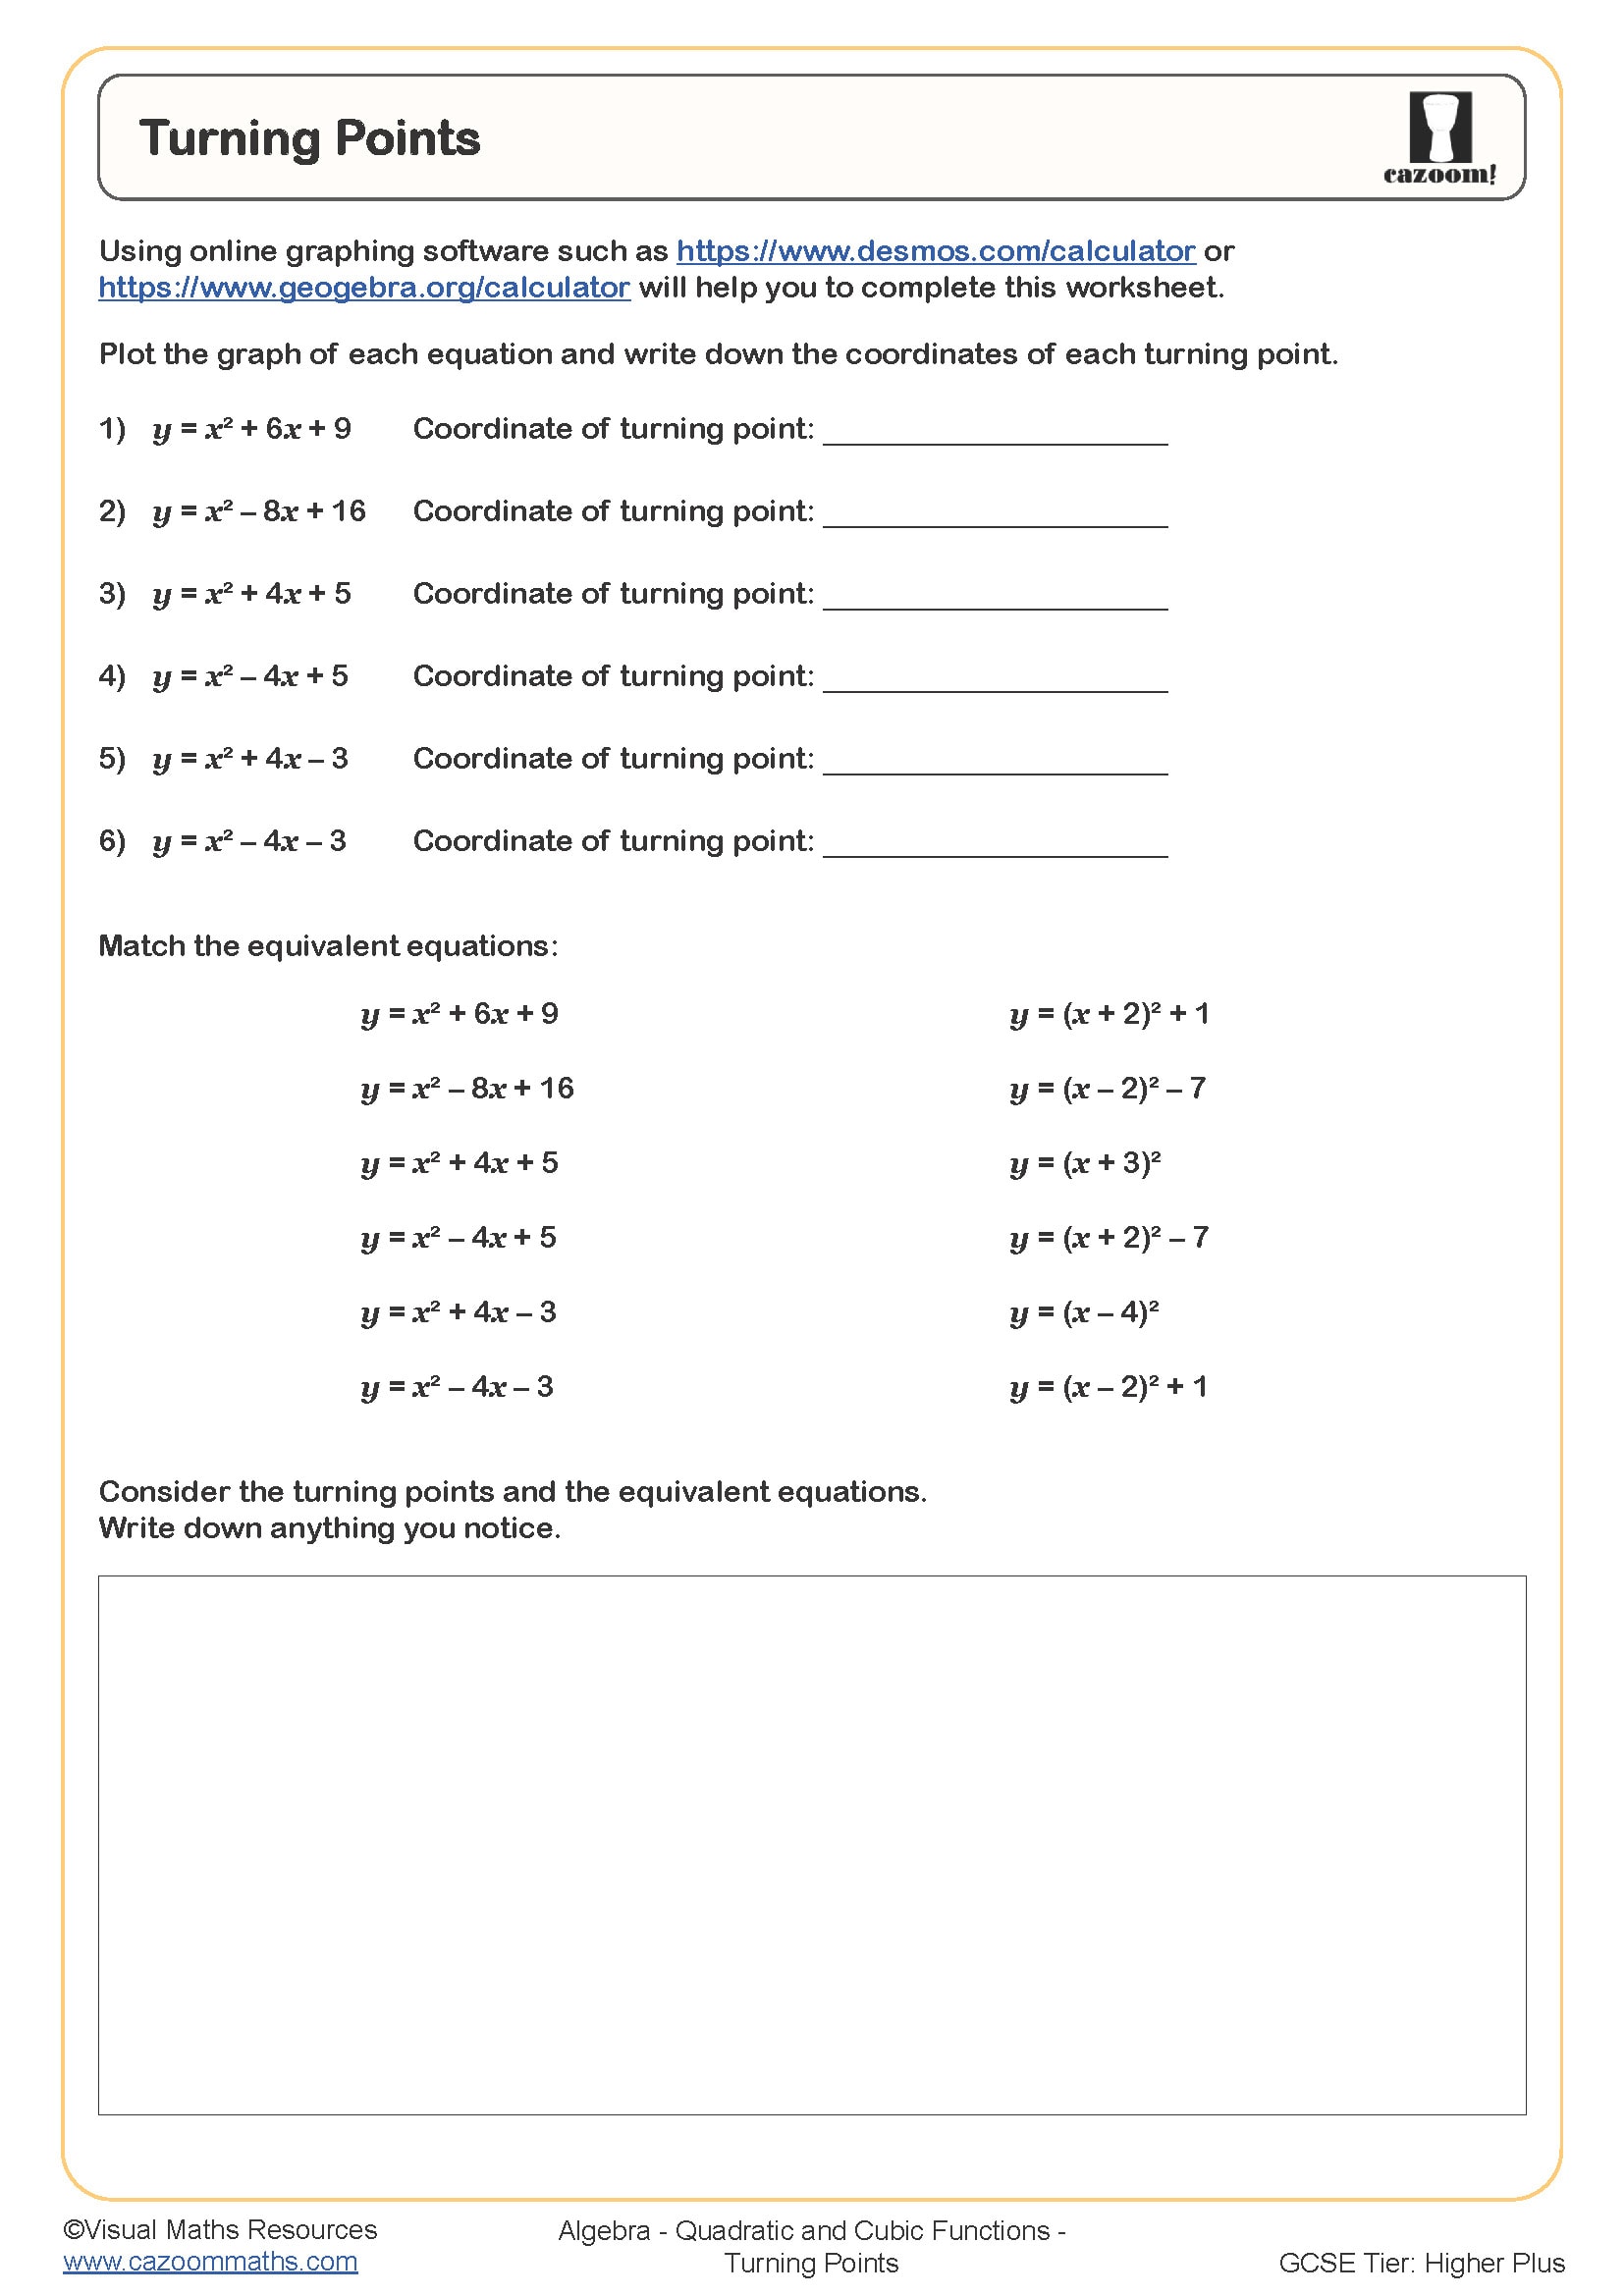
This engaging activity helps students connect quadratic equations to their graphical representations.
Learners are presented with equations in three different forms: the standard form y = ax2 + bx + c, the factorised form y = (ax + b)(cx + d), and the completed square form y = a(x + b)2 + c. Their task is to match the three forms of the equations to their correct graphs, encouraging them to recognise how coefficients and structure affect the shape, position, and orientation of a parabola. Each graph is presented with its roots and turning point (minimum or maximum) labelled, helping students connect key features to the equation form.
By working across multiple forms, students gain fluency in switching between algebraic and graphical perspectives, a key skill for deeper understanding of quadratics. The activity promotes careful comparison, visual reasoning, and reinforces the links between roots, turning points, and symmetry, making it a highly effective consolidation task.
All worksheets are created by the team of experienced teachers at Cazoom Maths.

RELATED TO Quadratic Equations and Graphs Match Up WORKSHEET
.jpg?w=3840)
-Worksheet.jpg?w=3840)
Frequently Asked Questions
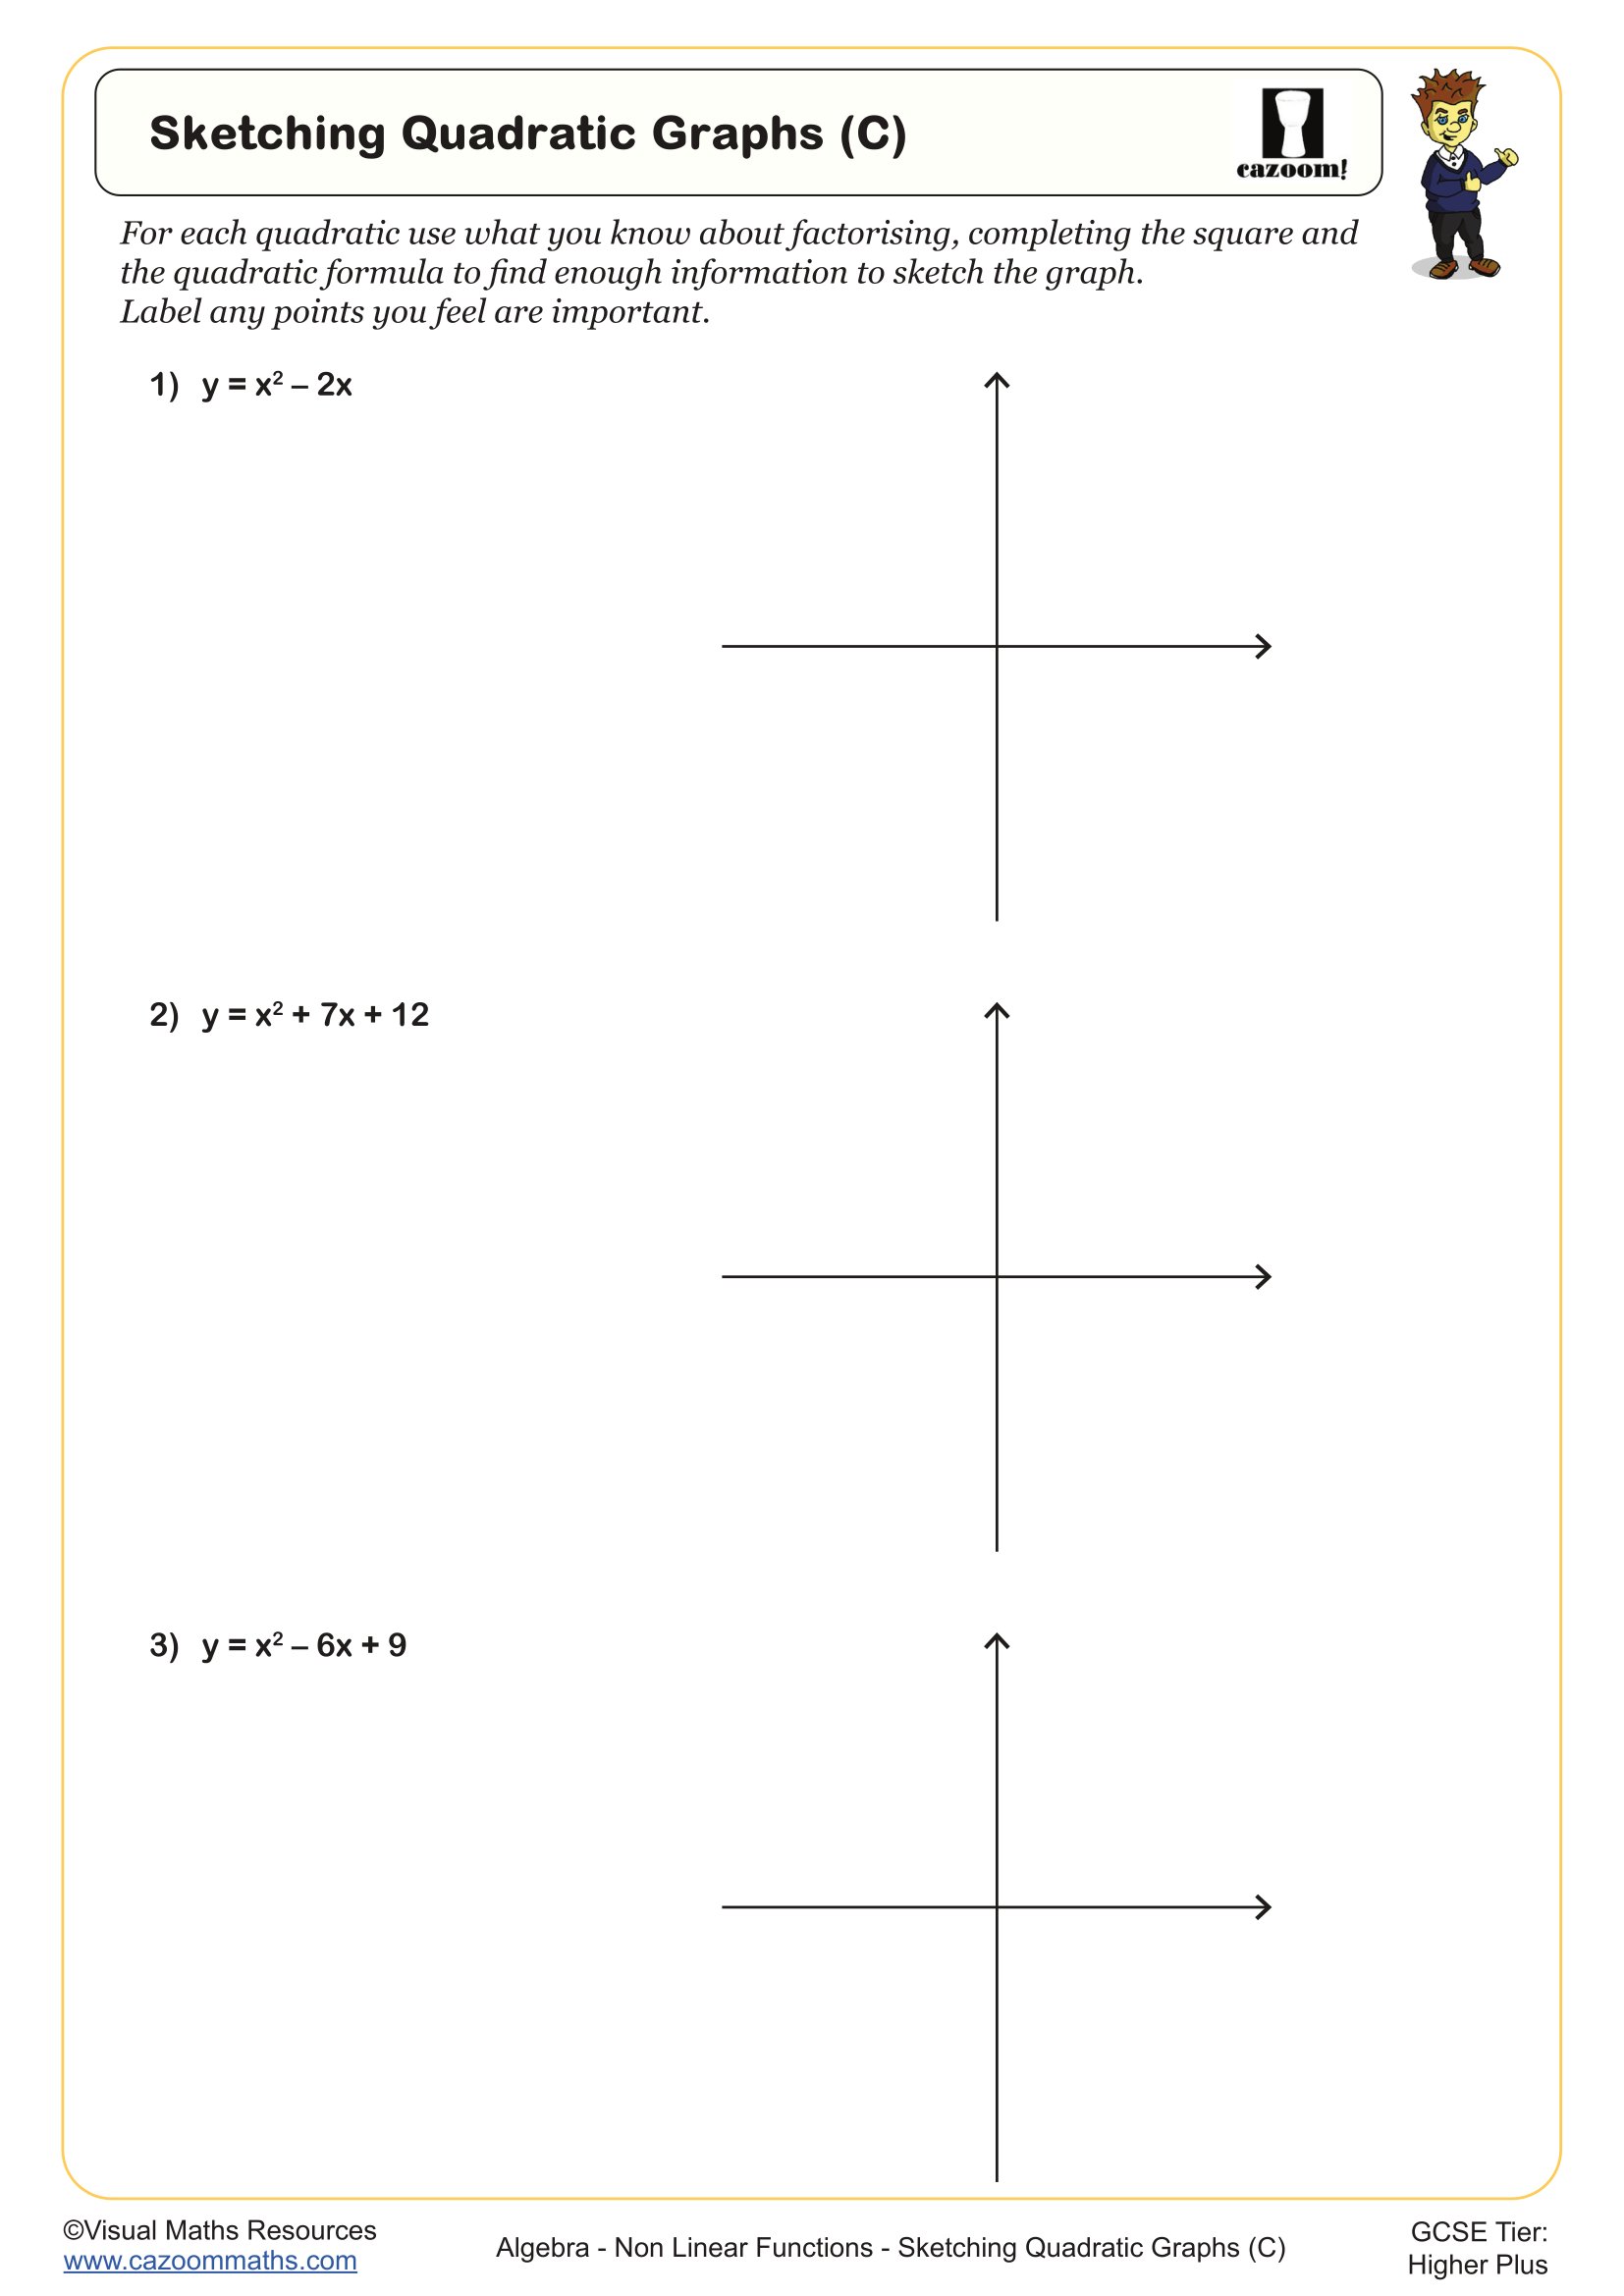
Students should be comfortable with factorising quadratics to find roots, as this skill is essential for understanding how the factorised form reveals where the parabola crosses the x-axis. They'll also need to understand completed square form and how it shows turning points, since recognising these features helps them match equations to their corresponding graphs successfully.