Quadratic Graphs (A) WORKSHEET
Suitable for Year groups: Year 10, Year 11
GCSE Tier: Foundation/Higher
Targeting grades: 4-5
Prerequisite knowledge: Using tables of values to plot linear functions. Substitution. Four operations with positive and negative integers.
Learning Objective: Plot and quadratic graphs
Quadratic Graphs (A) WORKSHEET DESCRIPTION
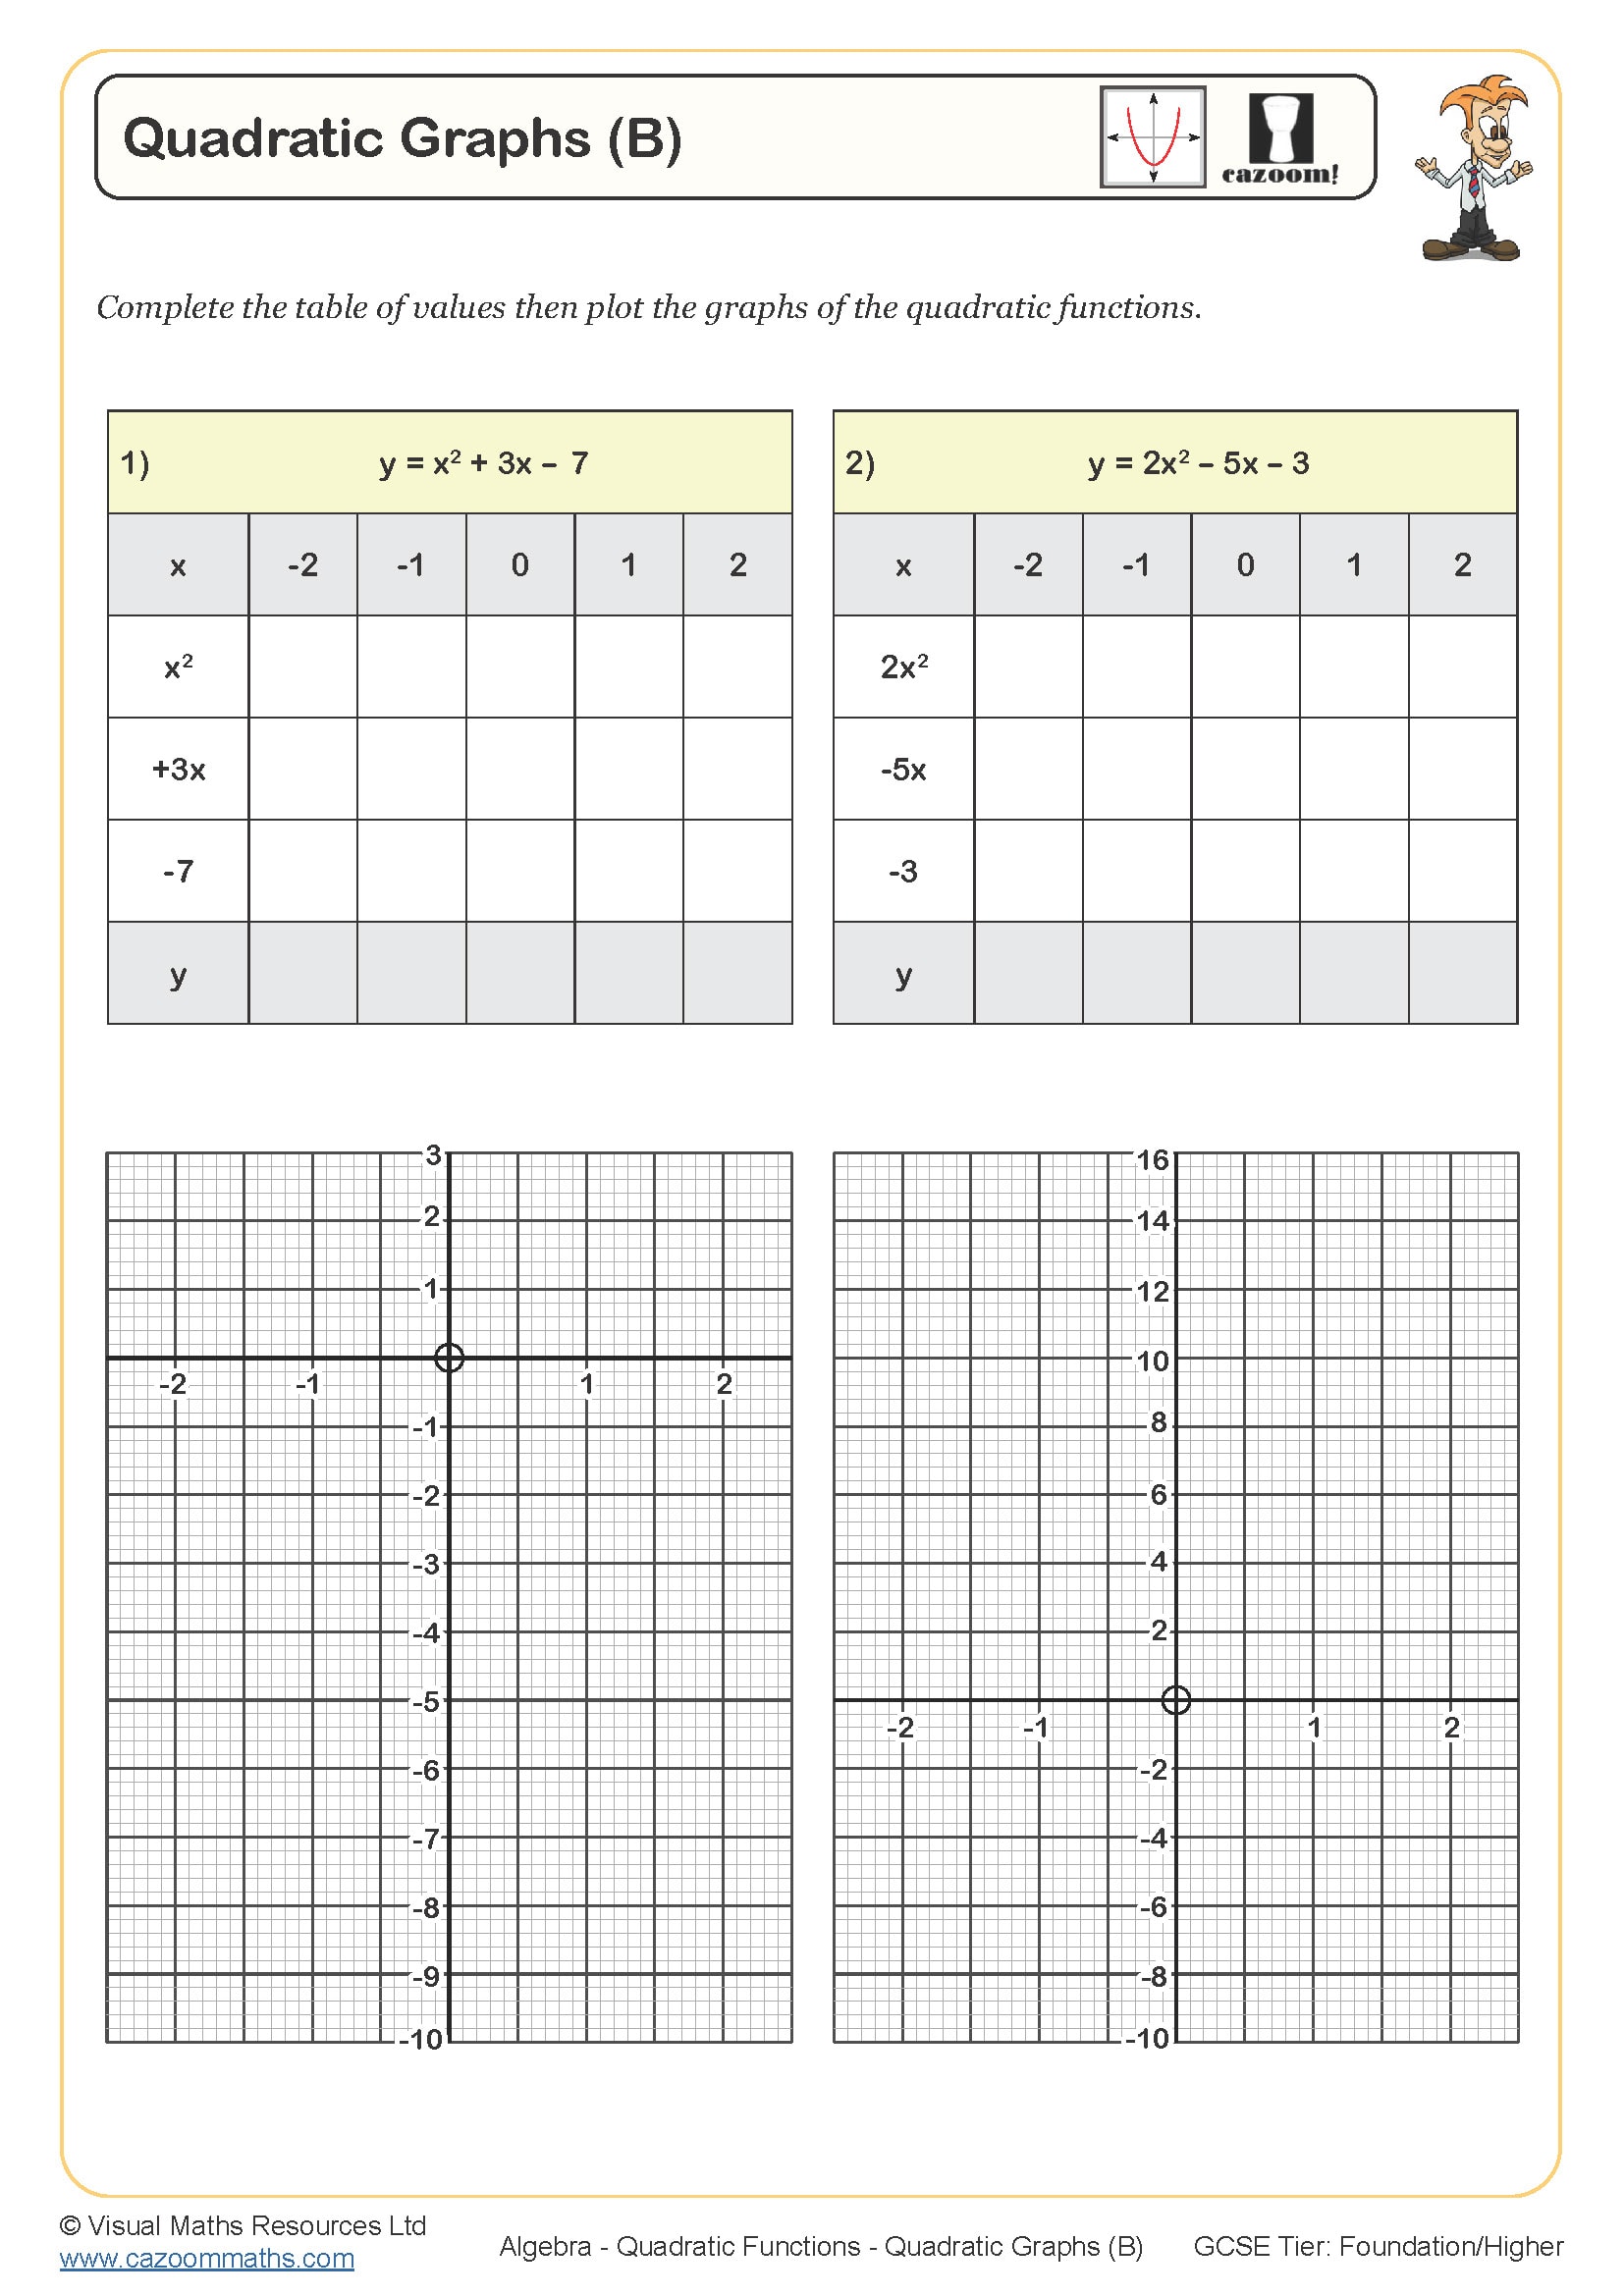
Students will use tables of values to generate coordinates and subsequently plot the graphs of 4 quadratic functions when working through this worksheet.
The quadratic functions to be plotted are: y = x² + 5, y = x² - 10, y= 2x² + 3 and y = 3x² - x. For each function, a table of values is provided and laid out to encourage learners to work out each part of the function separately before combining. The first two tables also have a row dedicated to writing the values of x and y as coordinate pairs. Each time the values of x to be used are from -2 to 2.
Graphs are all plotted on separate axes, which are also pre-drawn for students.
All worksheets are created by the team of experienced teachers at Cazoom Maths.
 Worksheet")
RELATED TO Quadratic Graphs (A) WORKSHEET
.jpg?w=3840)
Frequently Asked Questions
Plot and quadratic graphs