Quadratic Graphs (B) WORKSHEET
Quadratic Graphs (B) WORKSHEET DESCRIPTION
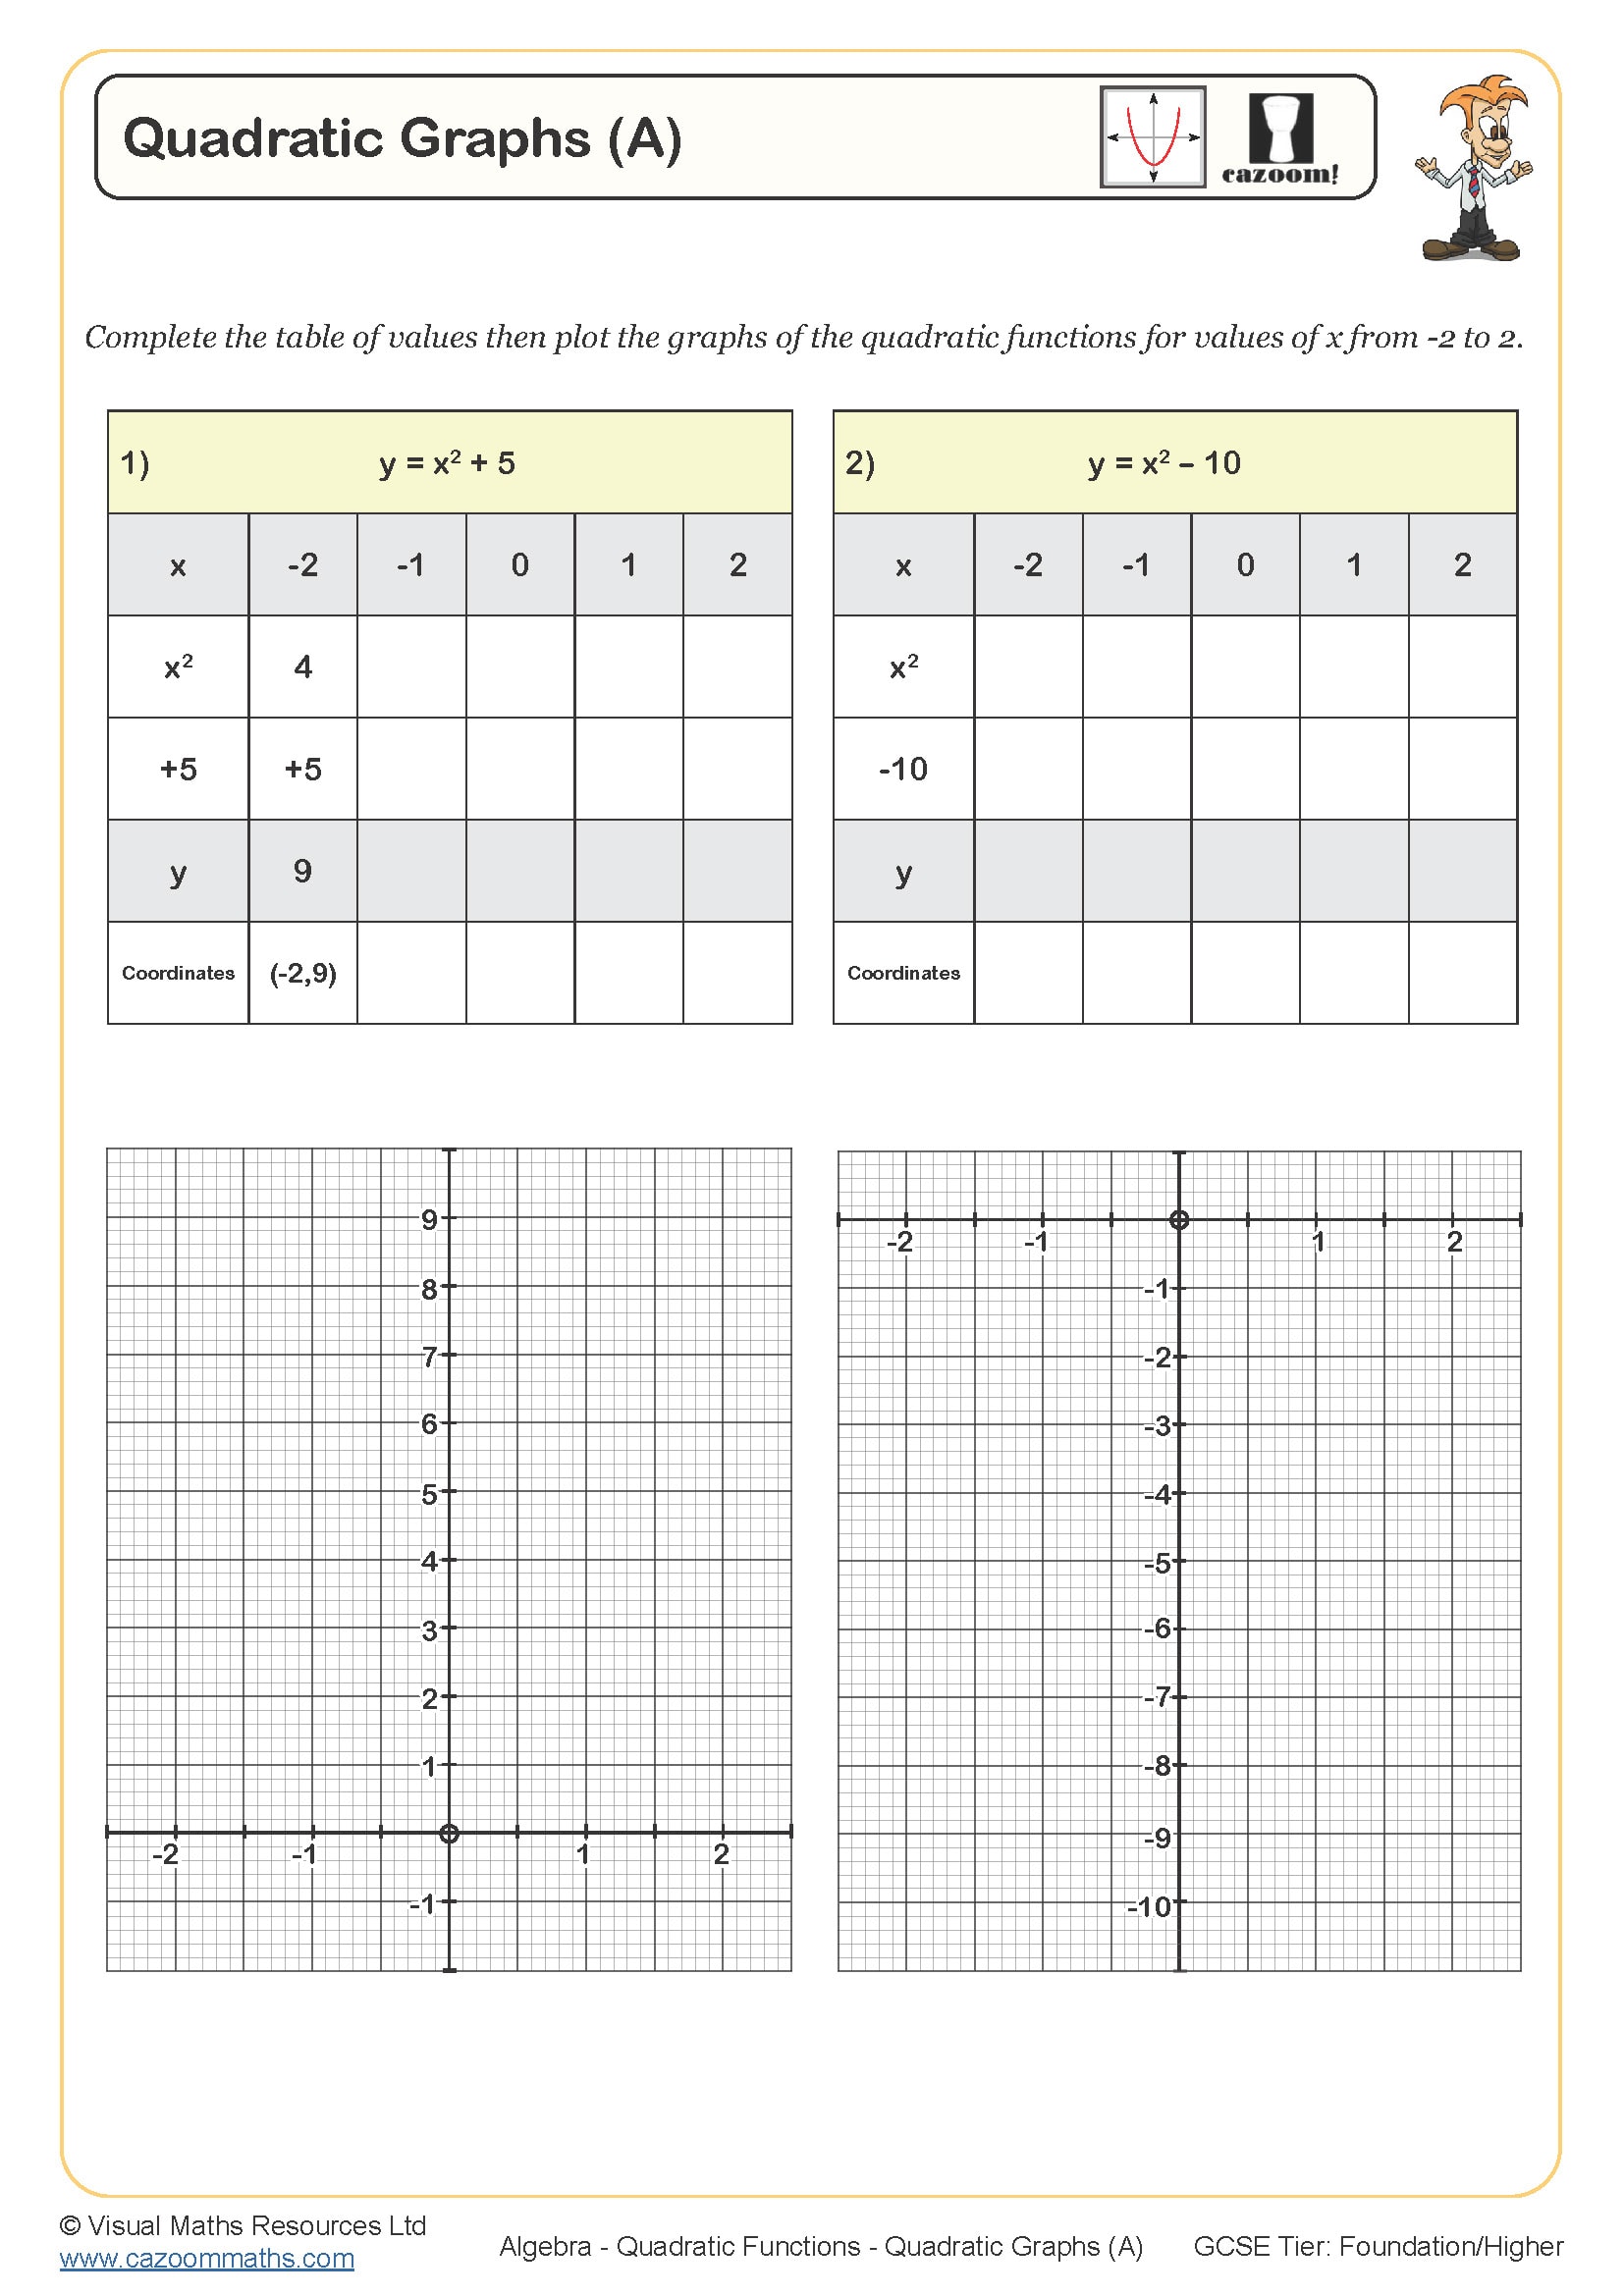
Students will use tables of values to generate coordinates and subsequently plot the graphs of 4 quadratic functions when working through this worksheet.
The quadratic functions have up to three terms and include a fractional and a negative coefficient of x squared. For each function, a table of values is provided and laid out to encourage learners to work out each part of the function separately before combining. Each time the values of x to be used are from -2 to 2.
Graphs are all plotted on separate axes, which are also pre-drawn for students. Ensure all quadratic curves are drawn using a sharp pencil.
All worksheets are created by the team of experienced teachers at Cazoom Maths.
 Worksheet")
RELATED TO Quadratic Graphs (B) WORKSHEET
.jpg?w=3840)
Frequently Asked Questions
Students should be comfortable using tables of values to plot linear functions, as this worksheet extends that skill to quadratic curves. They'll also need solid foundations in substitution and working with four operations involving positive and negative integers, since they'll be calculating coordinate values by substituting into algebraic expressions.