Stem and Leaf Diagrams (B) WORKSHEET
Stem and Leaf Diagrams (B) WORKSHEET DESCRIPTION
Use this worksheet after Stem and Leaf Diagrams (A) to provide more practice in the skill.
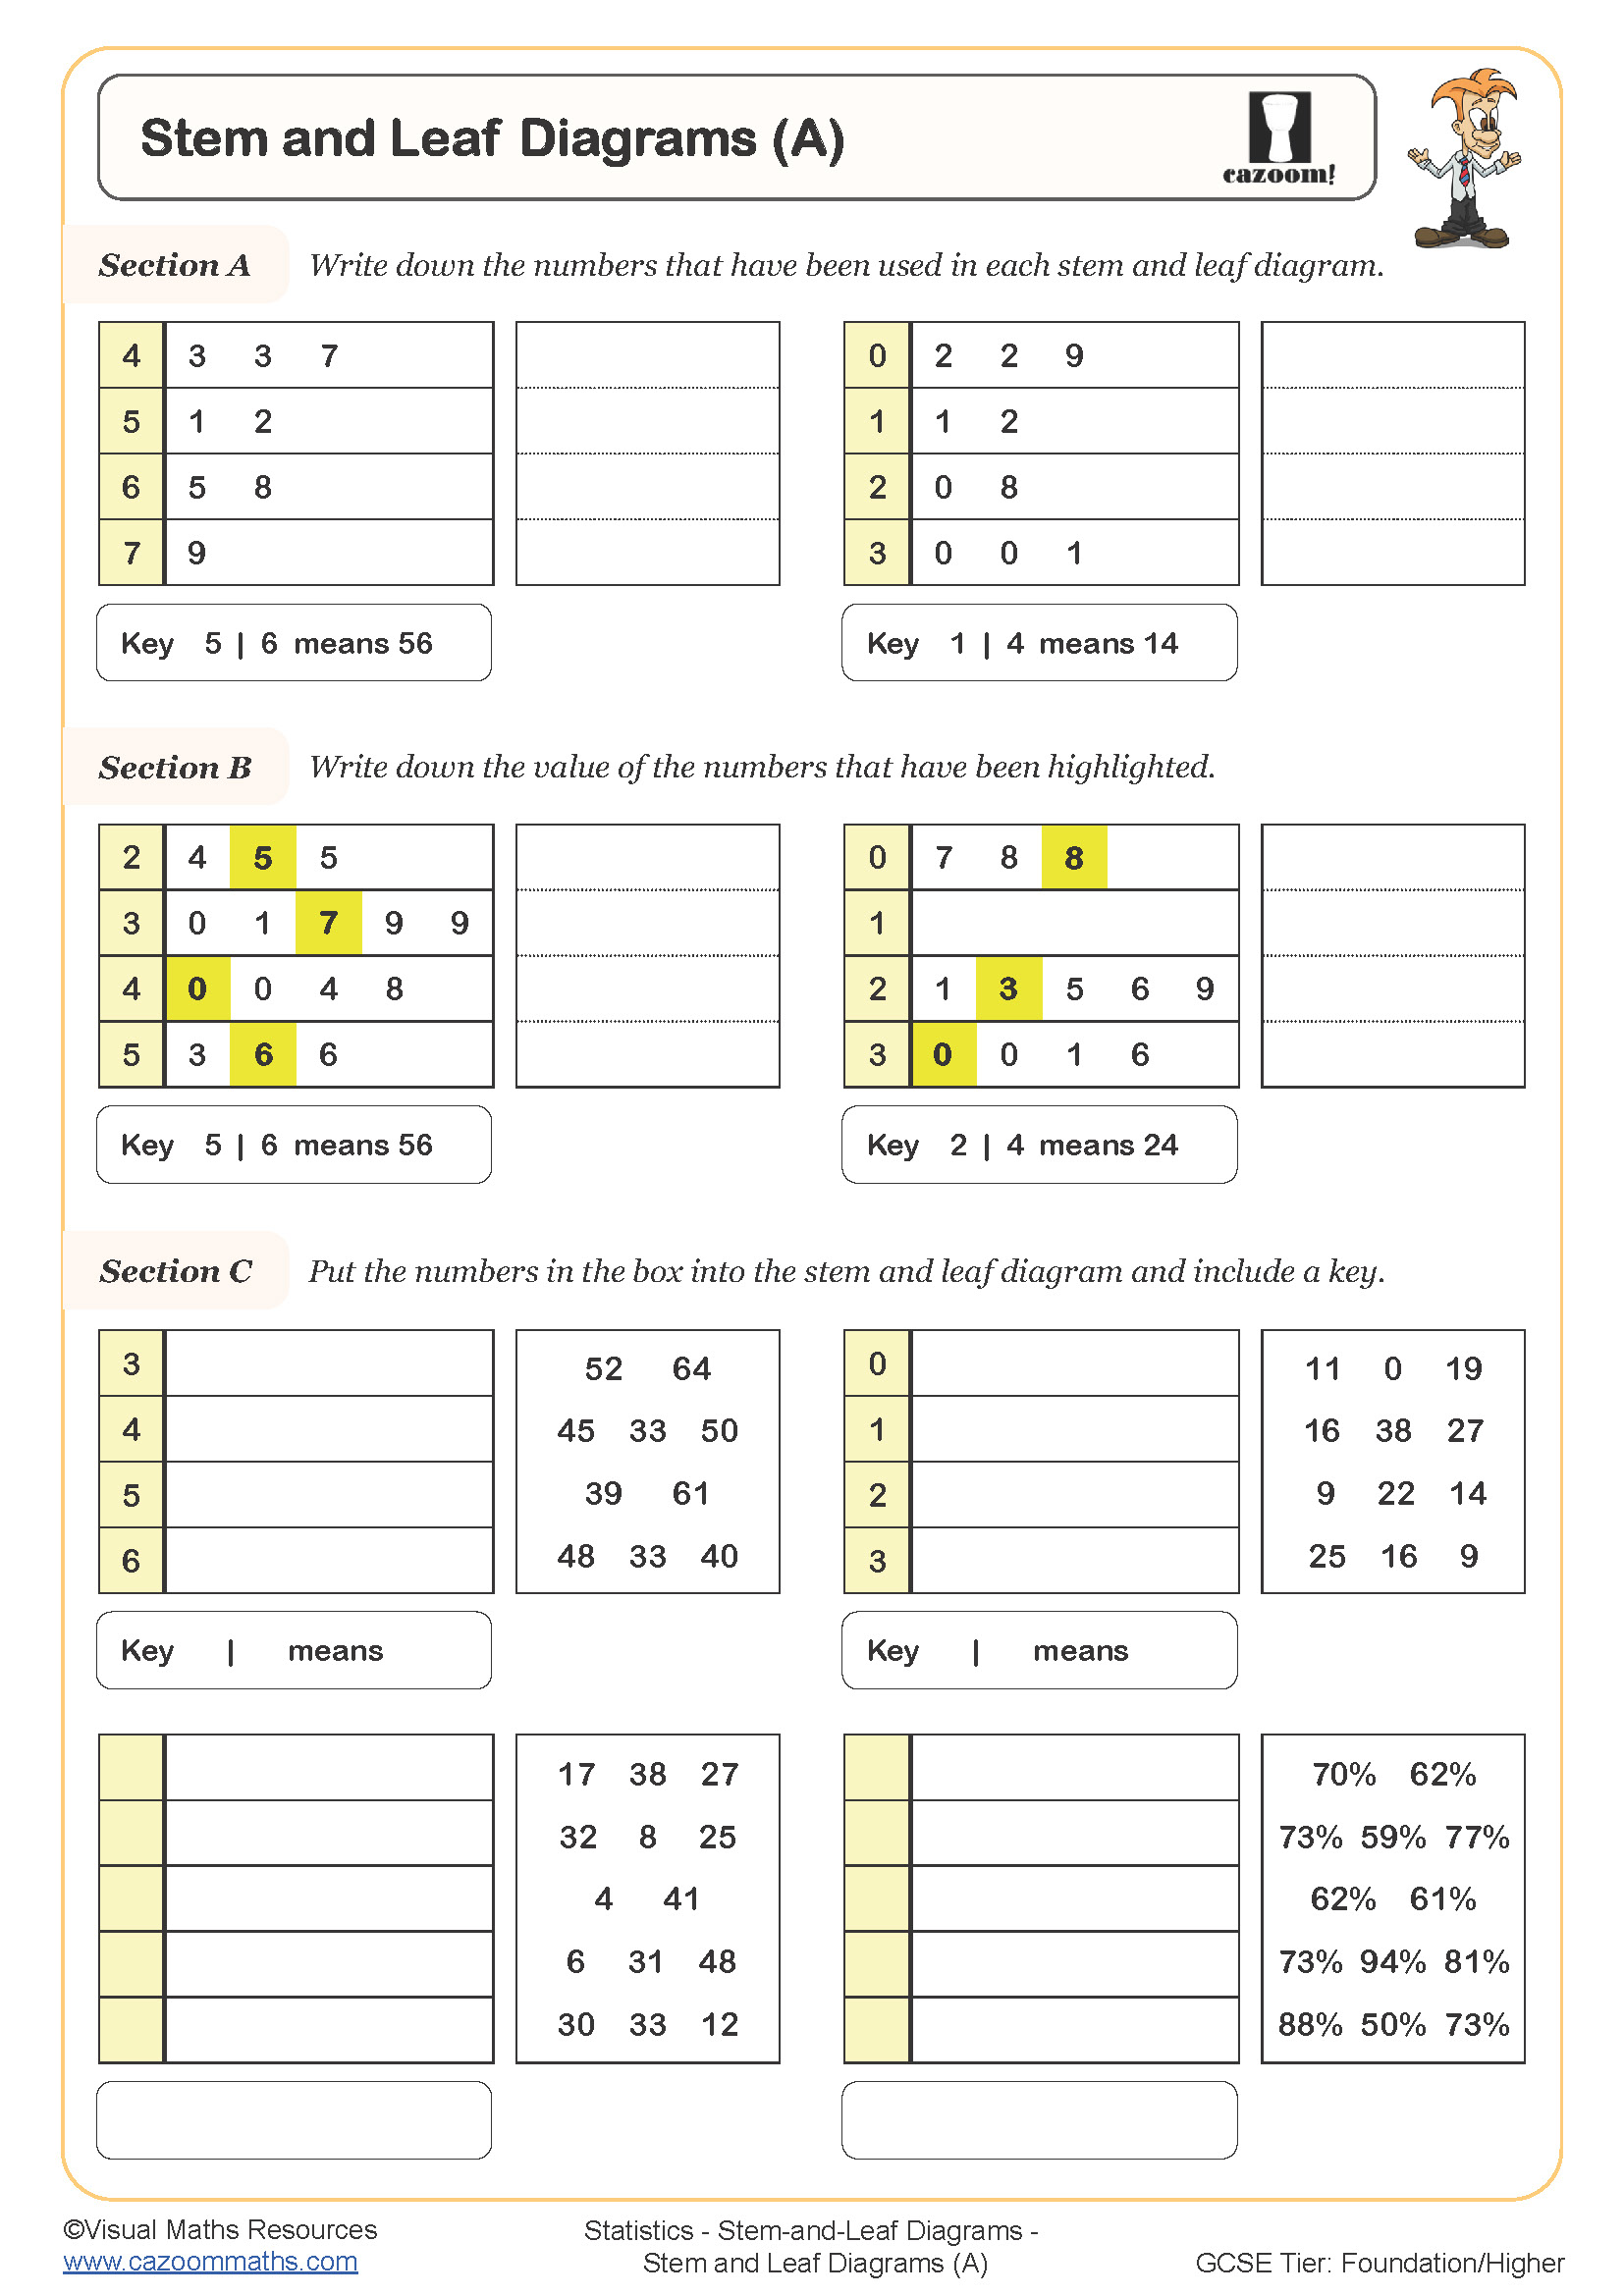
Section A asks learners to read from two stem and leaf diagrams to find the range, mode, median and mean.
Section B asks learners to create stem and leaf diagrams for two sets of data.
Sections C and D then require learners to create back-to-back stem and leaf diagrams which can then be used to compare two sets of data.
All worksheets are created by the team of experienced teachers at Cazoom Maths.
 Worksheet")
RELATED TO Stem and Leaf Diagrams (B) WORKSHEET
Frequently Asked Questions
Students should be comfortable with place value and ordering integers and decimals, as these skills are essential when organising data into the stem and leaf format. They'll also need to understand how to calculate averages and range from discrete data, since the worksheet requires them to find statistical measures from the diagrams they read and create.