Using Conversion Graphs WORKSHEET
Suitable for Year groups: Year 8, Year 9
GCSE Tier: Foundation
Targeting grades: 1-3
Prerequisite knowledge: Reading from scales.
Learning Objective: Interpret conversion graphs to calculate missing measurements.
Using Conversion Graphs WORKSHEET DESCRIPTION
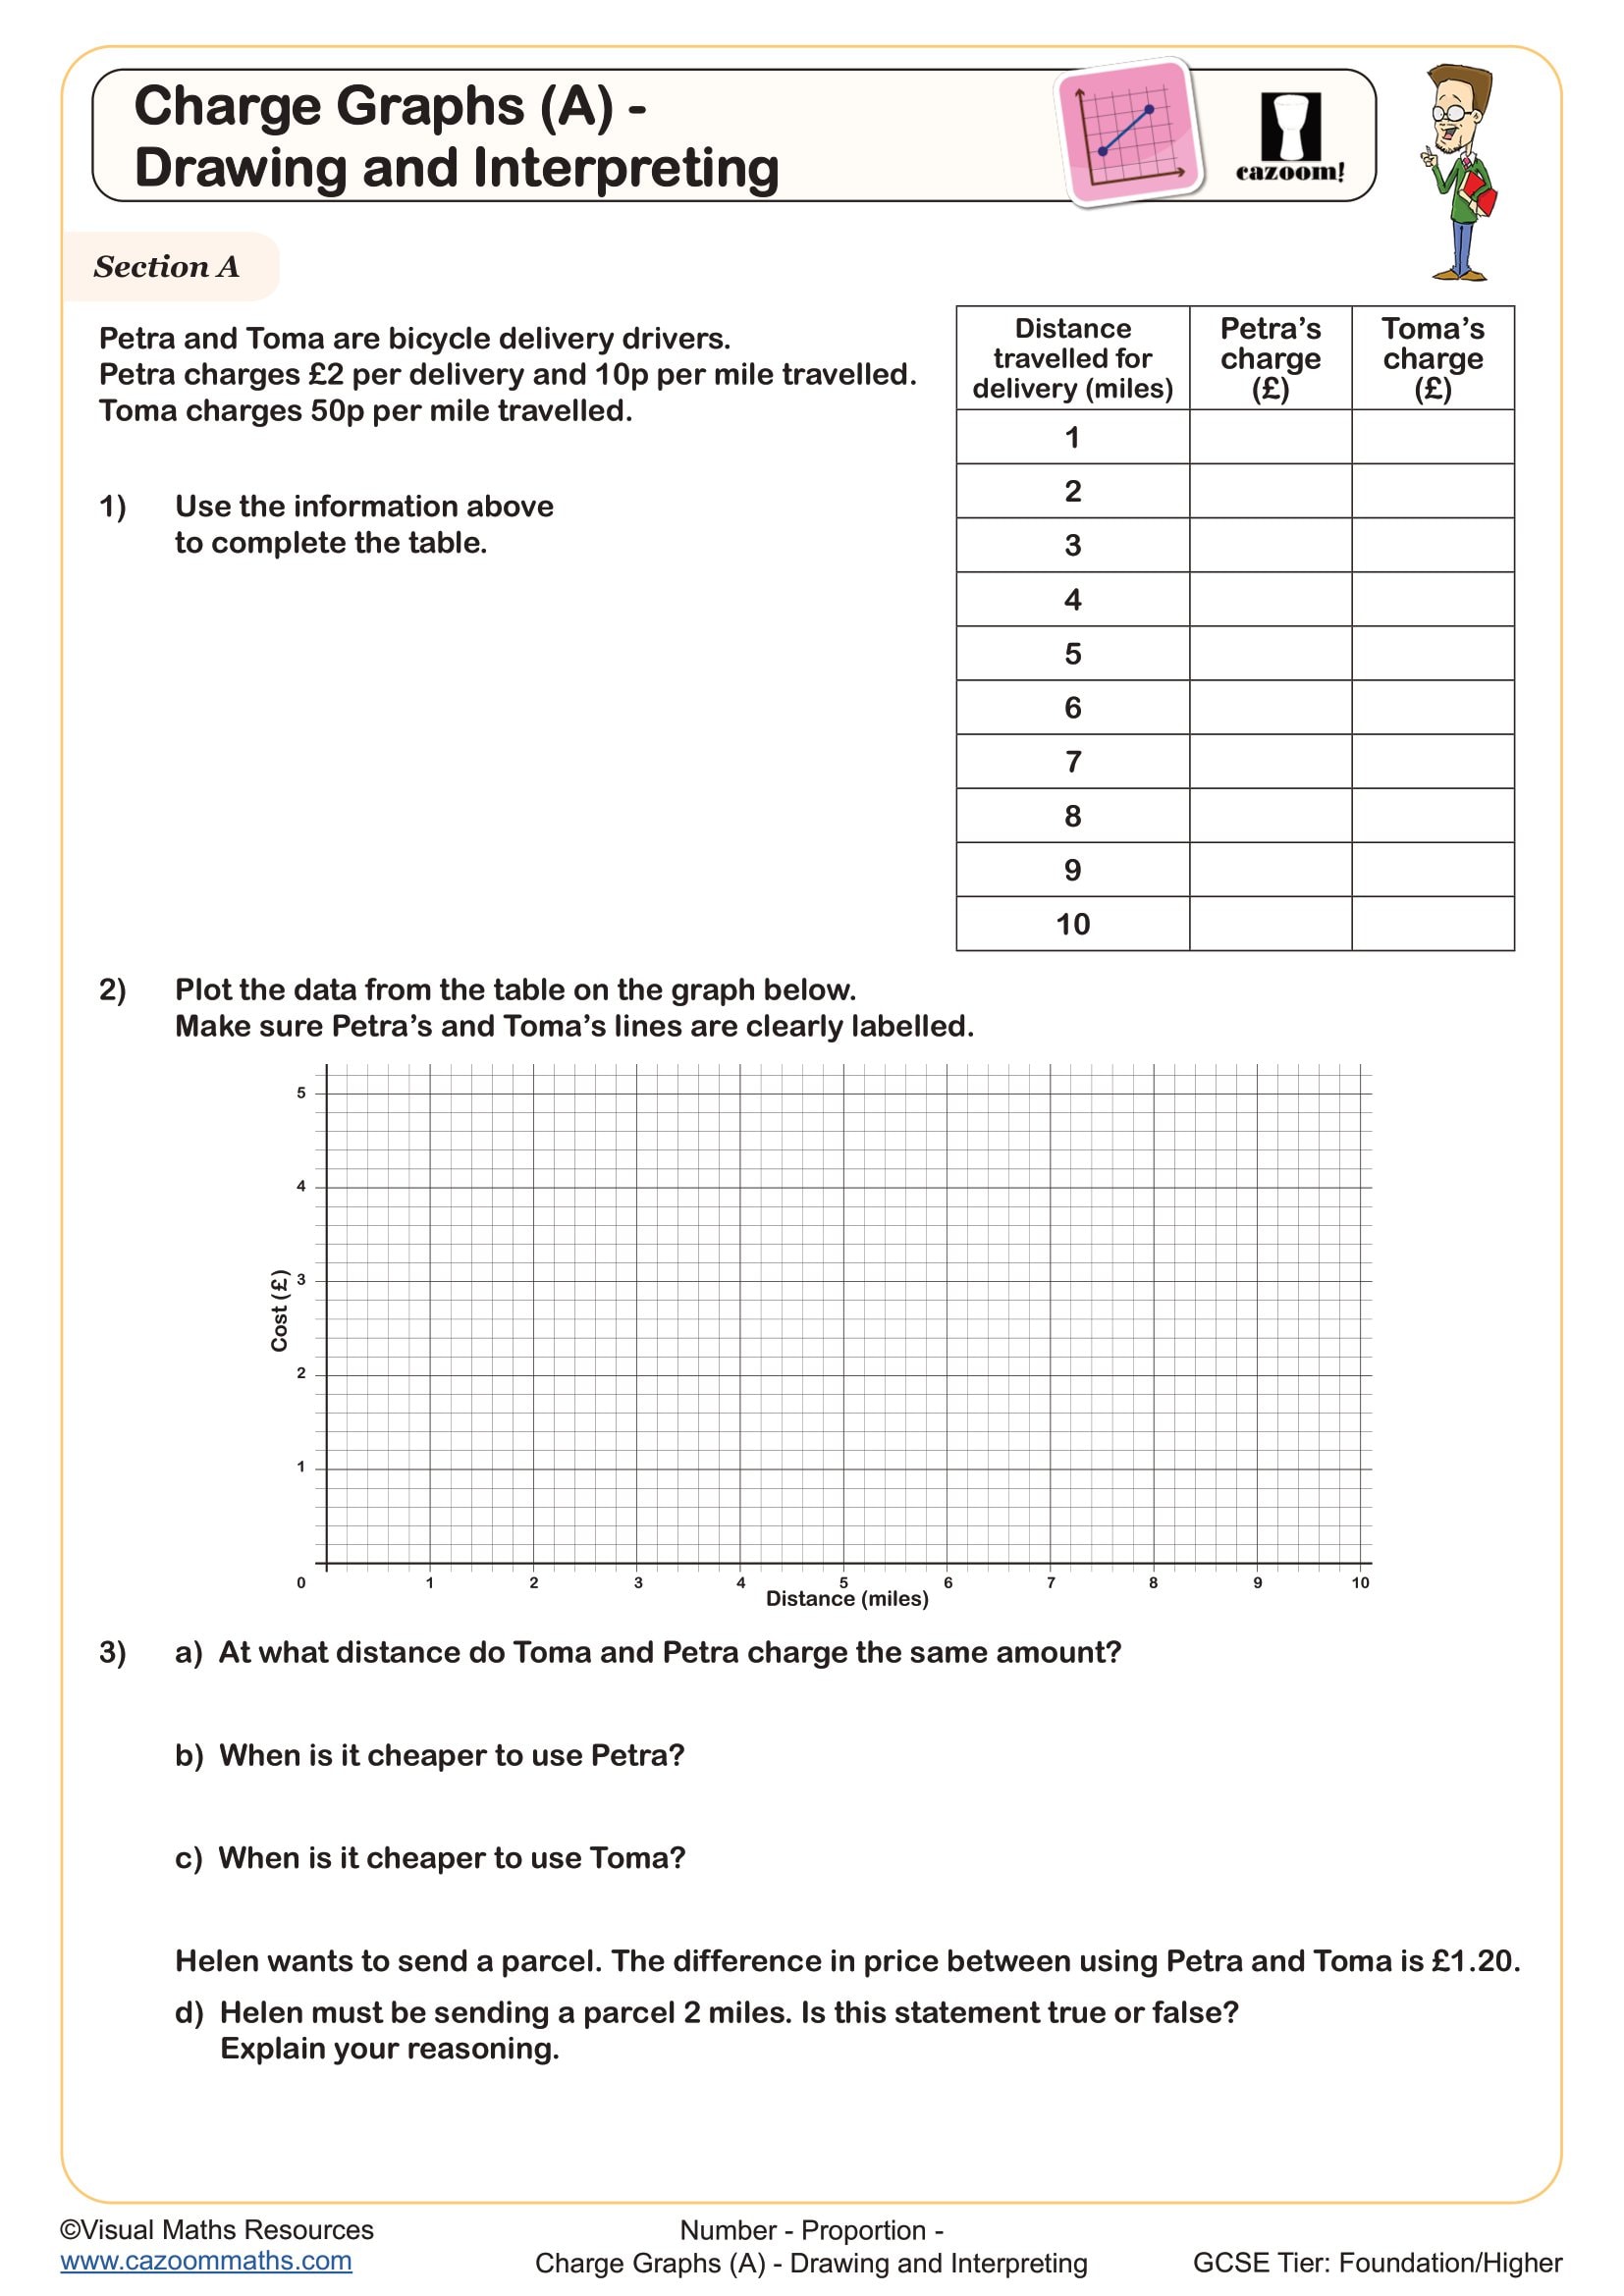
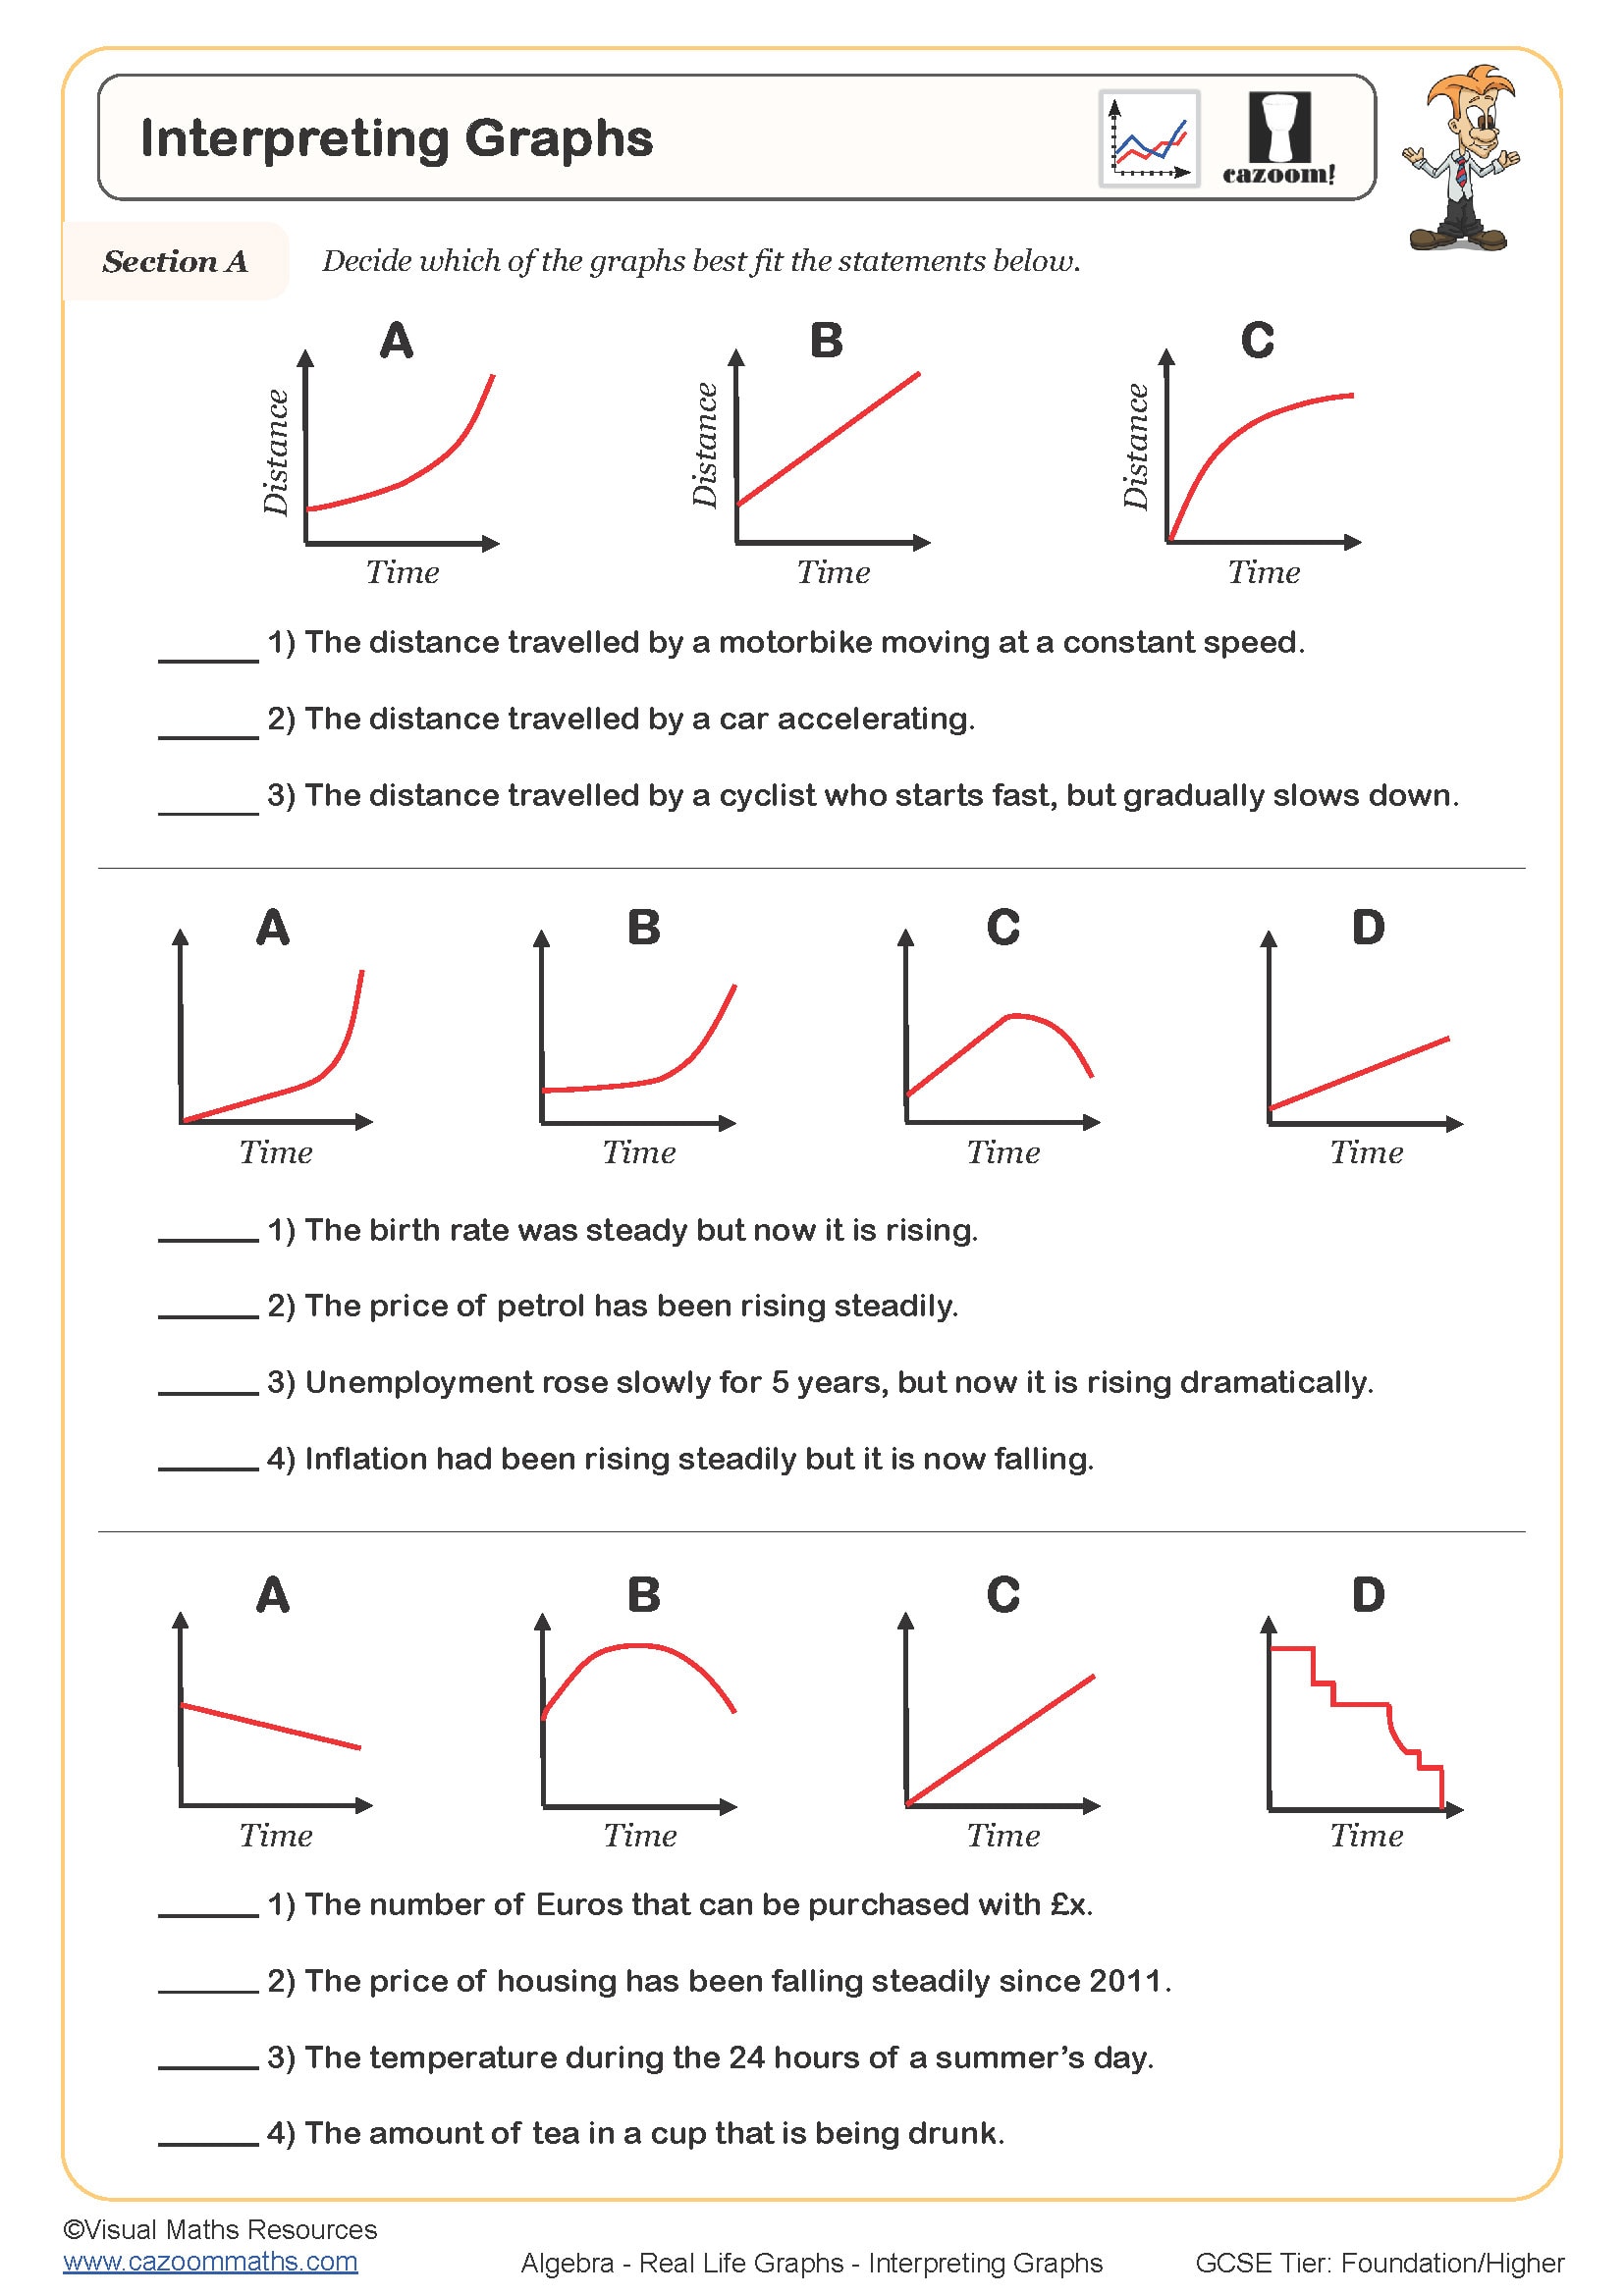
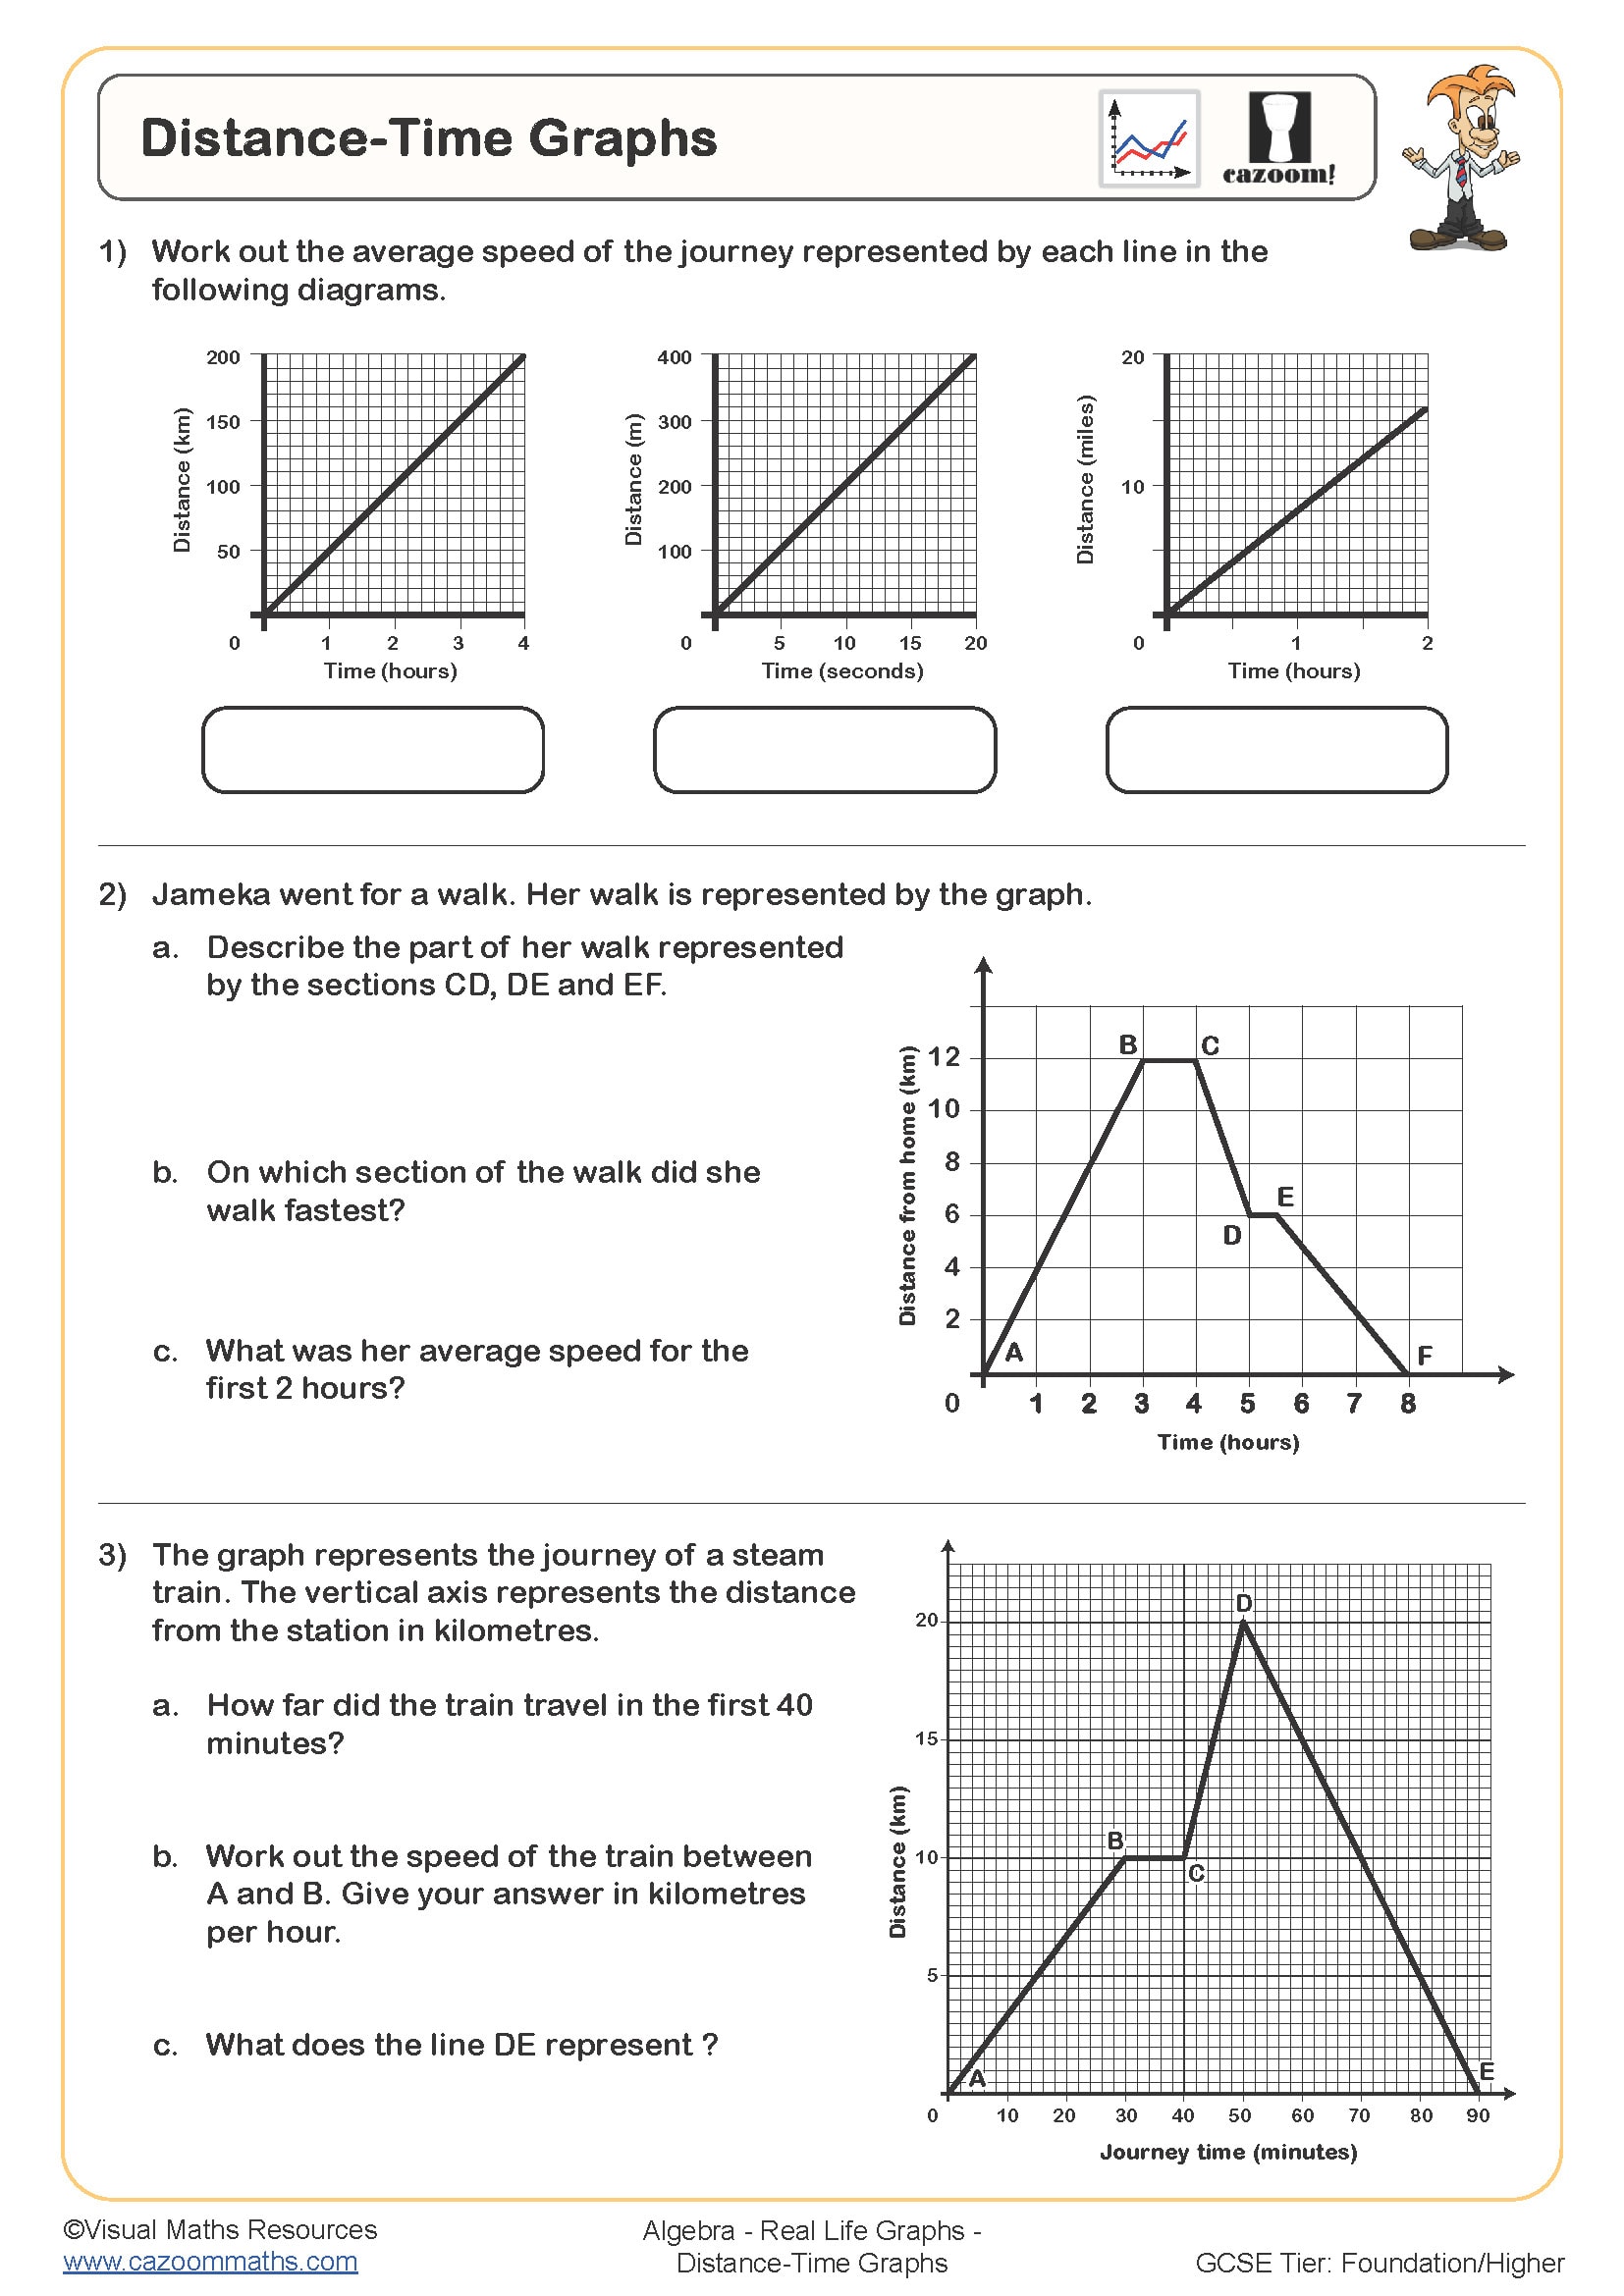
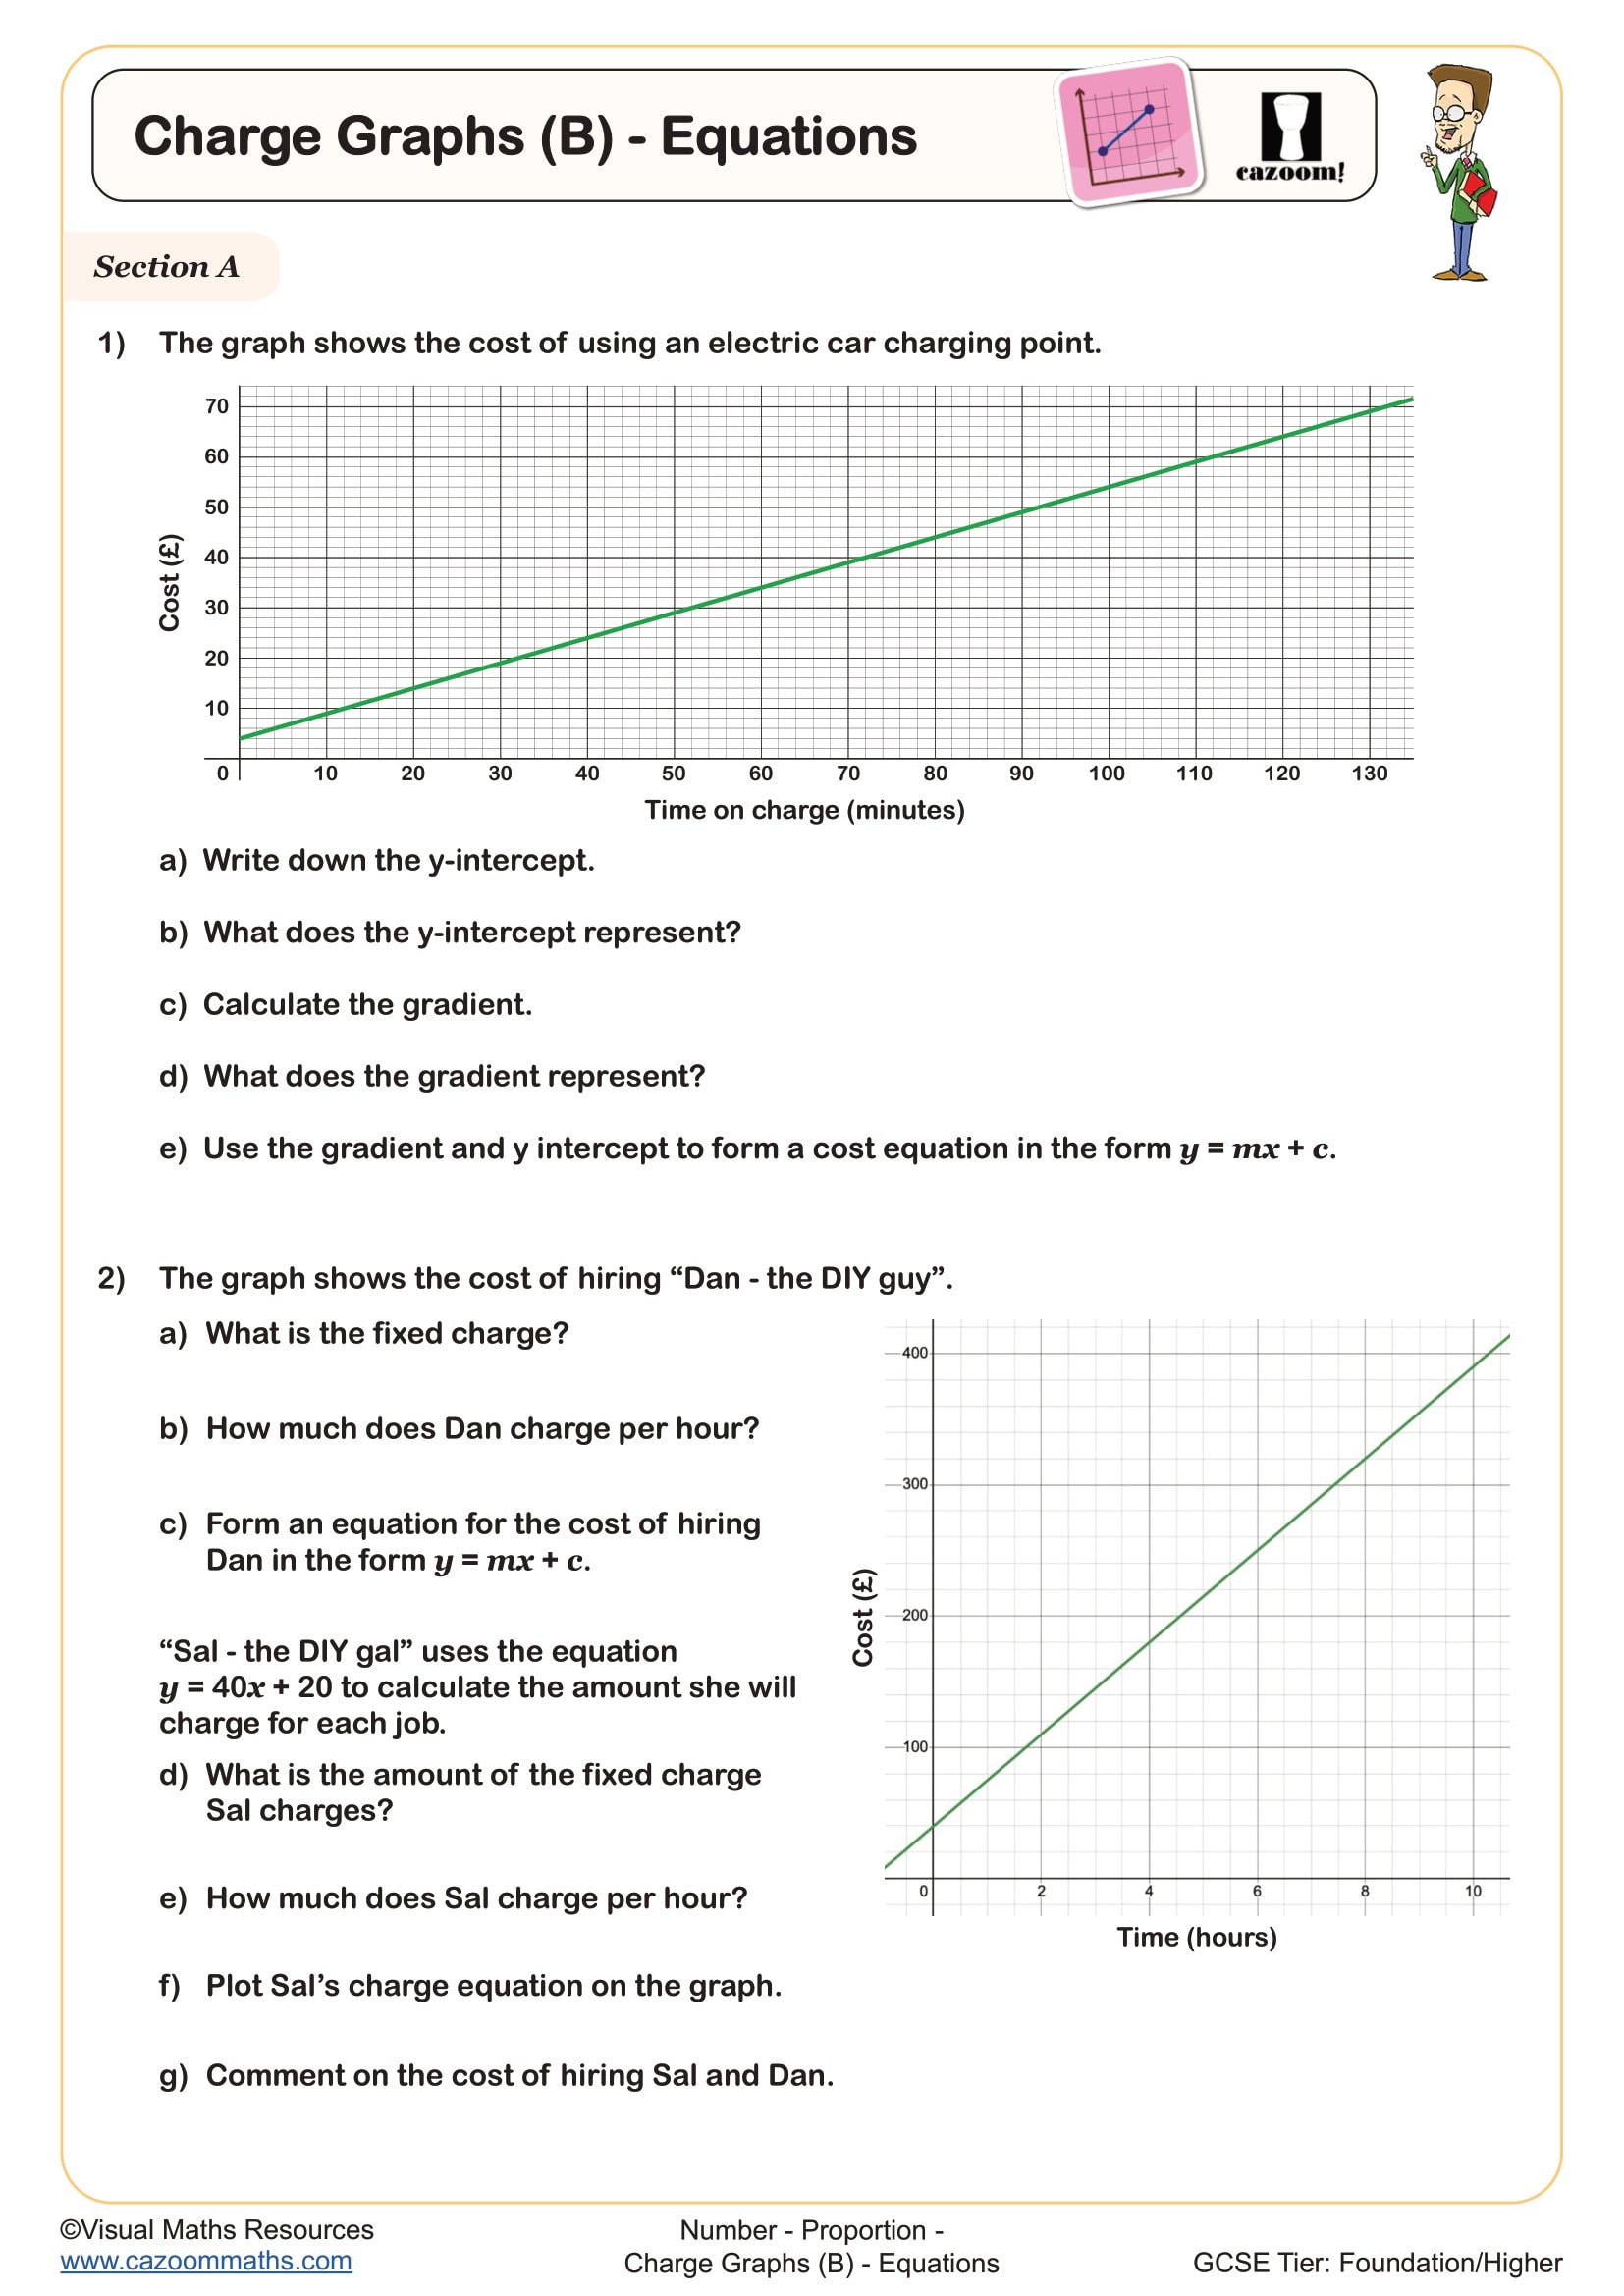
Students will read and interpret information from four different conversion graphs using this worksheet.
The conversion graphs include the following equivalences: kilometre to mile, centimetre to inch, degrees Celsius to Fahrenheit, and currency.
Learners will use direct proportion graphs to extrapolate information and explain why certain graphs may not support extrapolation.
Our collection also includes a worksheet focused on drawing conversion graphs.
All worksheets are created by the team of experienced teachers at Cazoom Maths.

RELATED TO Using Conversion Graphs WORKSHEET
Frequently Asked Questions
Interpret conversion graphs to calculate missing measurements.