Using Venn Diagrams to Solve Problems WORKSHEET
Using Venn Diagrams to Solve Problems WORKSHEET DESCRIPTION
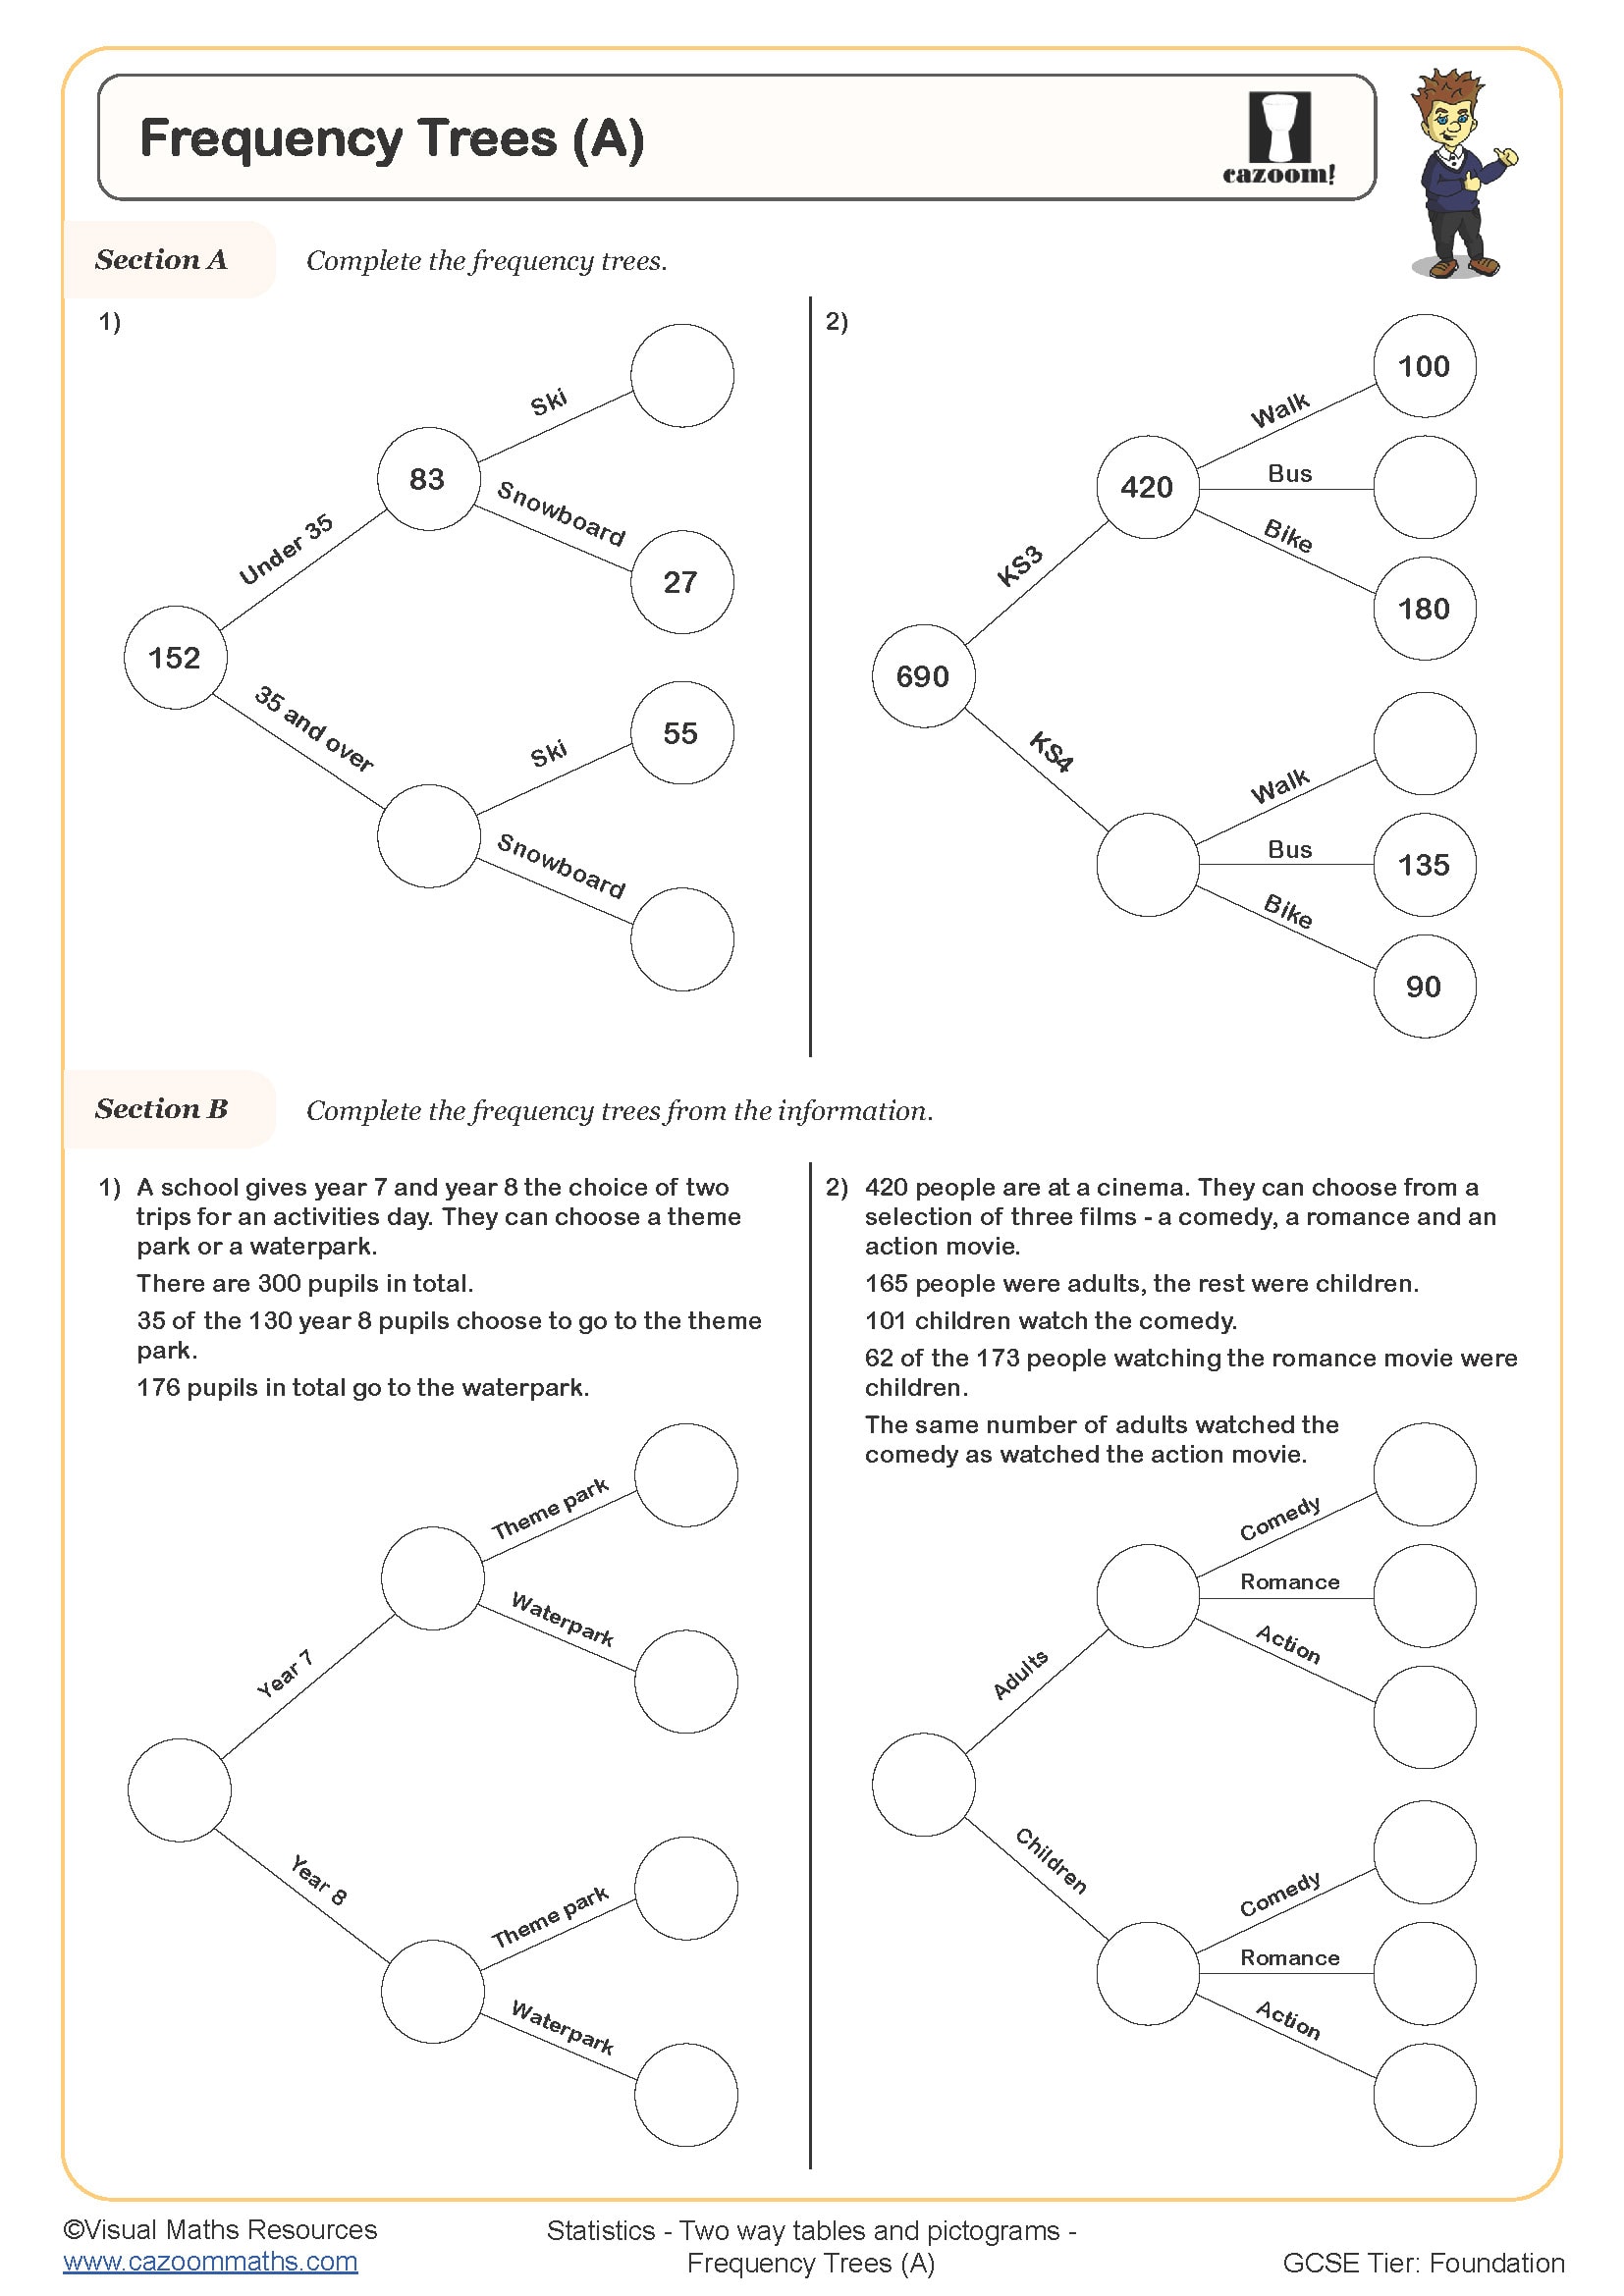
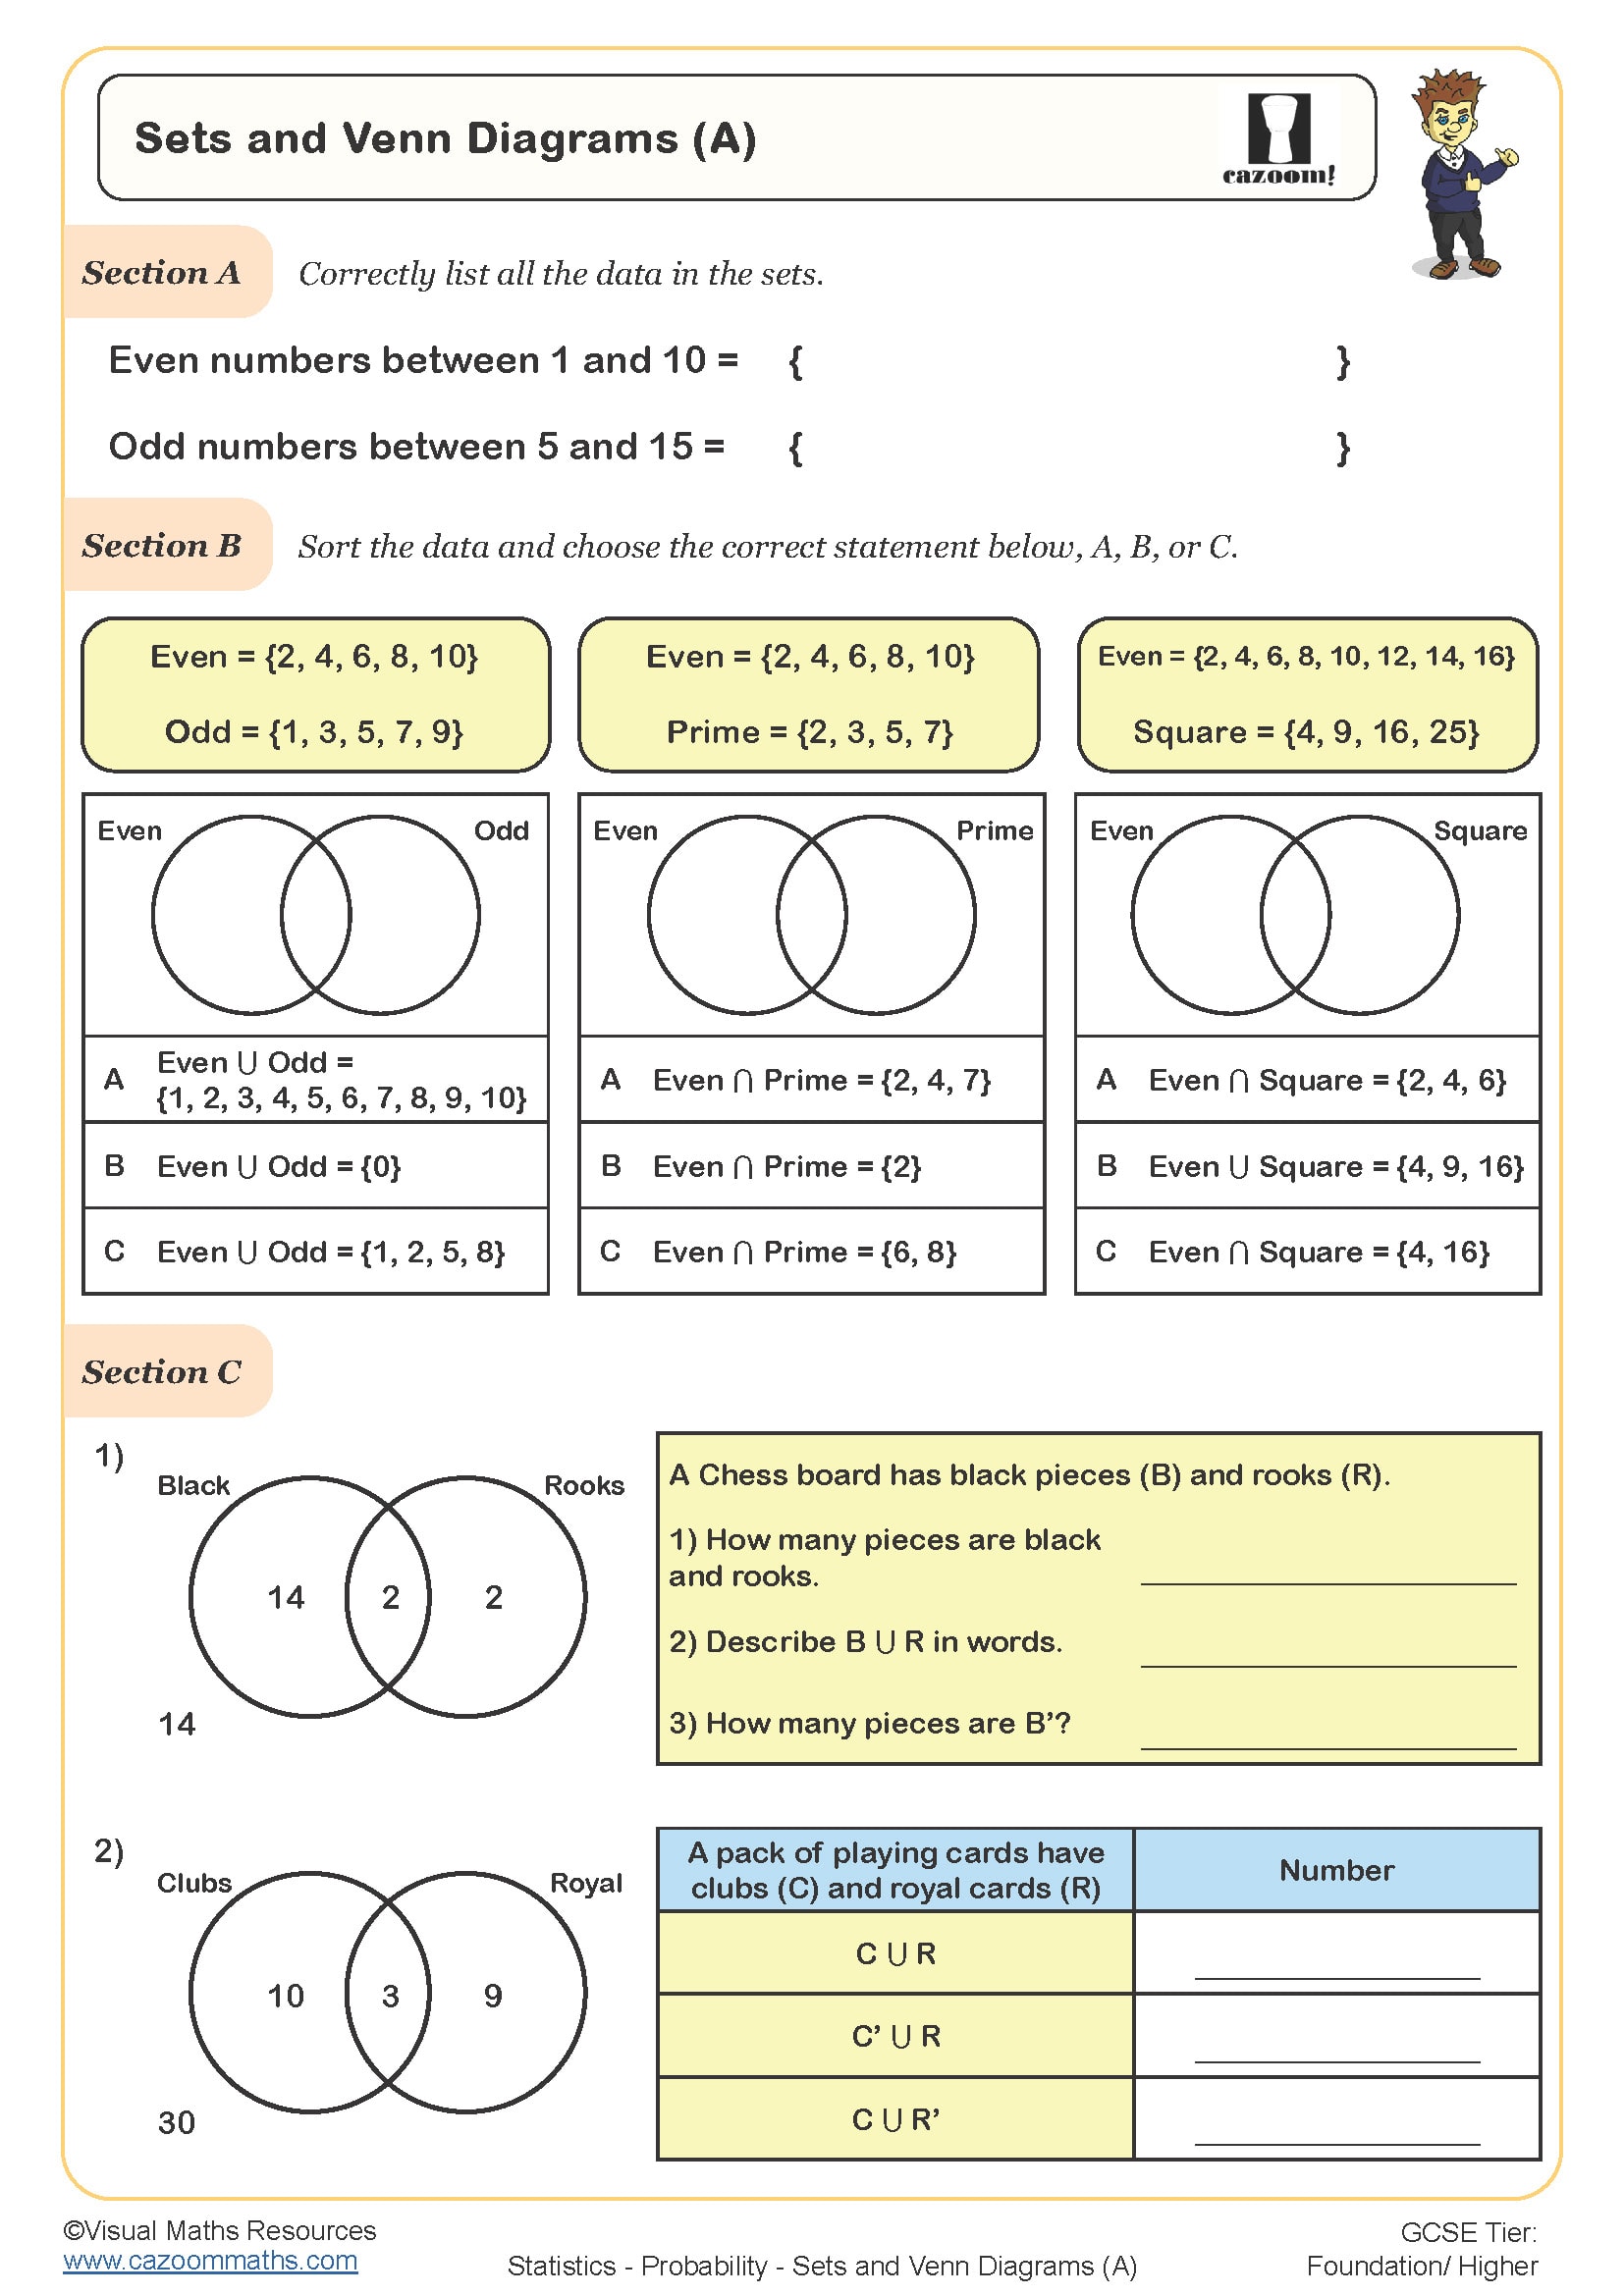
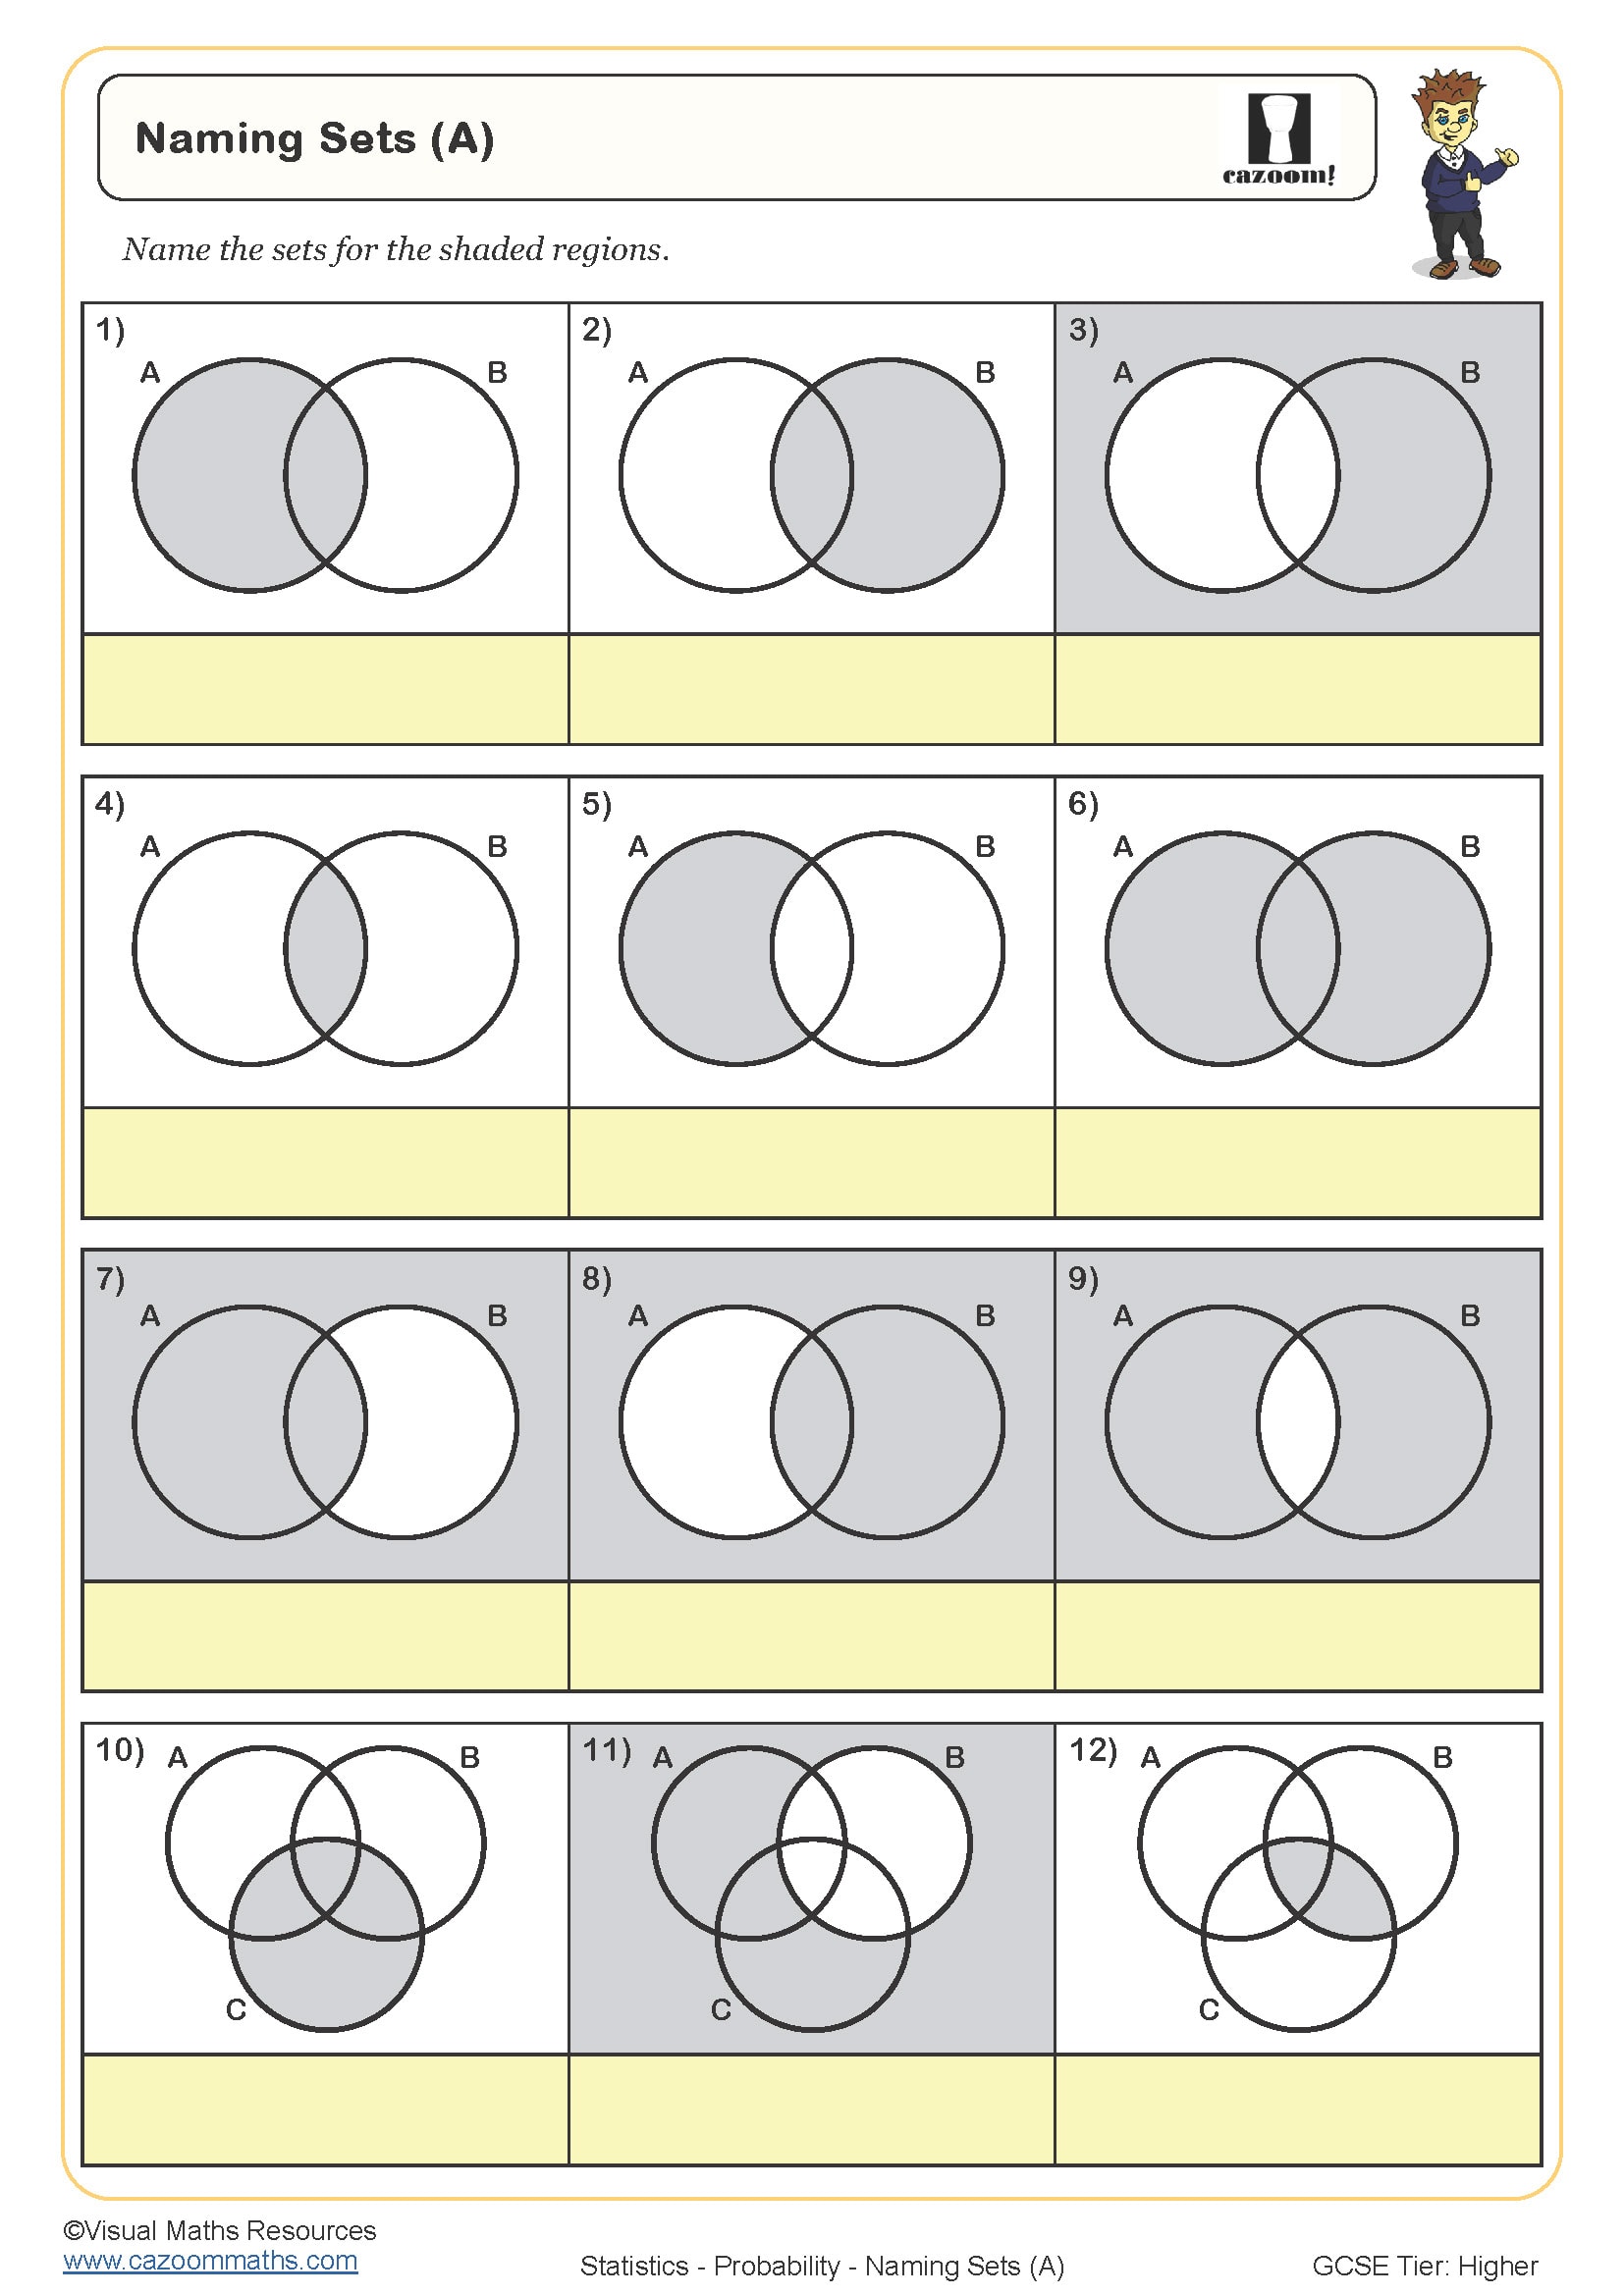
This worksheet helps students develop their ability to analyse and interpret data in probability and statistics. It progresses from simple sorting tasks to more challenging problem-solving that requires logical thinking.
Students start by completing Venn diagrams using given numerical information. As they advance, they work with percentages and overlapping data sets. Real-world contexts, such as library book checkouts, after-school activities, and restaurant dining choices, are used throughout. More advanced questions encourage critical thinking about overlapping groups.
Ideal for foundation and higher-tier GCSE students, this resource strengthens both conceptual understanding and exam readiness in probability-based questions.
All worksheets are created by the team of experienced teachers at Cazoom Maths.

RELATED TO Using Venn Diagrams to Solve Problems WORKSHEET
-Questions-Worksheet.jpg?w=3840)
Frequently Asked Questions
Students should be comfortable with addition and subtraction of whole numbers before tackling these Venn diagram problems. They'll also need to understand how to calculate and interpret percentages, as the worksheet incorporates percentage-based data alongside the numerical information they'll be organising into diagrams.