Graphing Inequalities Worksheets
All worksheets are created by the team of experienced teachers at Cazoom Maths.
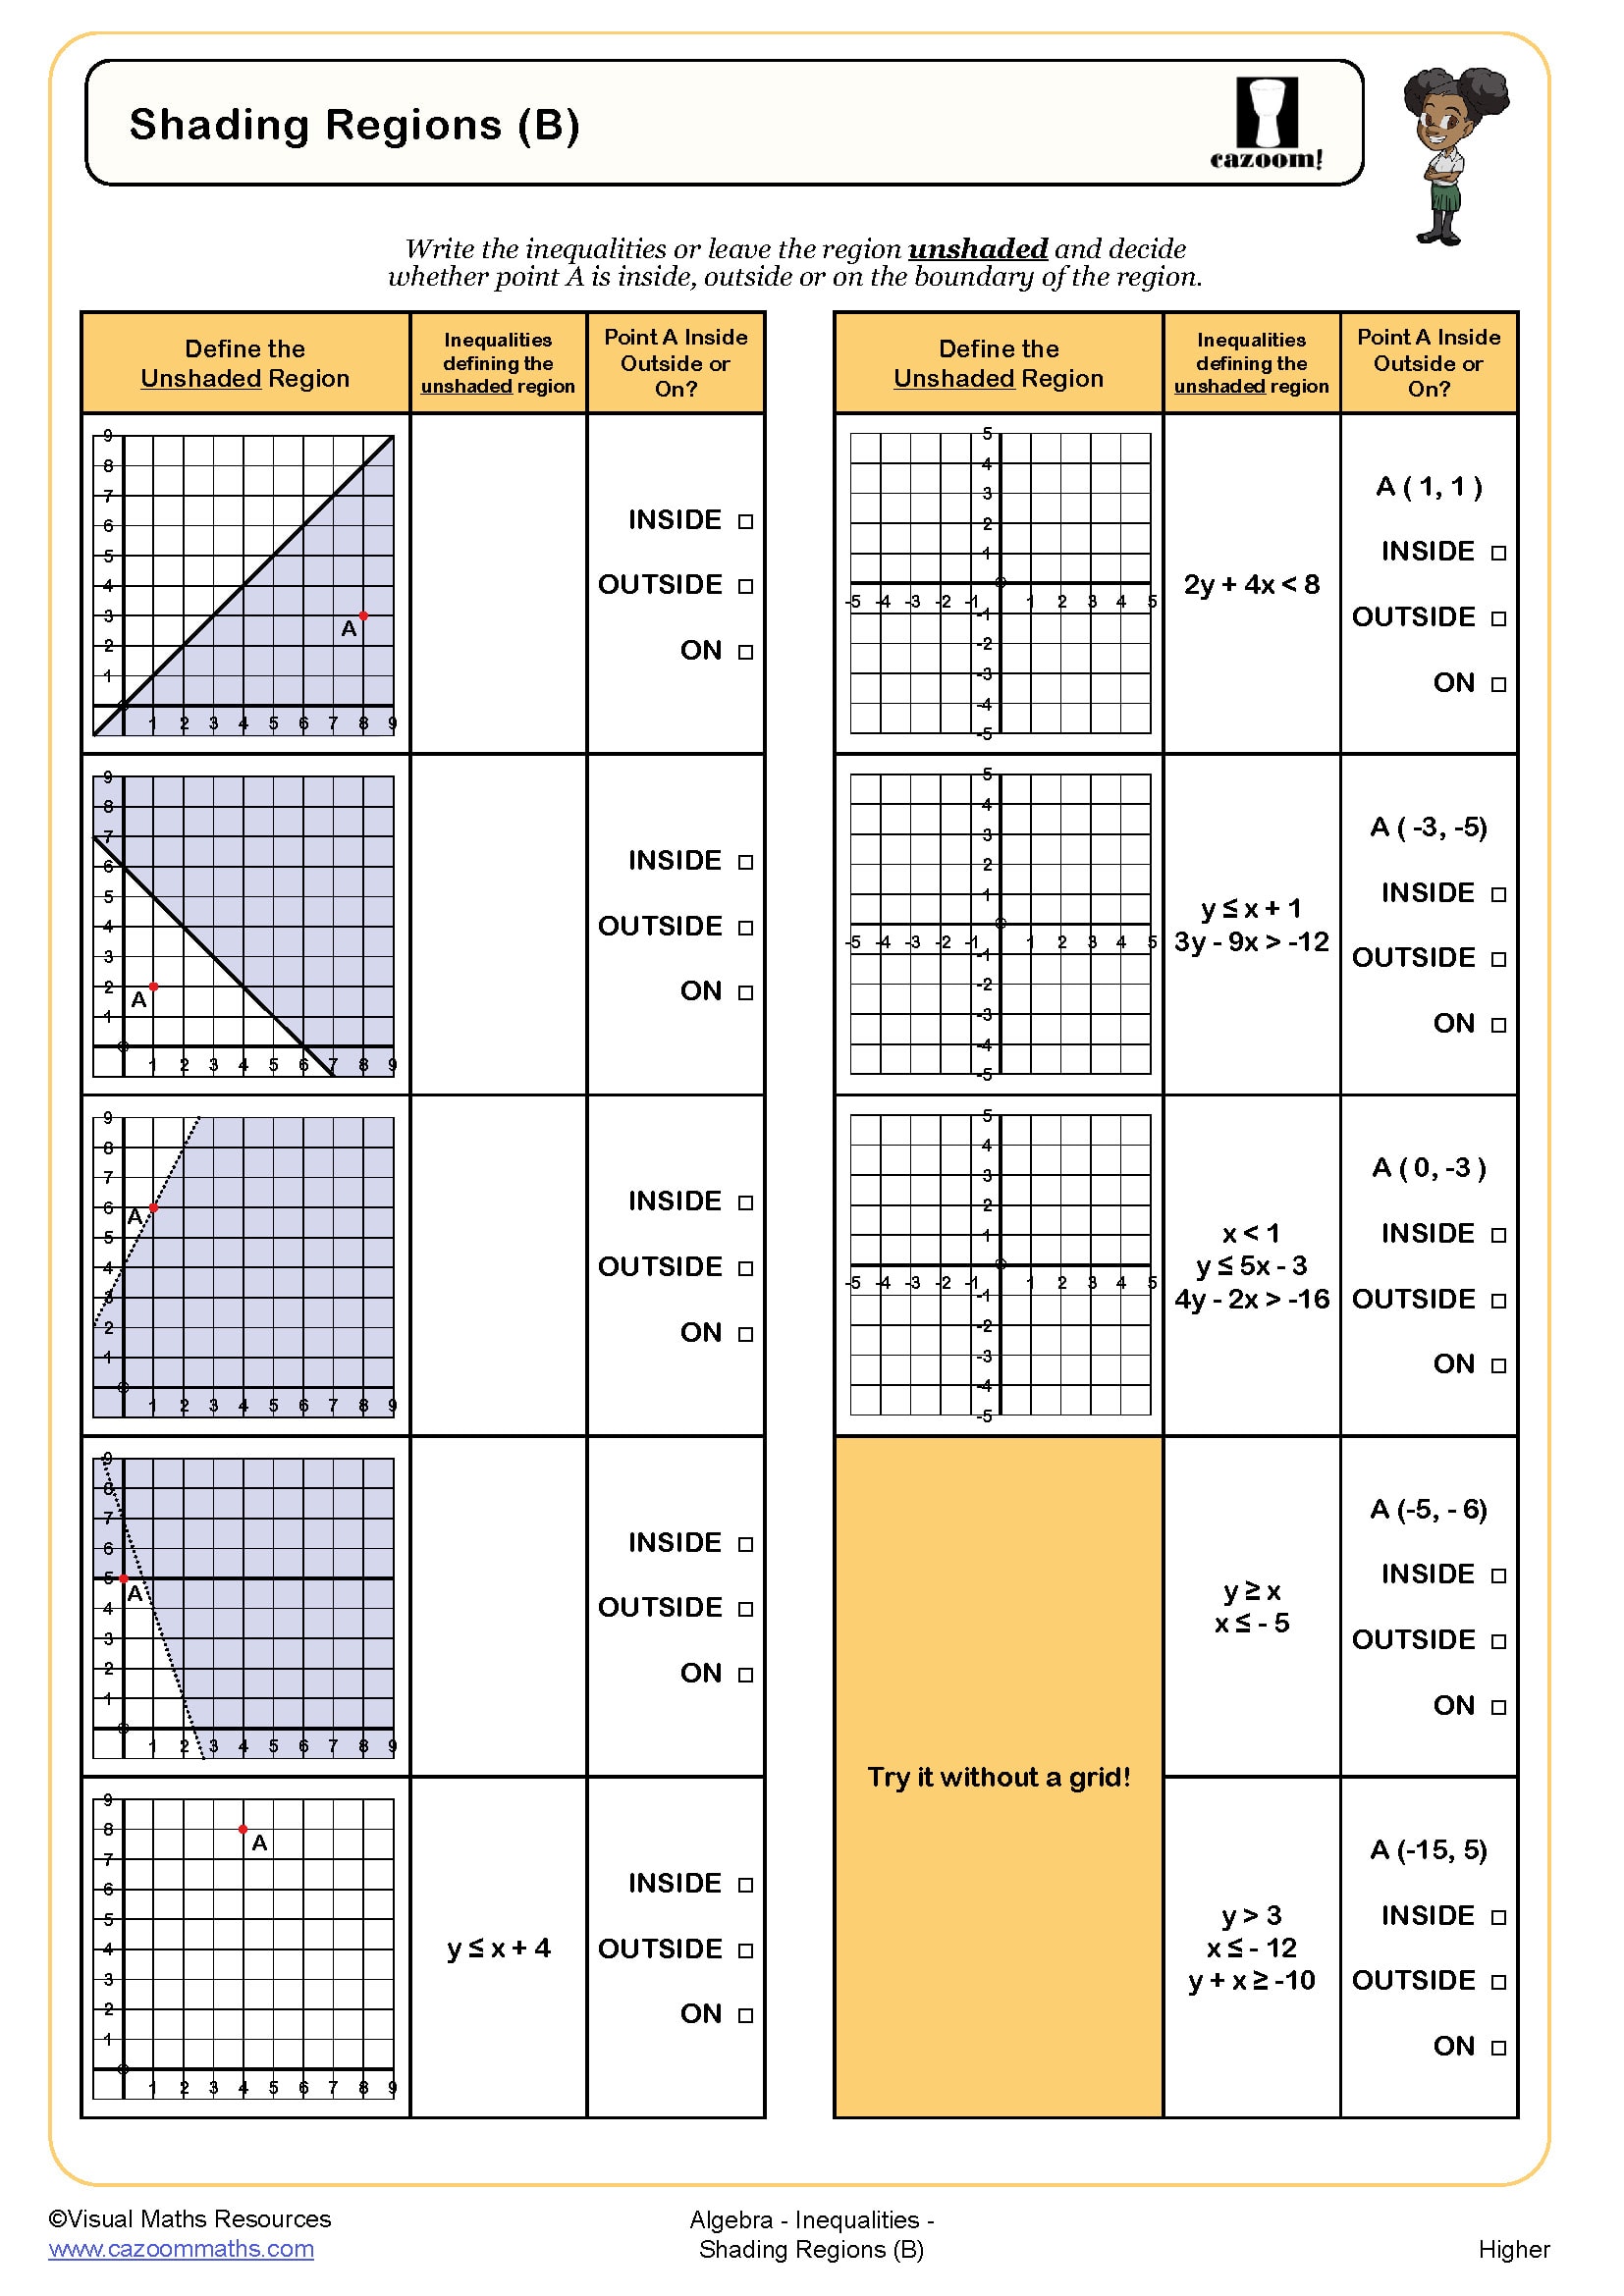
What skills do students practise with graphing inequalities worksheets?
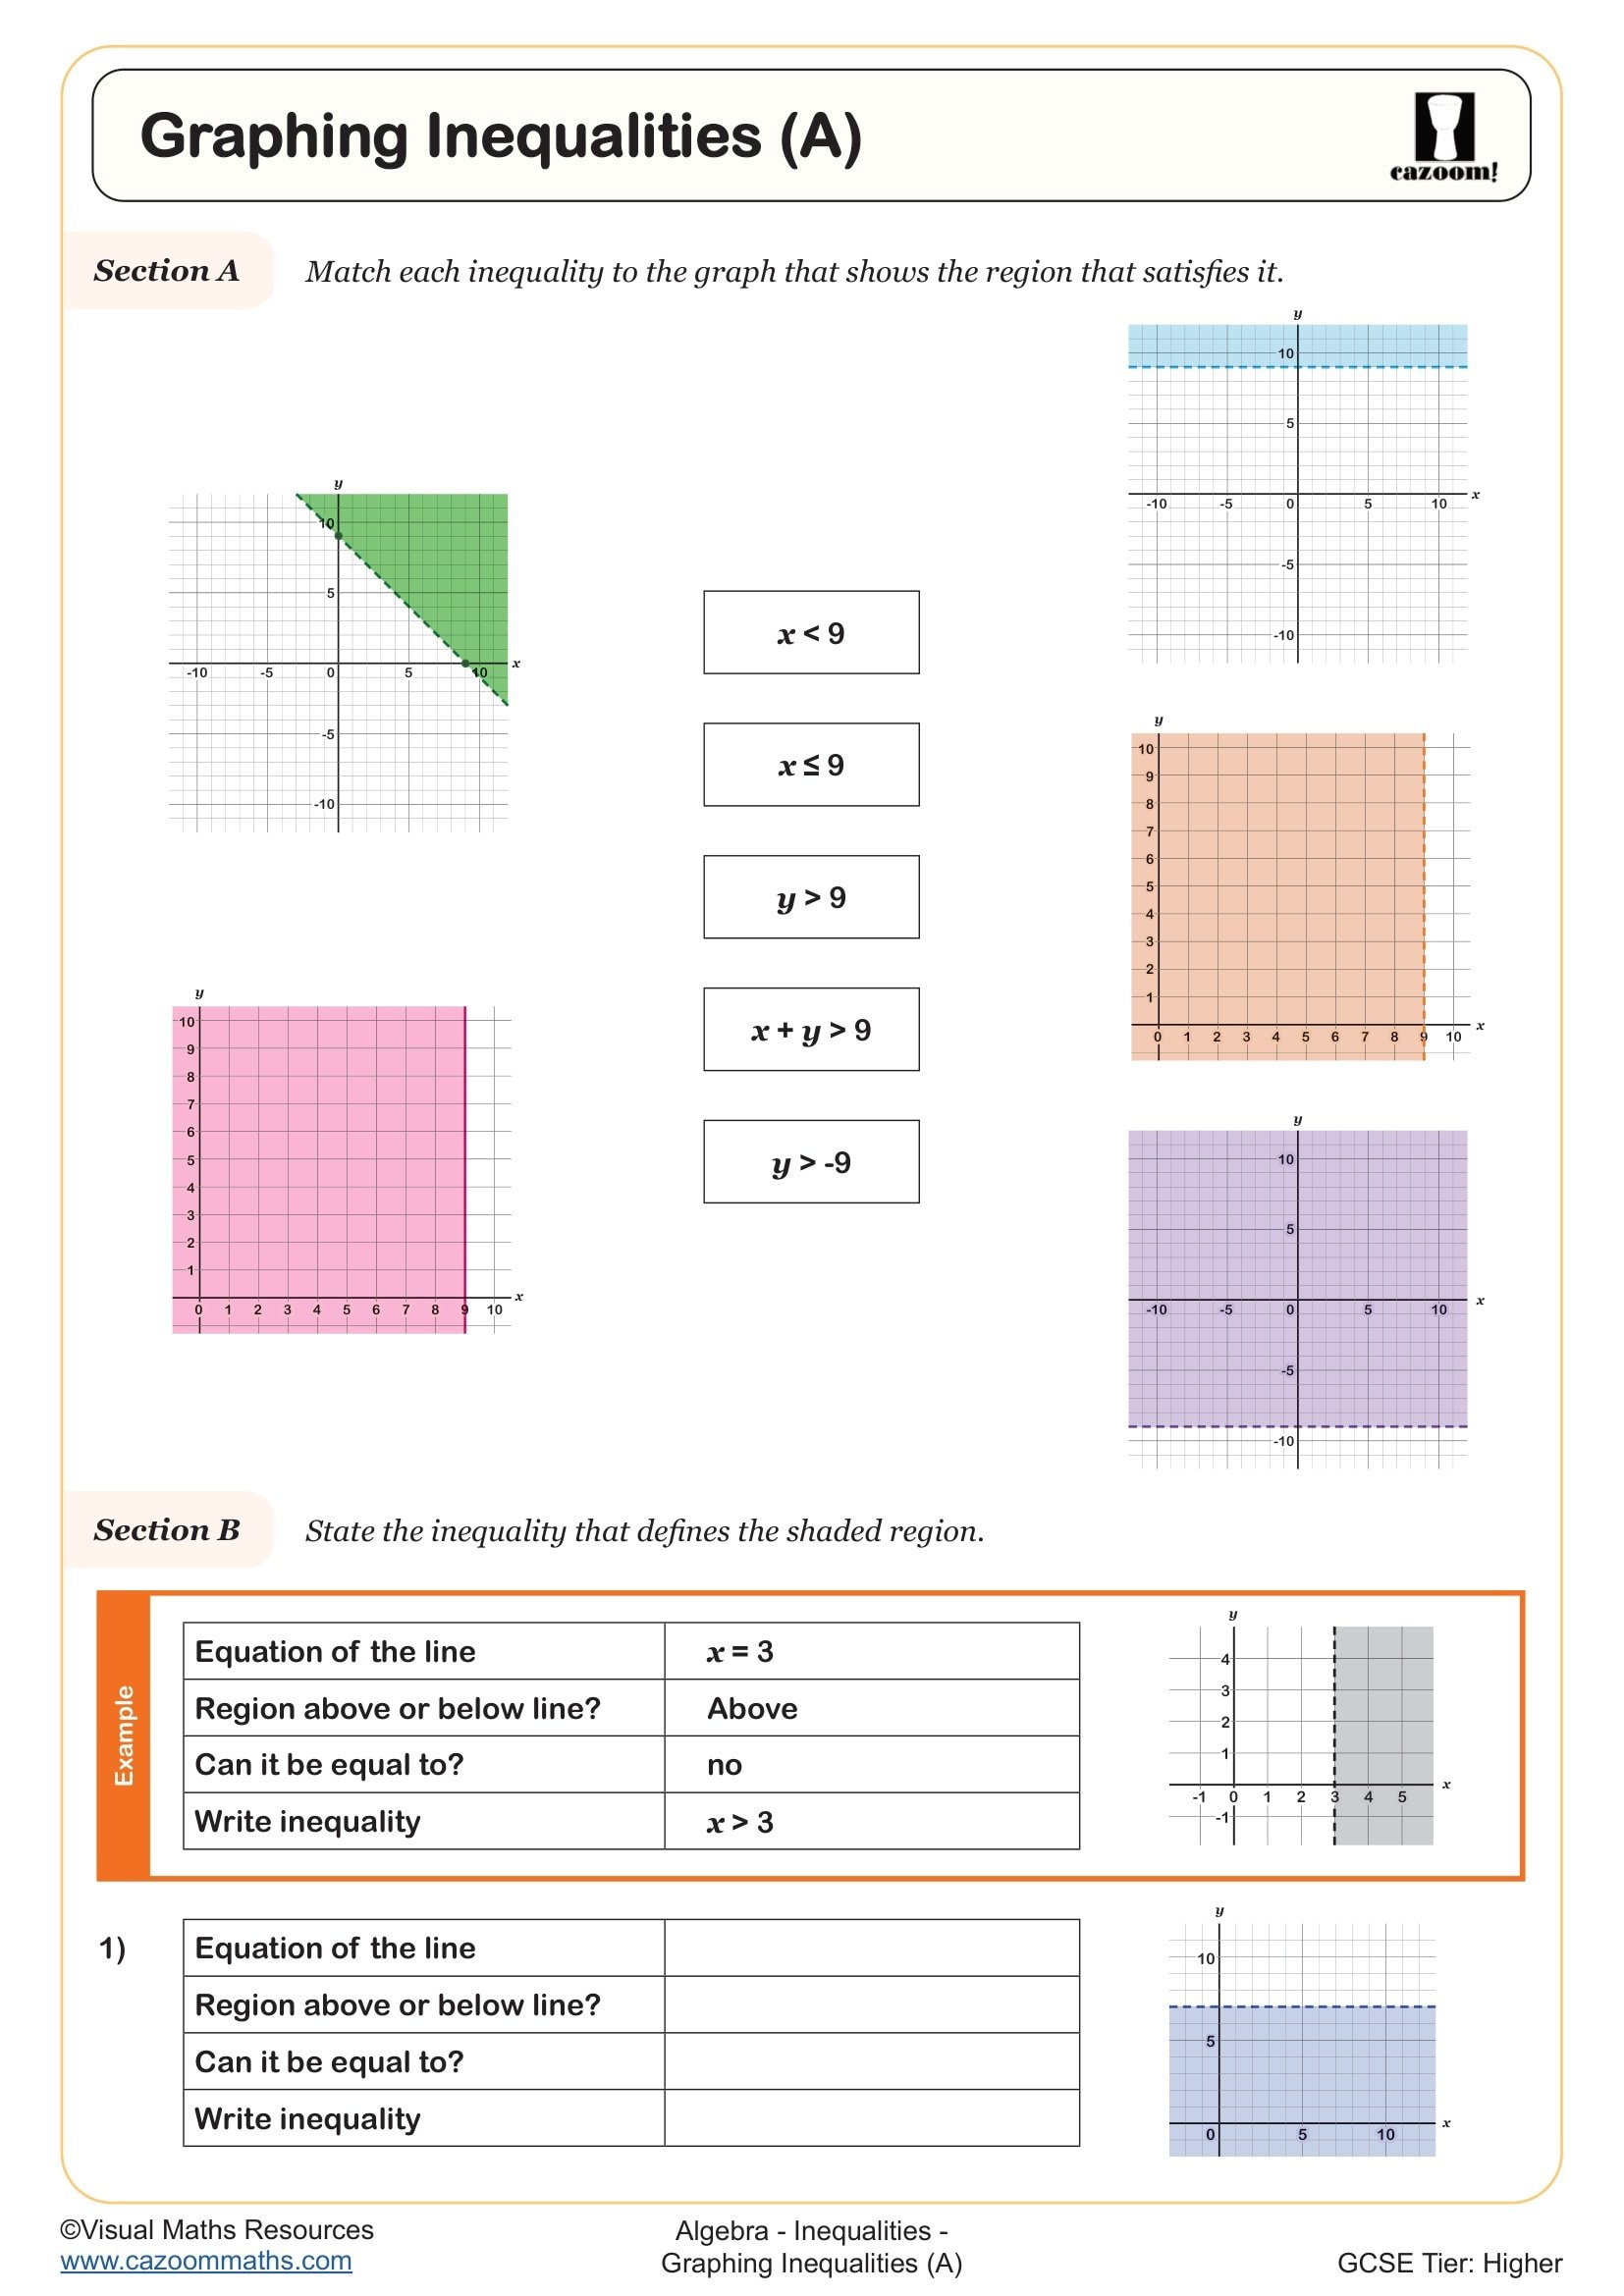
Students develop several interconnected skills when working with inequalities on graphs. They learn to convert inequality notation into visual representations by plotting boundary lines, determining whether these lines should be solid or dashed based on whether the inequality includes equality, and correctly shading the region that satisfies the inequality. These worksheets also build understanding of how inequalities with > or < symbols require dashed lines, whilst ≥ or ≤ require solid lines.
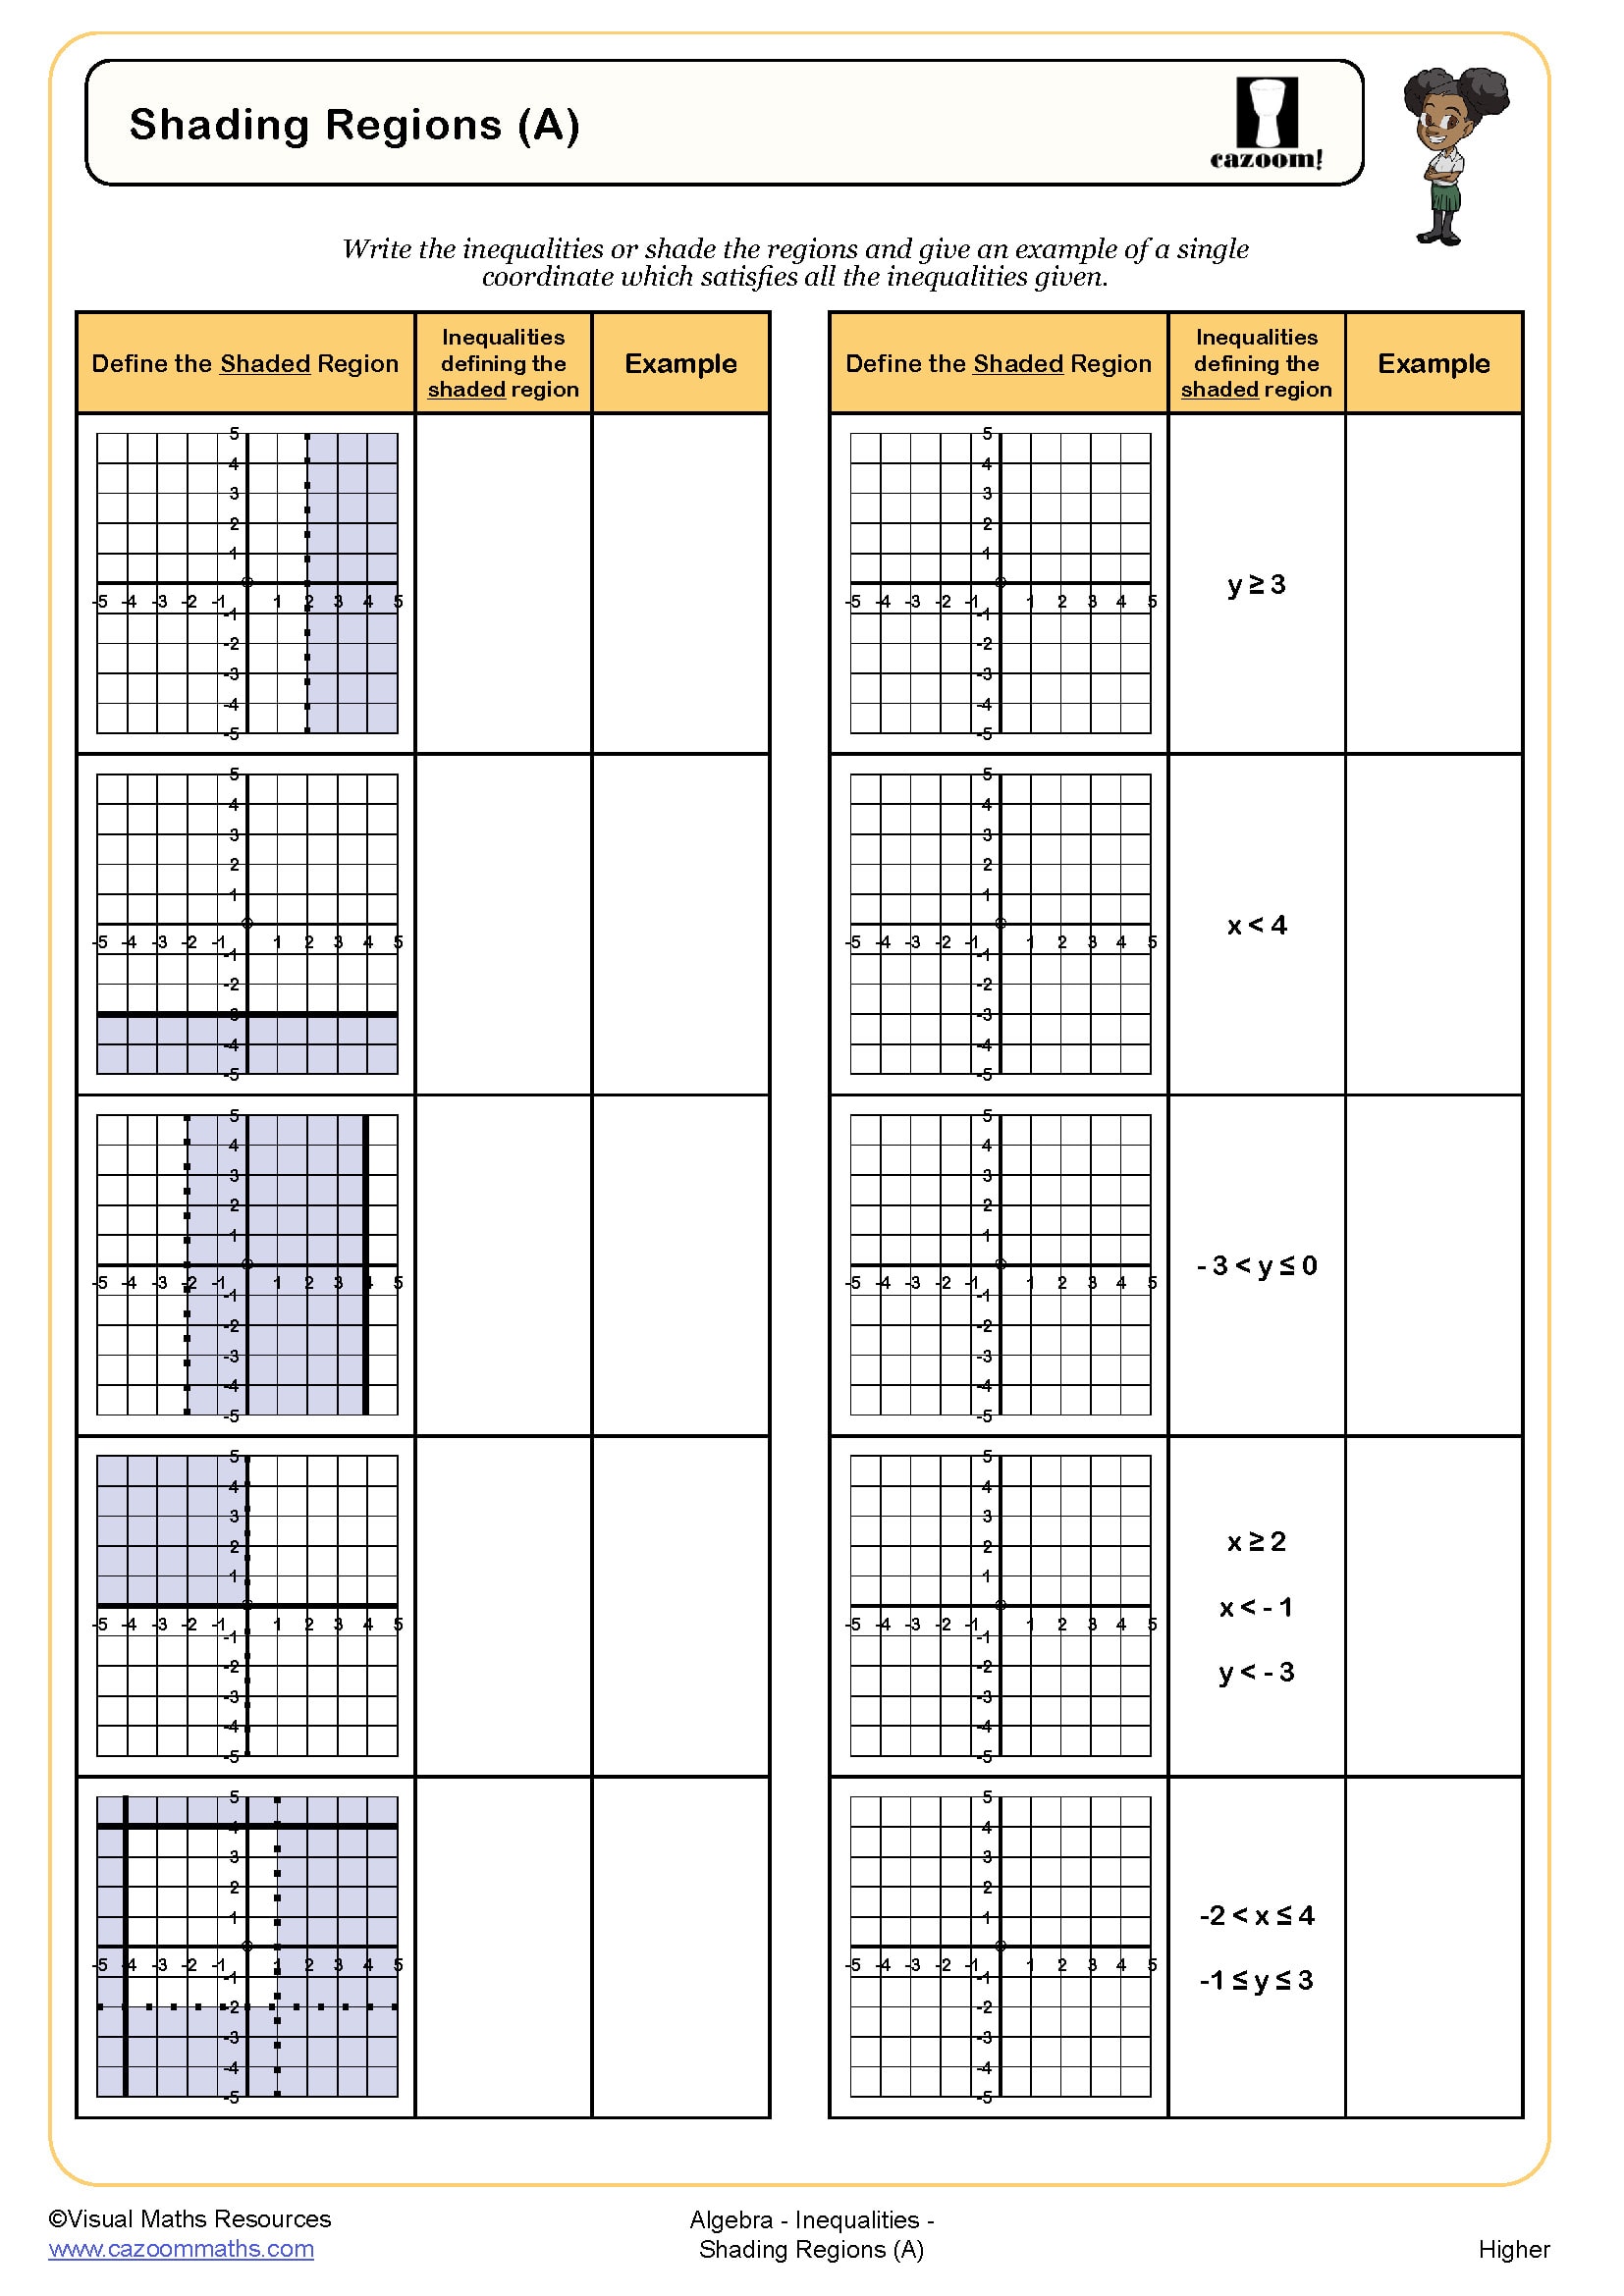
More advanced worksheets include systems of inequalities where students must identify the overlapping region that satisfies multiple conditions simultaneously. This skill directly supports problem-solving questions at GCSE where students interpret real-world constraints, such as budgeting scenarios or optimization problems. The visual nature of graphing inequalities helps students develop spatial reasoning and connects algebraic notation to geometric representation.
Which year groups study graphing inequalities?
Graphing inequalities appears in the KS4 curriculum, making these worksheets suitable for Year 10 and Year 11 students. The topic builds on students' prior knowledge of plotting straight-line graphs and solving linear inequalities algebraically, both introduced at KS3. At GCSE level, students must demonstrate competence in representing inequalities visually and identifying solution regions.
The worksheets cater to both Foundation and Higher tier GCSE students, though the complexity varies. Foundation tier focuses on plotting individual linear inequalities and shading correct regions, whilst Higher tier extends to systems of inequalities and may incorporate more complex boundary lines. These resources support revision throughout Year 11 and provide structured practice during initial teaching in Year 10.
How do you identify which region to shade on an inequality graph?
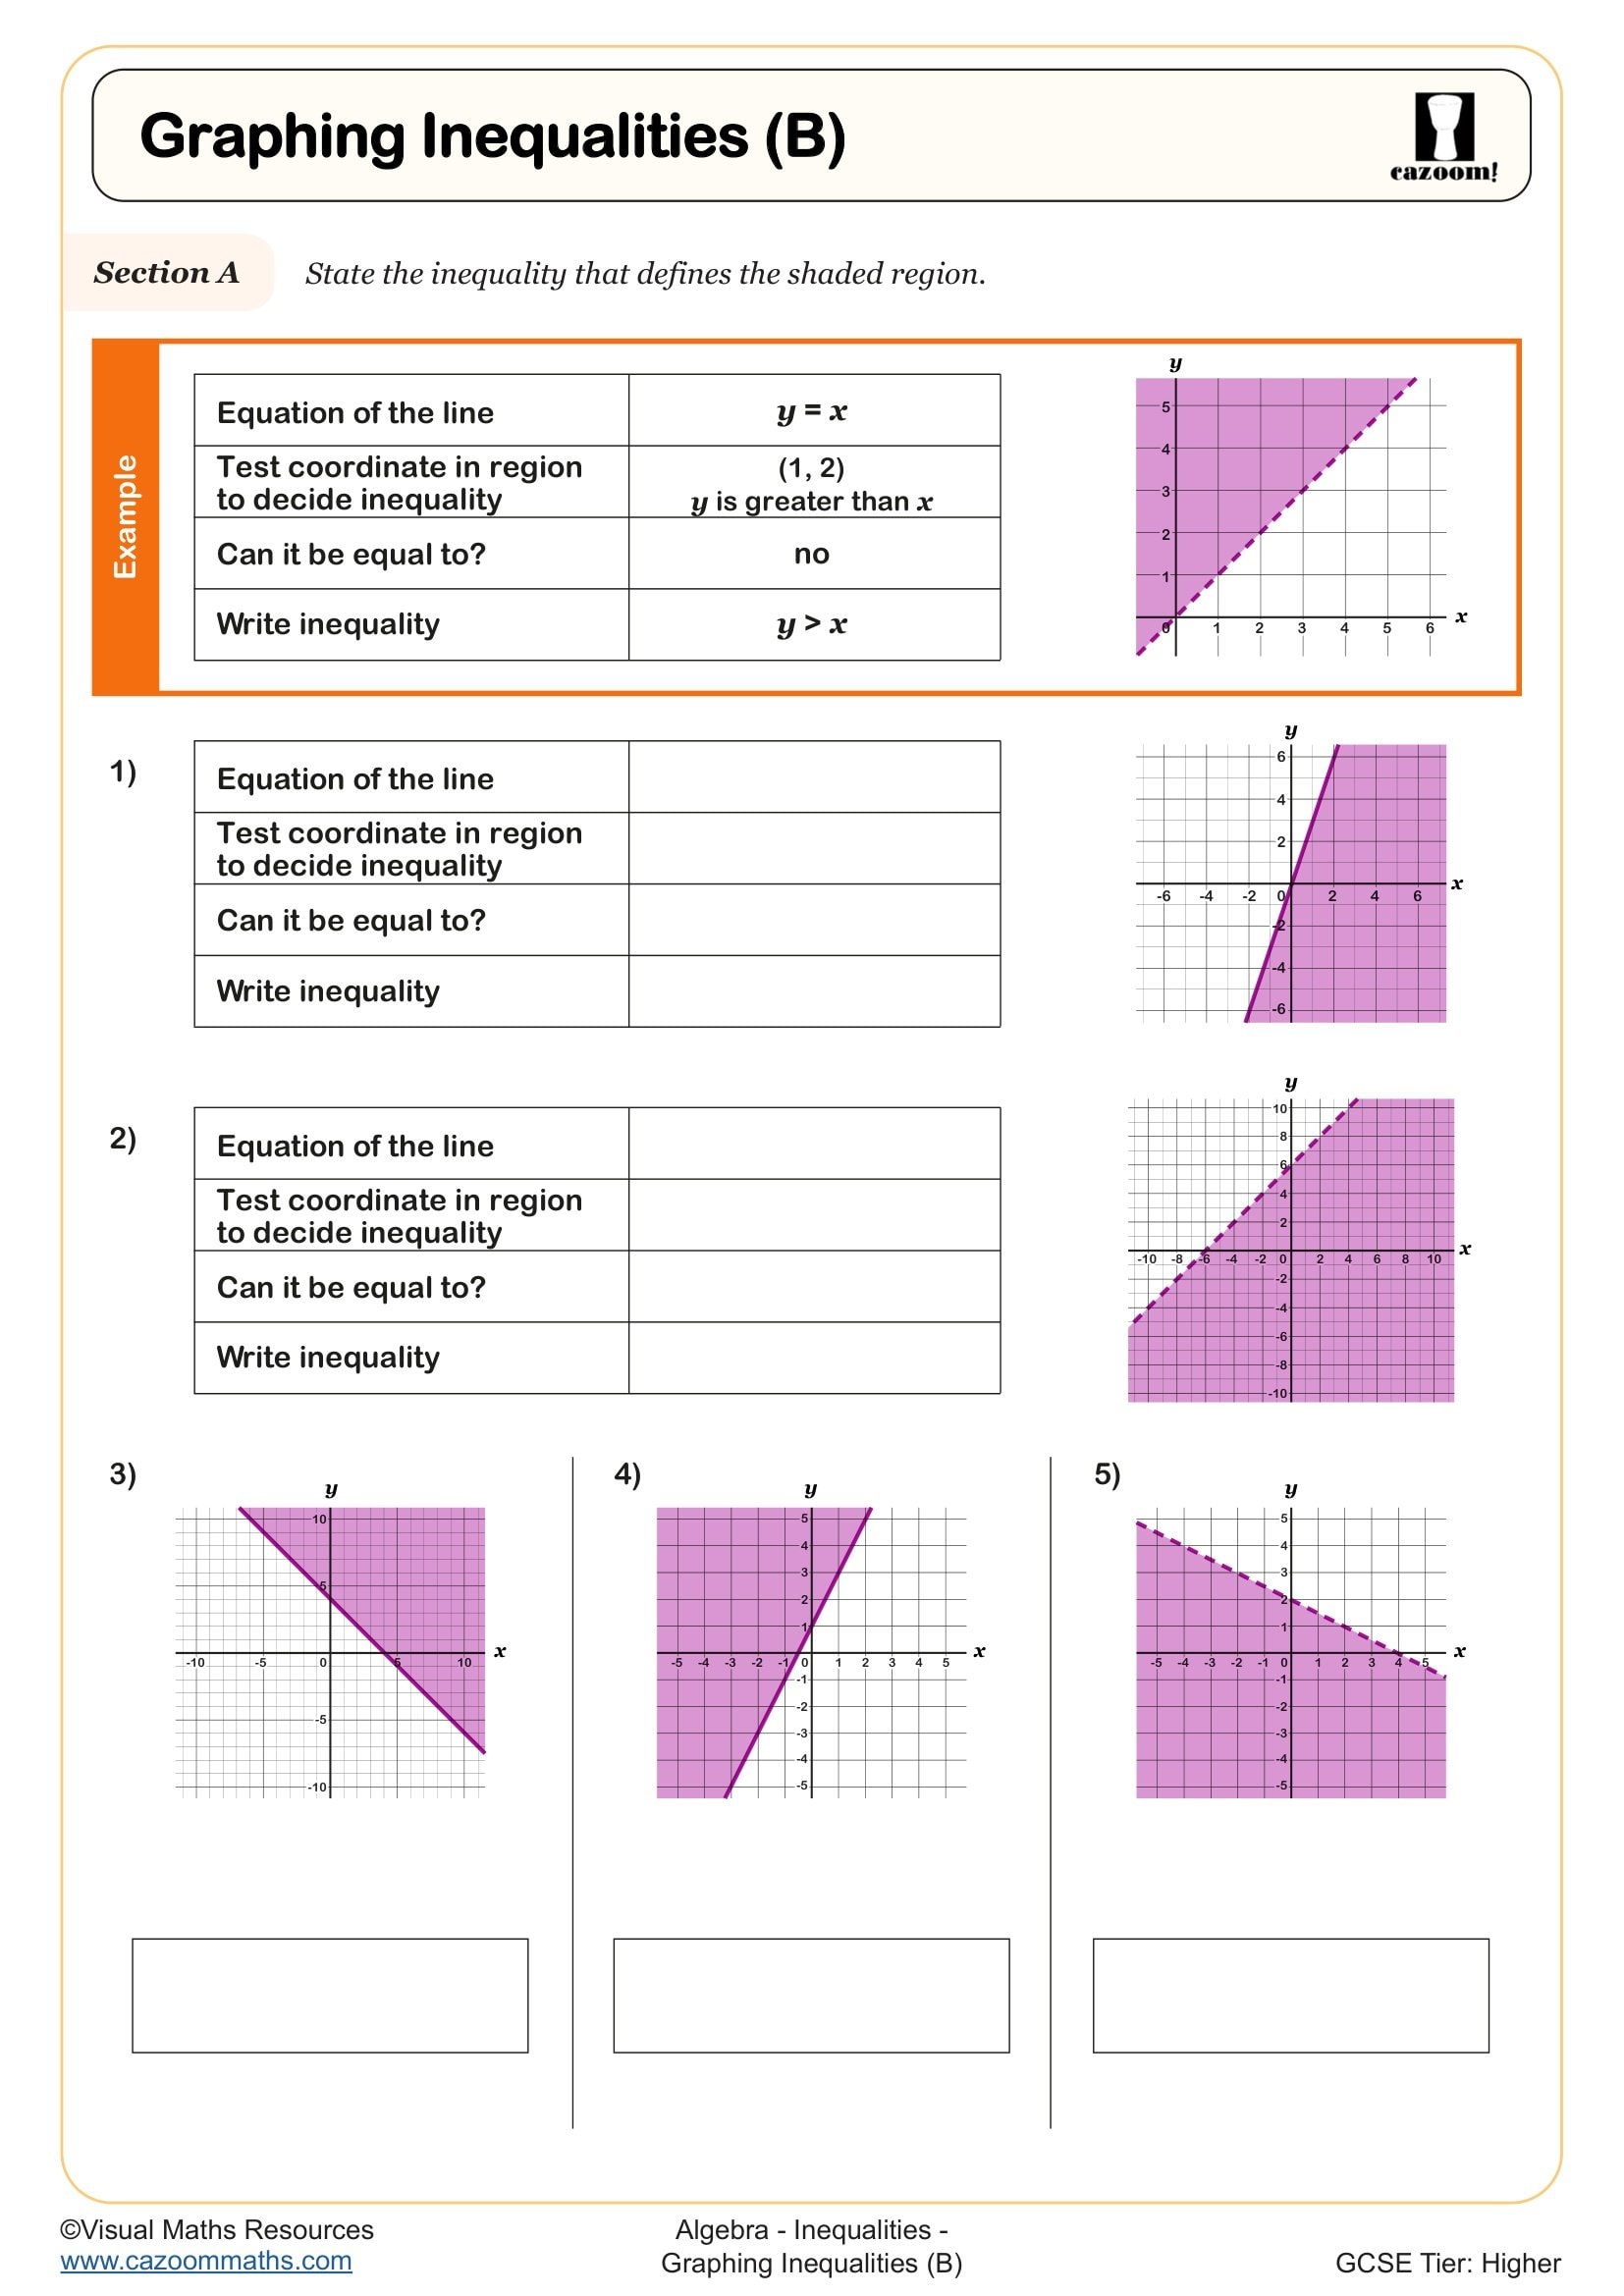
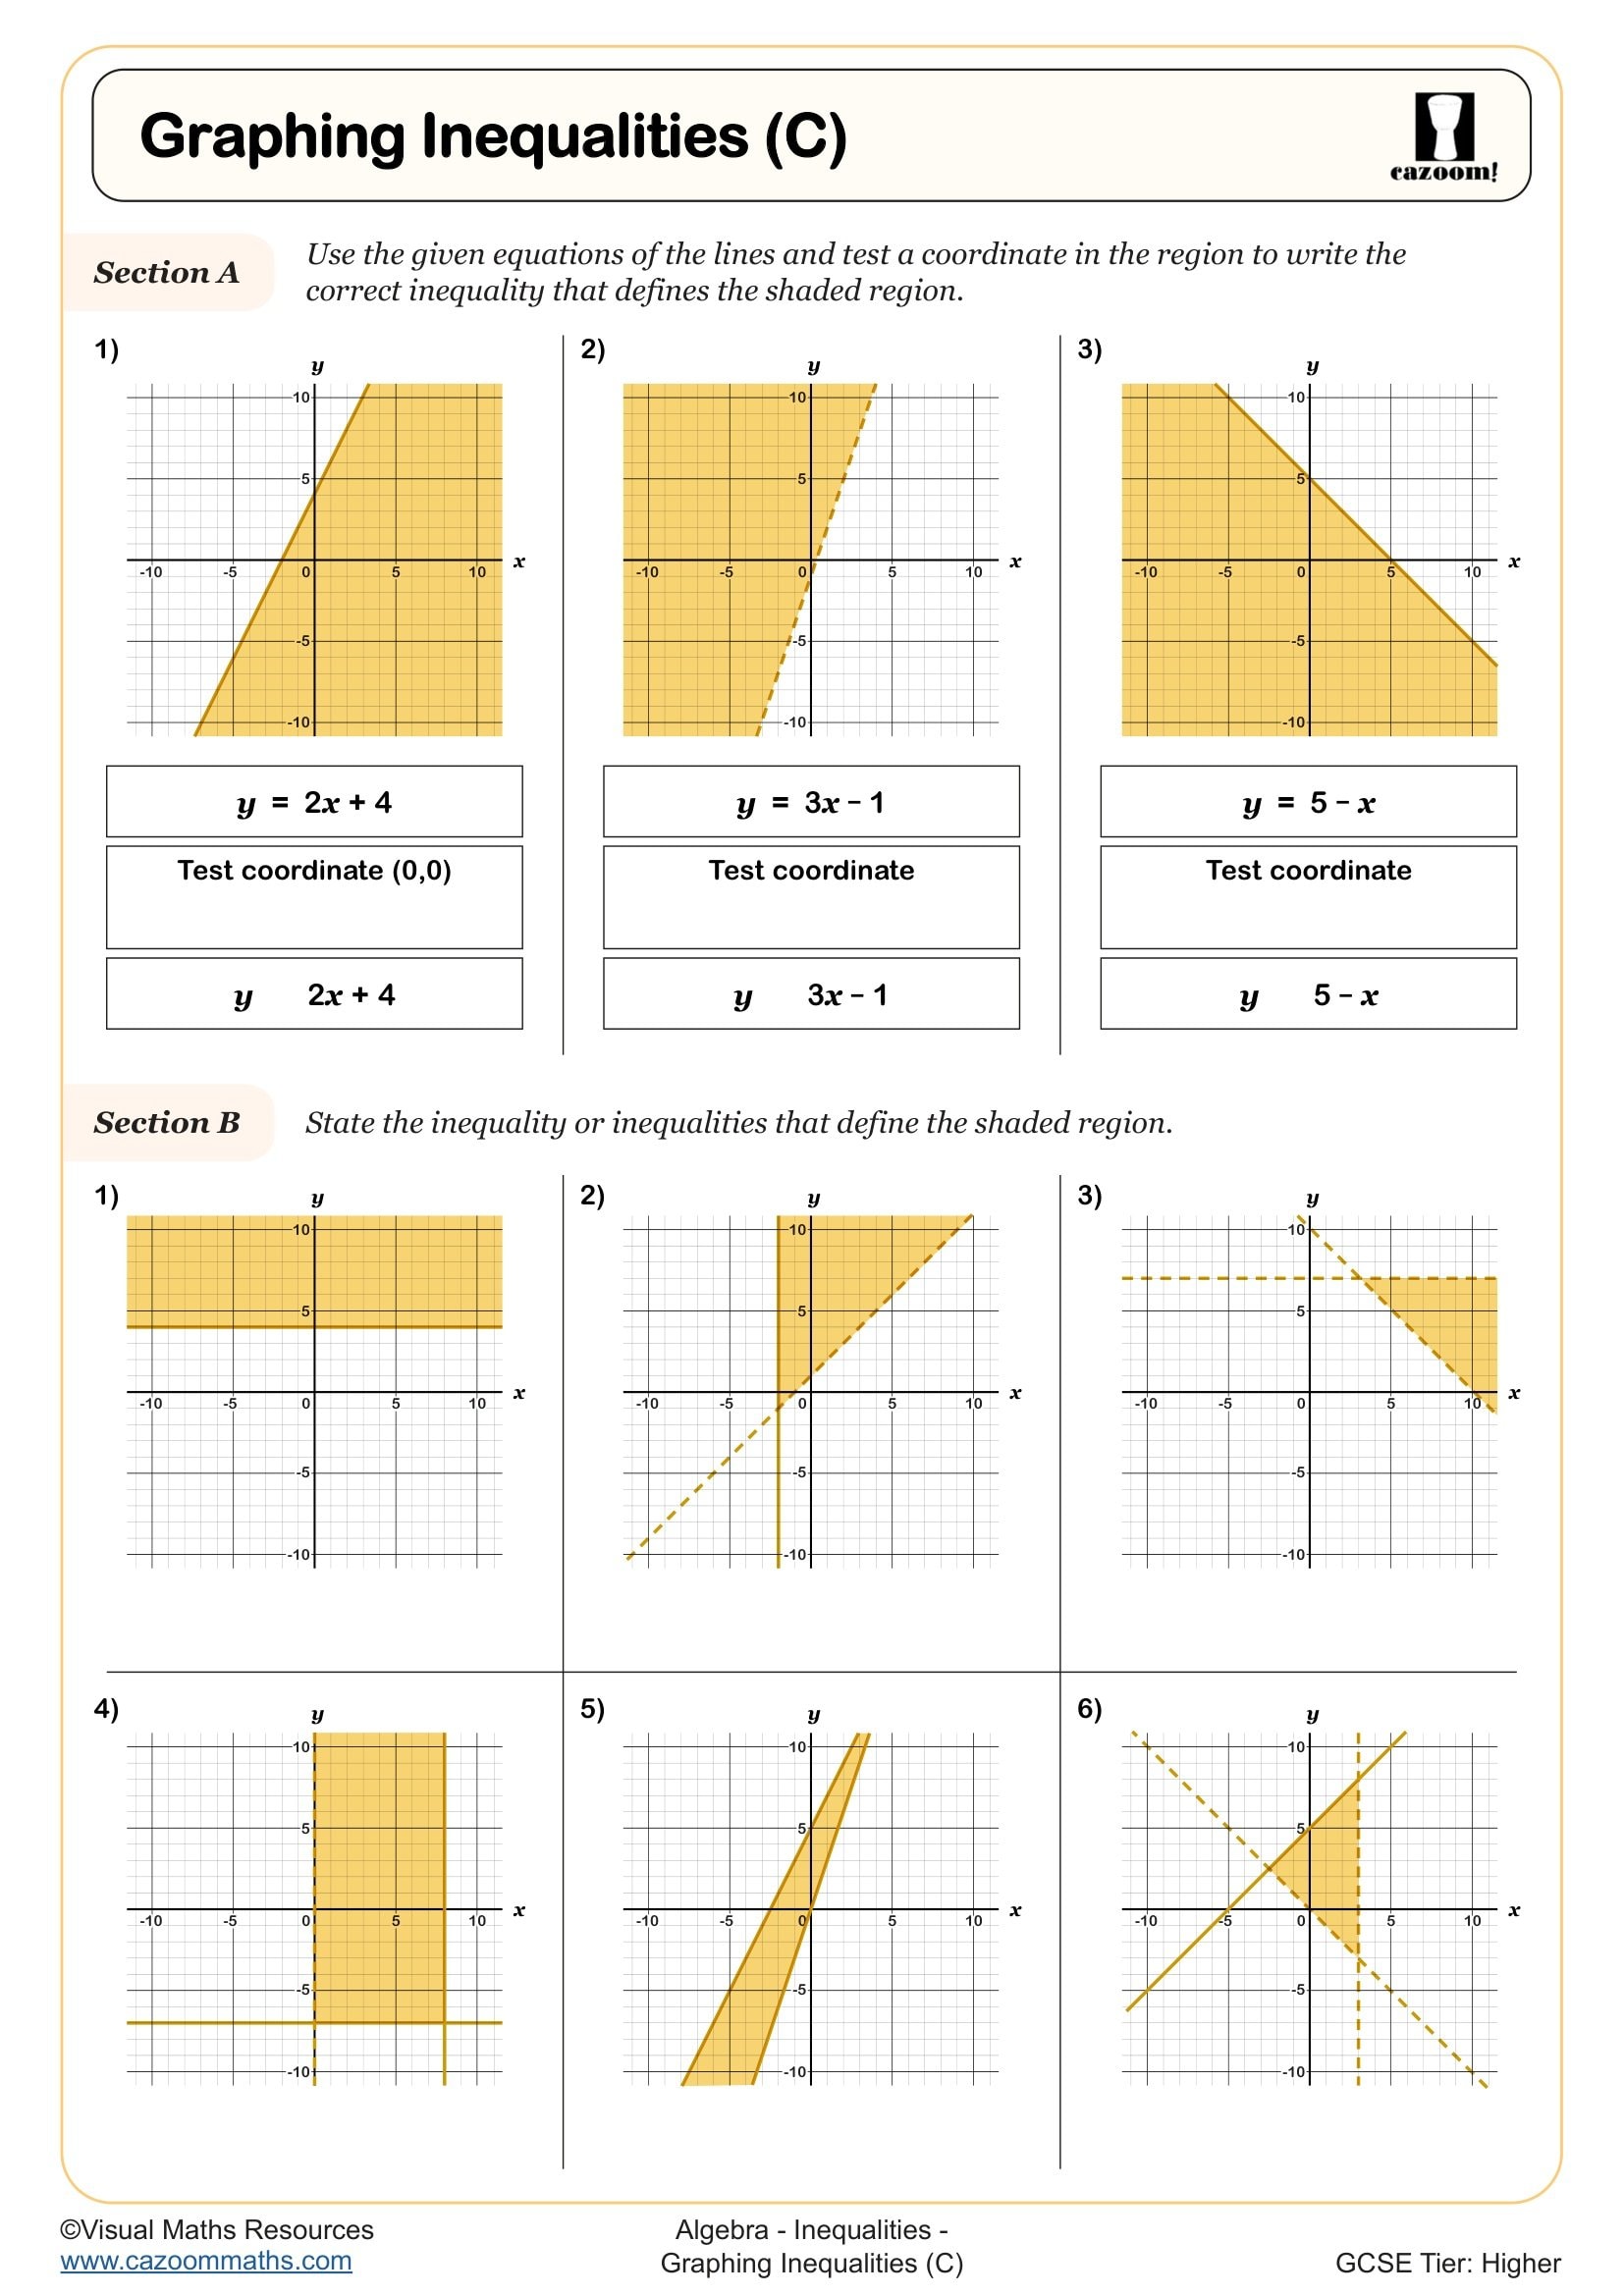
Determining the correct region to shade requires systematic checking. Students first plot the boundary line by temporarily treating the inequality as an equation. They then select a test point not on the line—typically (0,0) if the line doesn't pass through the origin—and substitute these coordinates into the original inequality. If the inequality holds true, the region containing that test point should be shaded; if false, the opposite region is correct.
Our worksheets provide practice with this testing method across various inequality orientations. Students encounter inequalities where y is greater than an expression (shade above), less than an expression (shade below), and inequalities rearranged in different forms. Answer sheets clearly show shaded regions, allowing students to verify their understanding. This methodical approach prevents common errors and builds confidence in visual problem-solving required for GCSE examinations.
What's included with these graphing inequalities worksheets?
Each worksheet downloads as a PDF containing carefully structured questions that progress in difficulty. Students work through plotting boundary lines, determining line styles, and shading appropriate regions across grid-based coordinate systems. Questions vary between those providing inequalities in standard form and those requiring rearrangement, ensuring comprehensive practice aligned with GCSE requirements.
Every worksheet includes a complete answer sheet displaying accurately drawn graphs with correct shading and clearly marked boundary lines. These visual answers help students identify where they've made errors—whether in plotting, line style selection, or region identification. Teachers can use answer sheets for quick marking whilst parents supporting home learning can confidently check work. The PDFs print clearly for classroom use or work equally well for digital distribution via learning platforms.