Year 10 Real Life Graphs Worksheets
All worksheets are created by the team of experienced teachers at Cazoom Maths.
Premium PDF Worksheets with Complete Answer Keys
Our huge variety of mathematical resources, including real life line graphs, is professionally designed. Download Cazoom Maths algebra resources in ready-to-print, PDF format with detailed and separate answer sheets right away to help your pupils get the extra help they need. Your secondary school students receive immediate feedback through comprehensive answer guides. Each worksheet follows UK curriculum standards for functions GCSE questions.
Essential Skills Covered in These Real Life Graph Worksheets
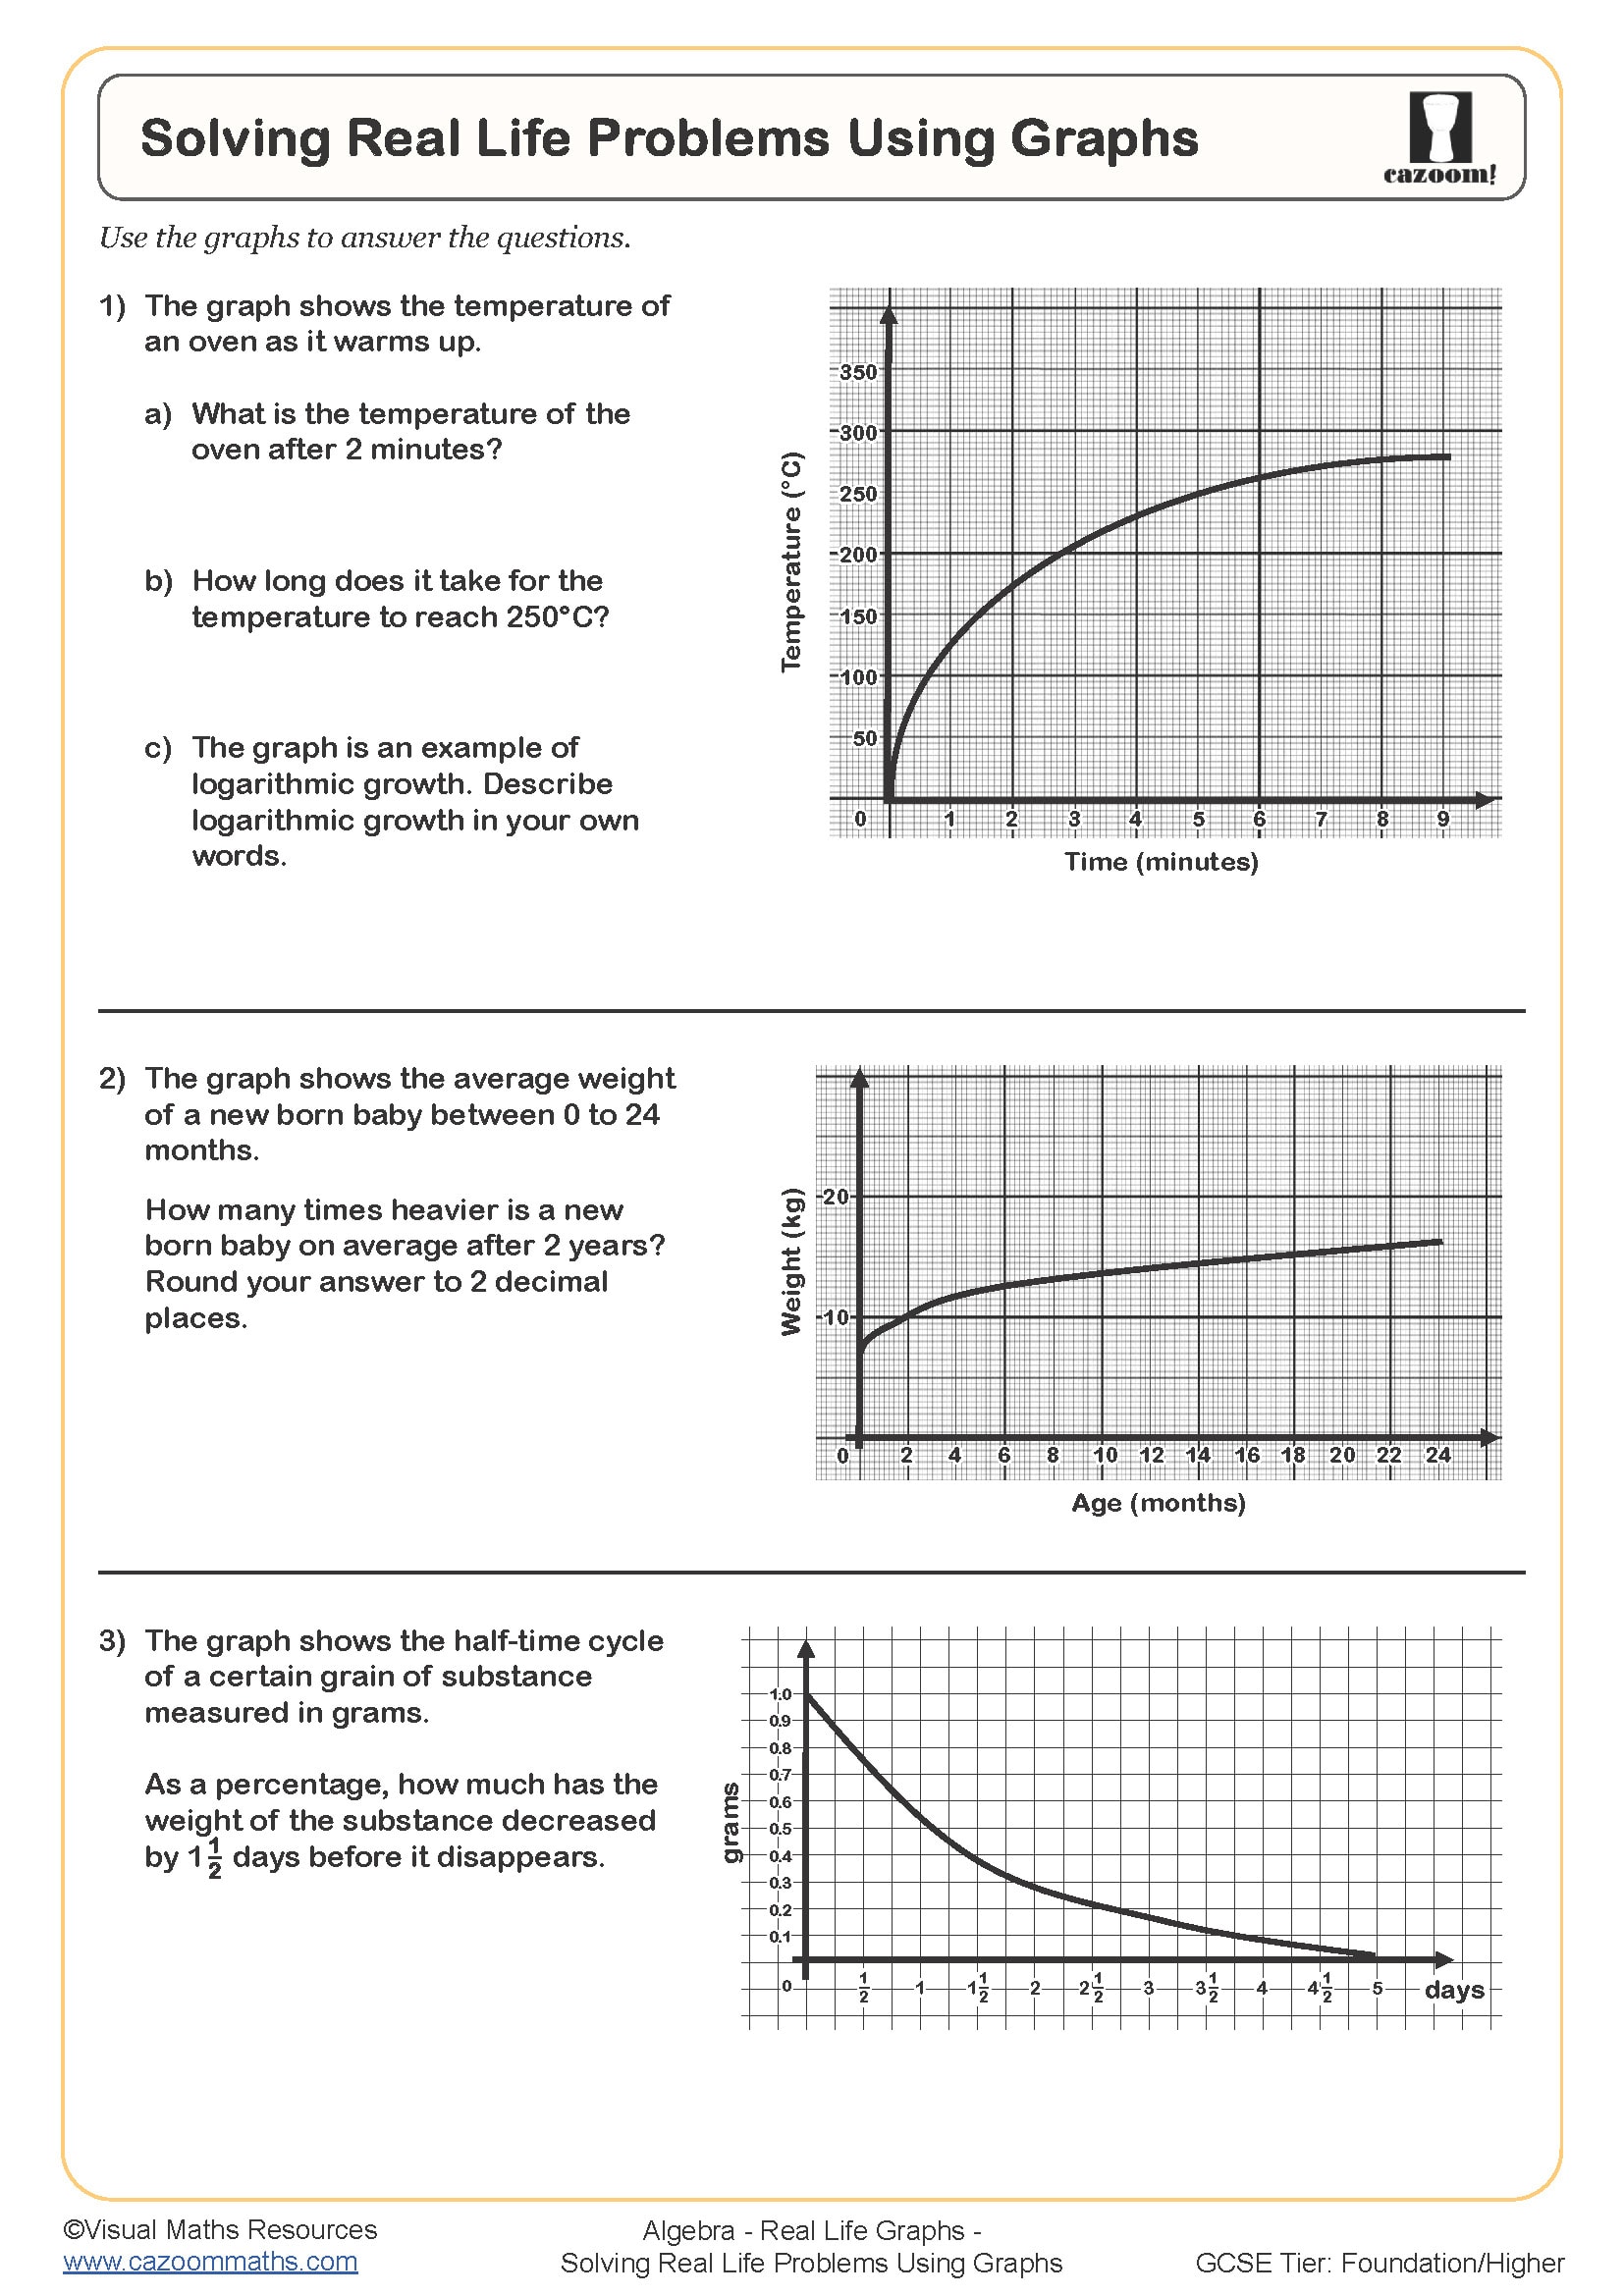
The core idea of the key algebra topic, like Real-life graphs, is to show mathematical relationships using situations from everyday life, like plotting how far you've travelled over time during a car journey or tracking how much water fills up in a bathtub. Instead of just drawing abstract lines and curves, your students work with scenarios they actually recognise, making maths feel relevant and much easier to understand.
Our real life line graphs include concepts like,
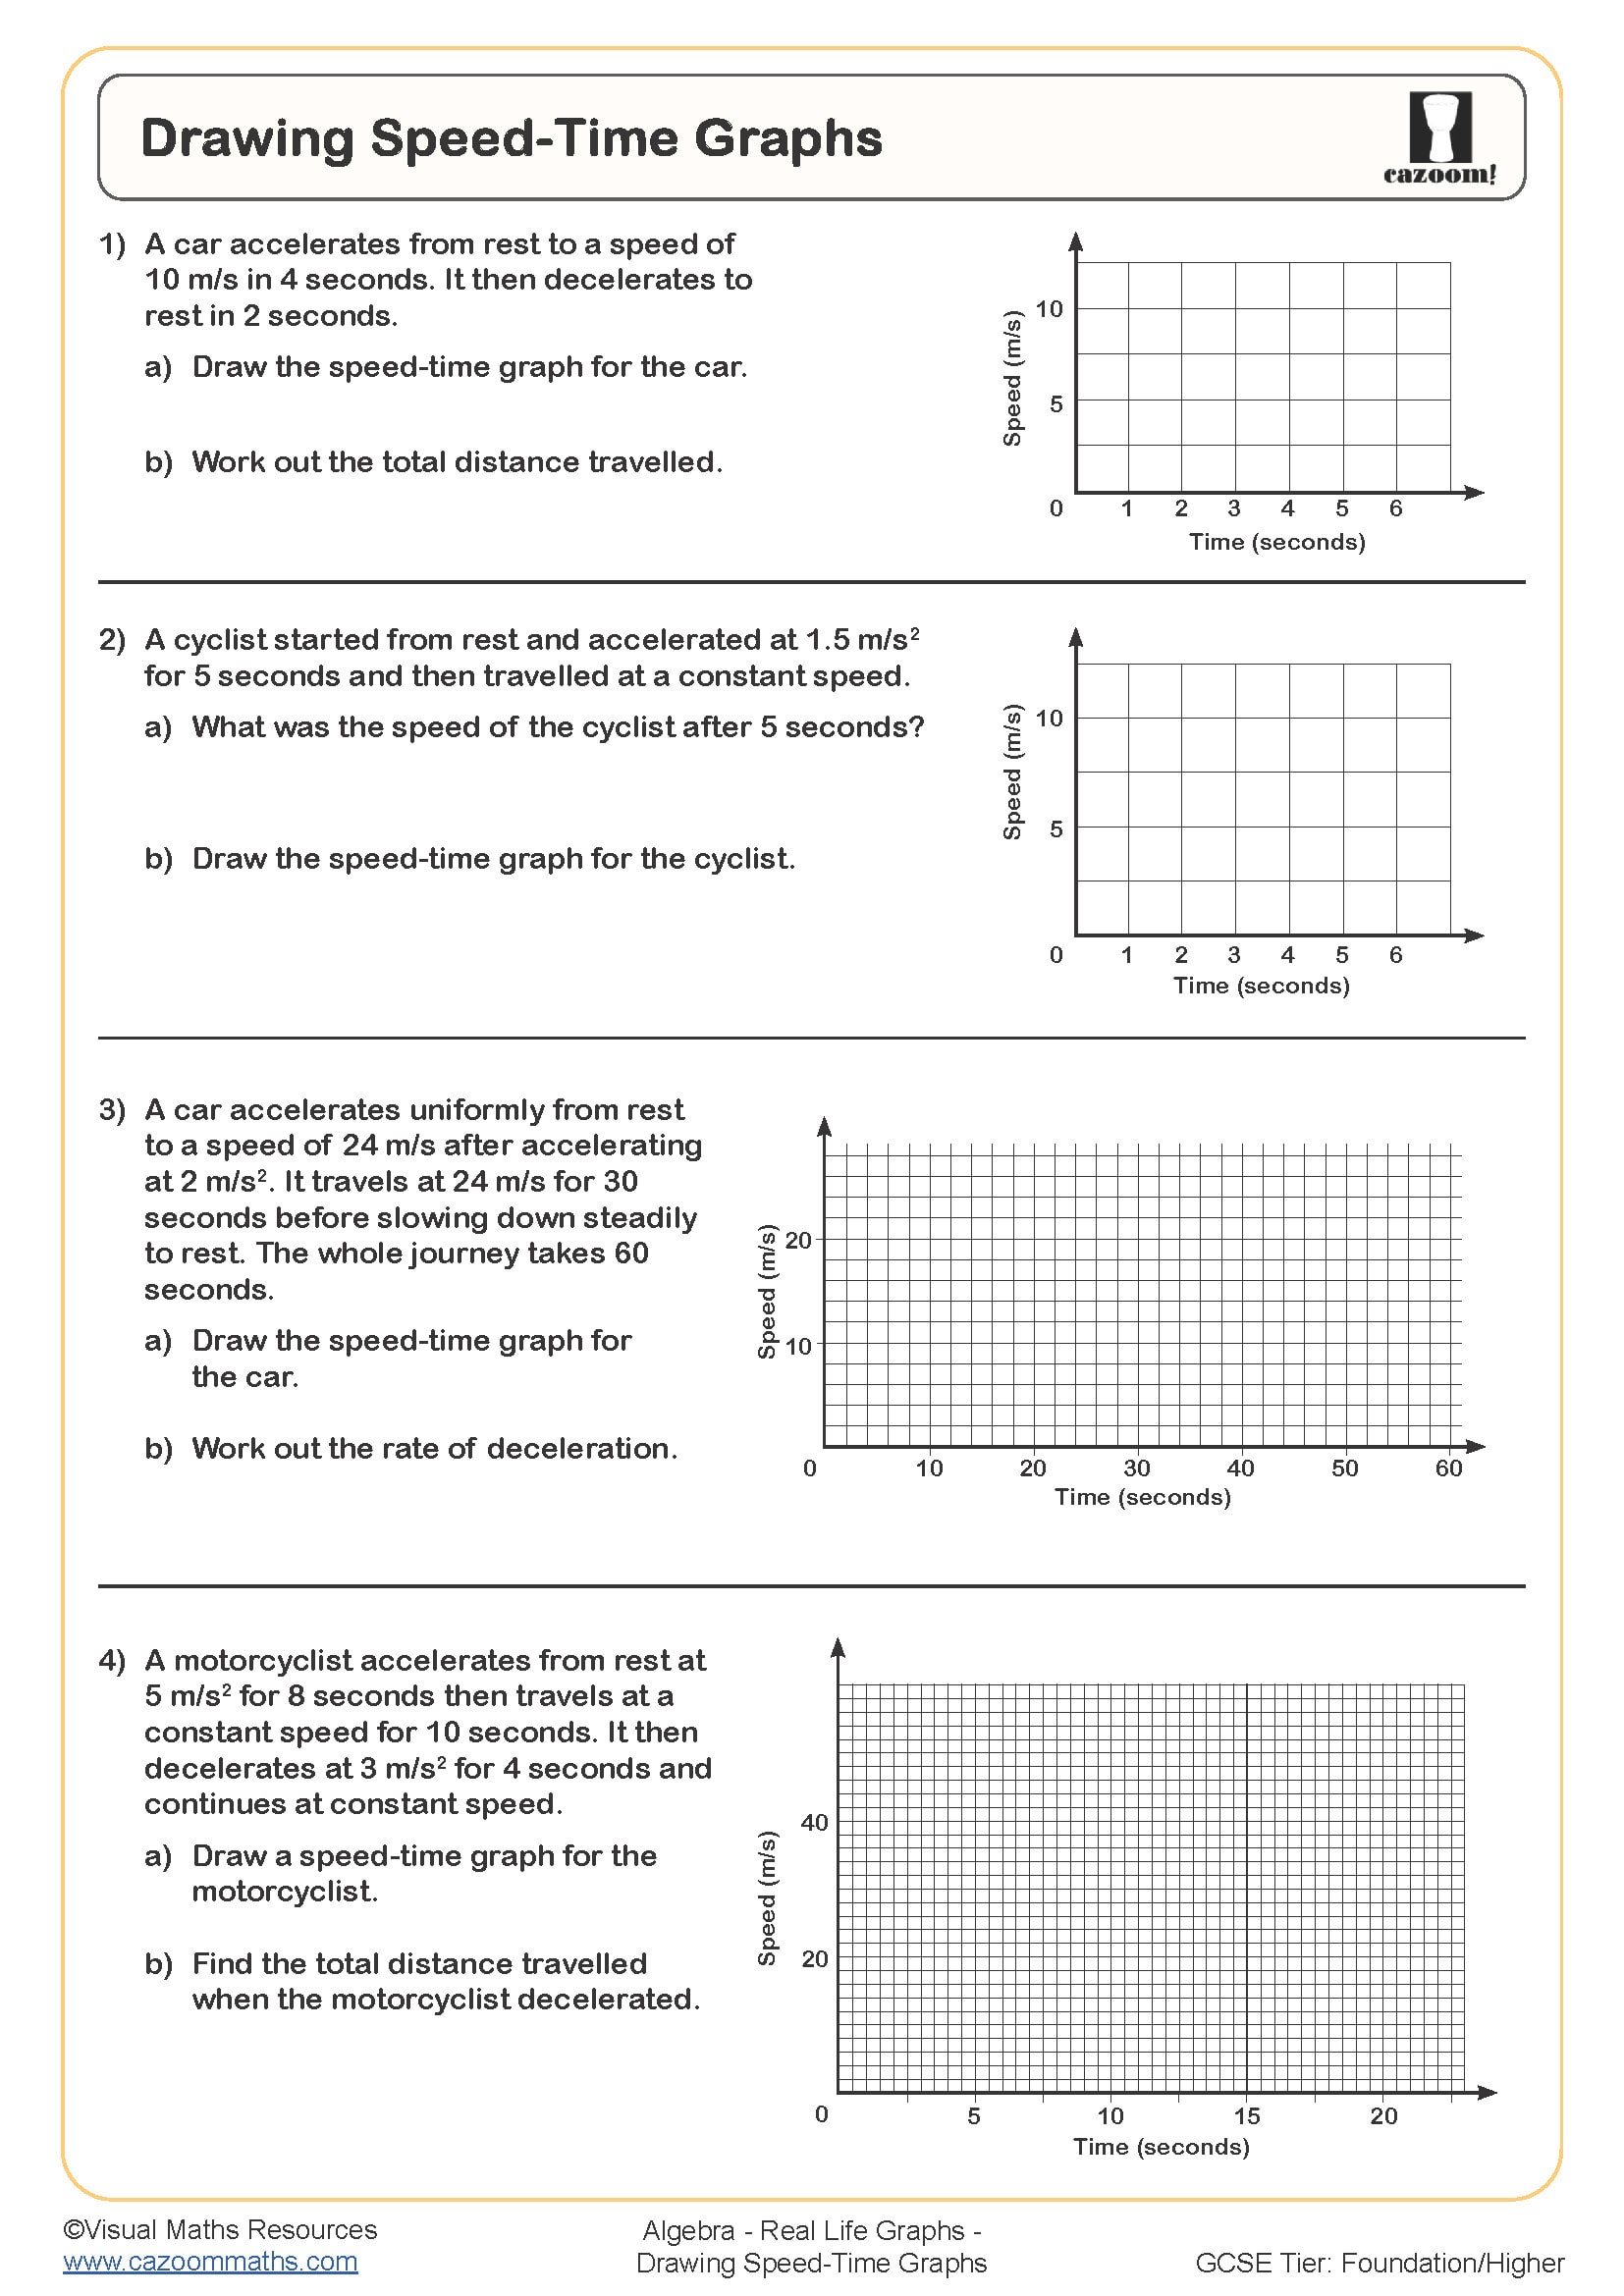
• Distance-time graph interpretation and drawing
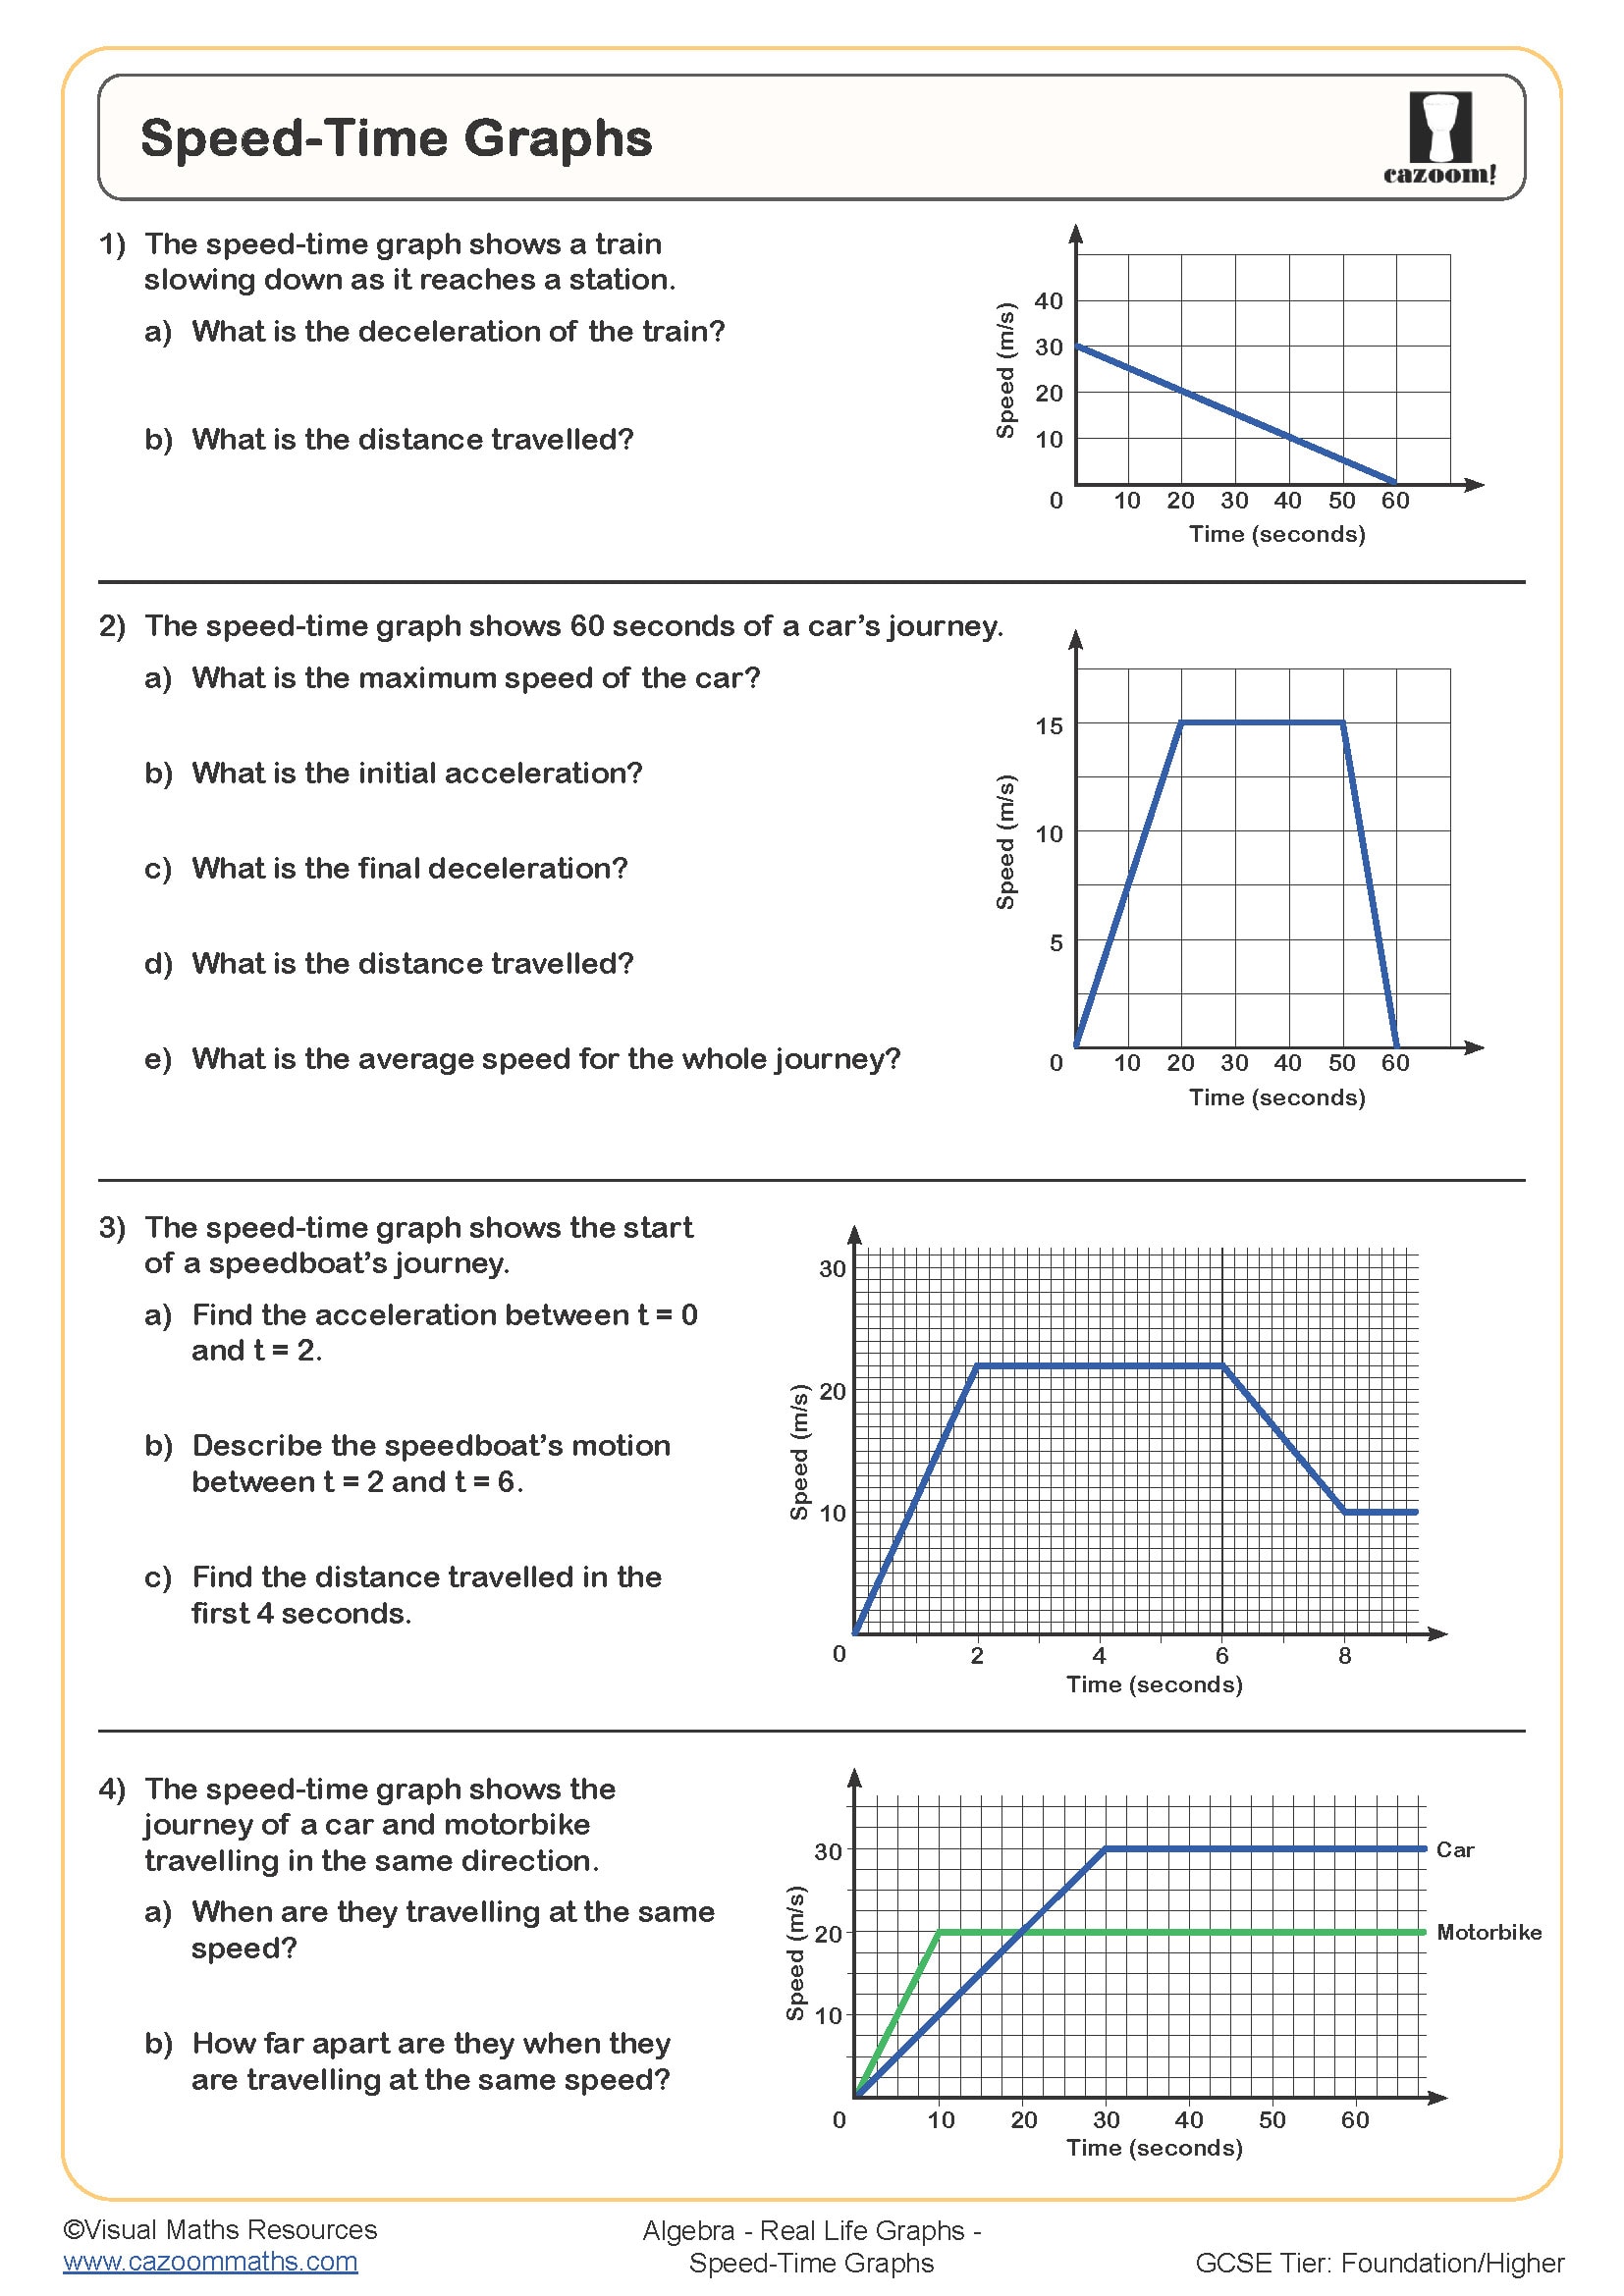
• Speed and velocity calculations from real graphs
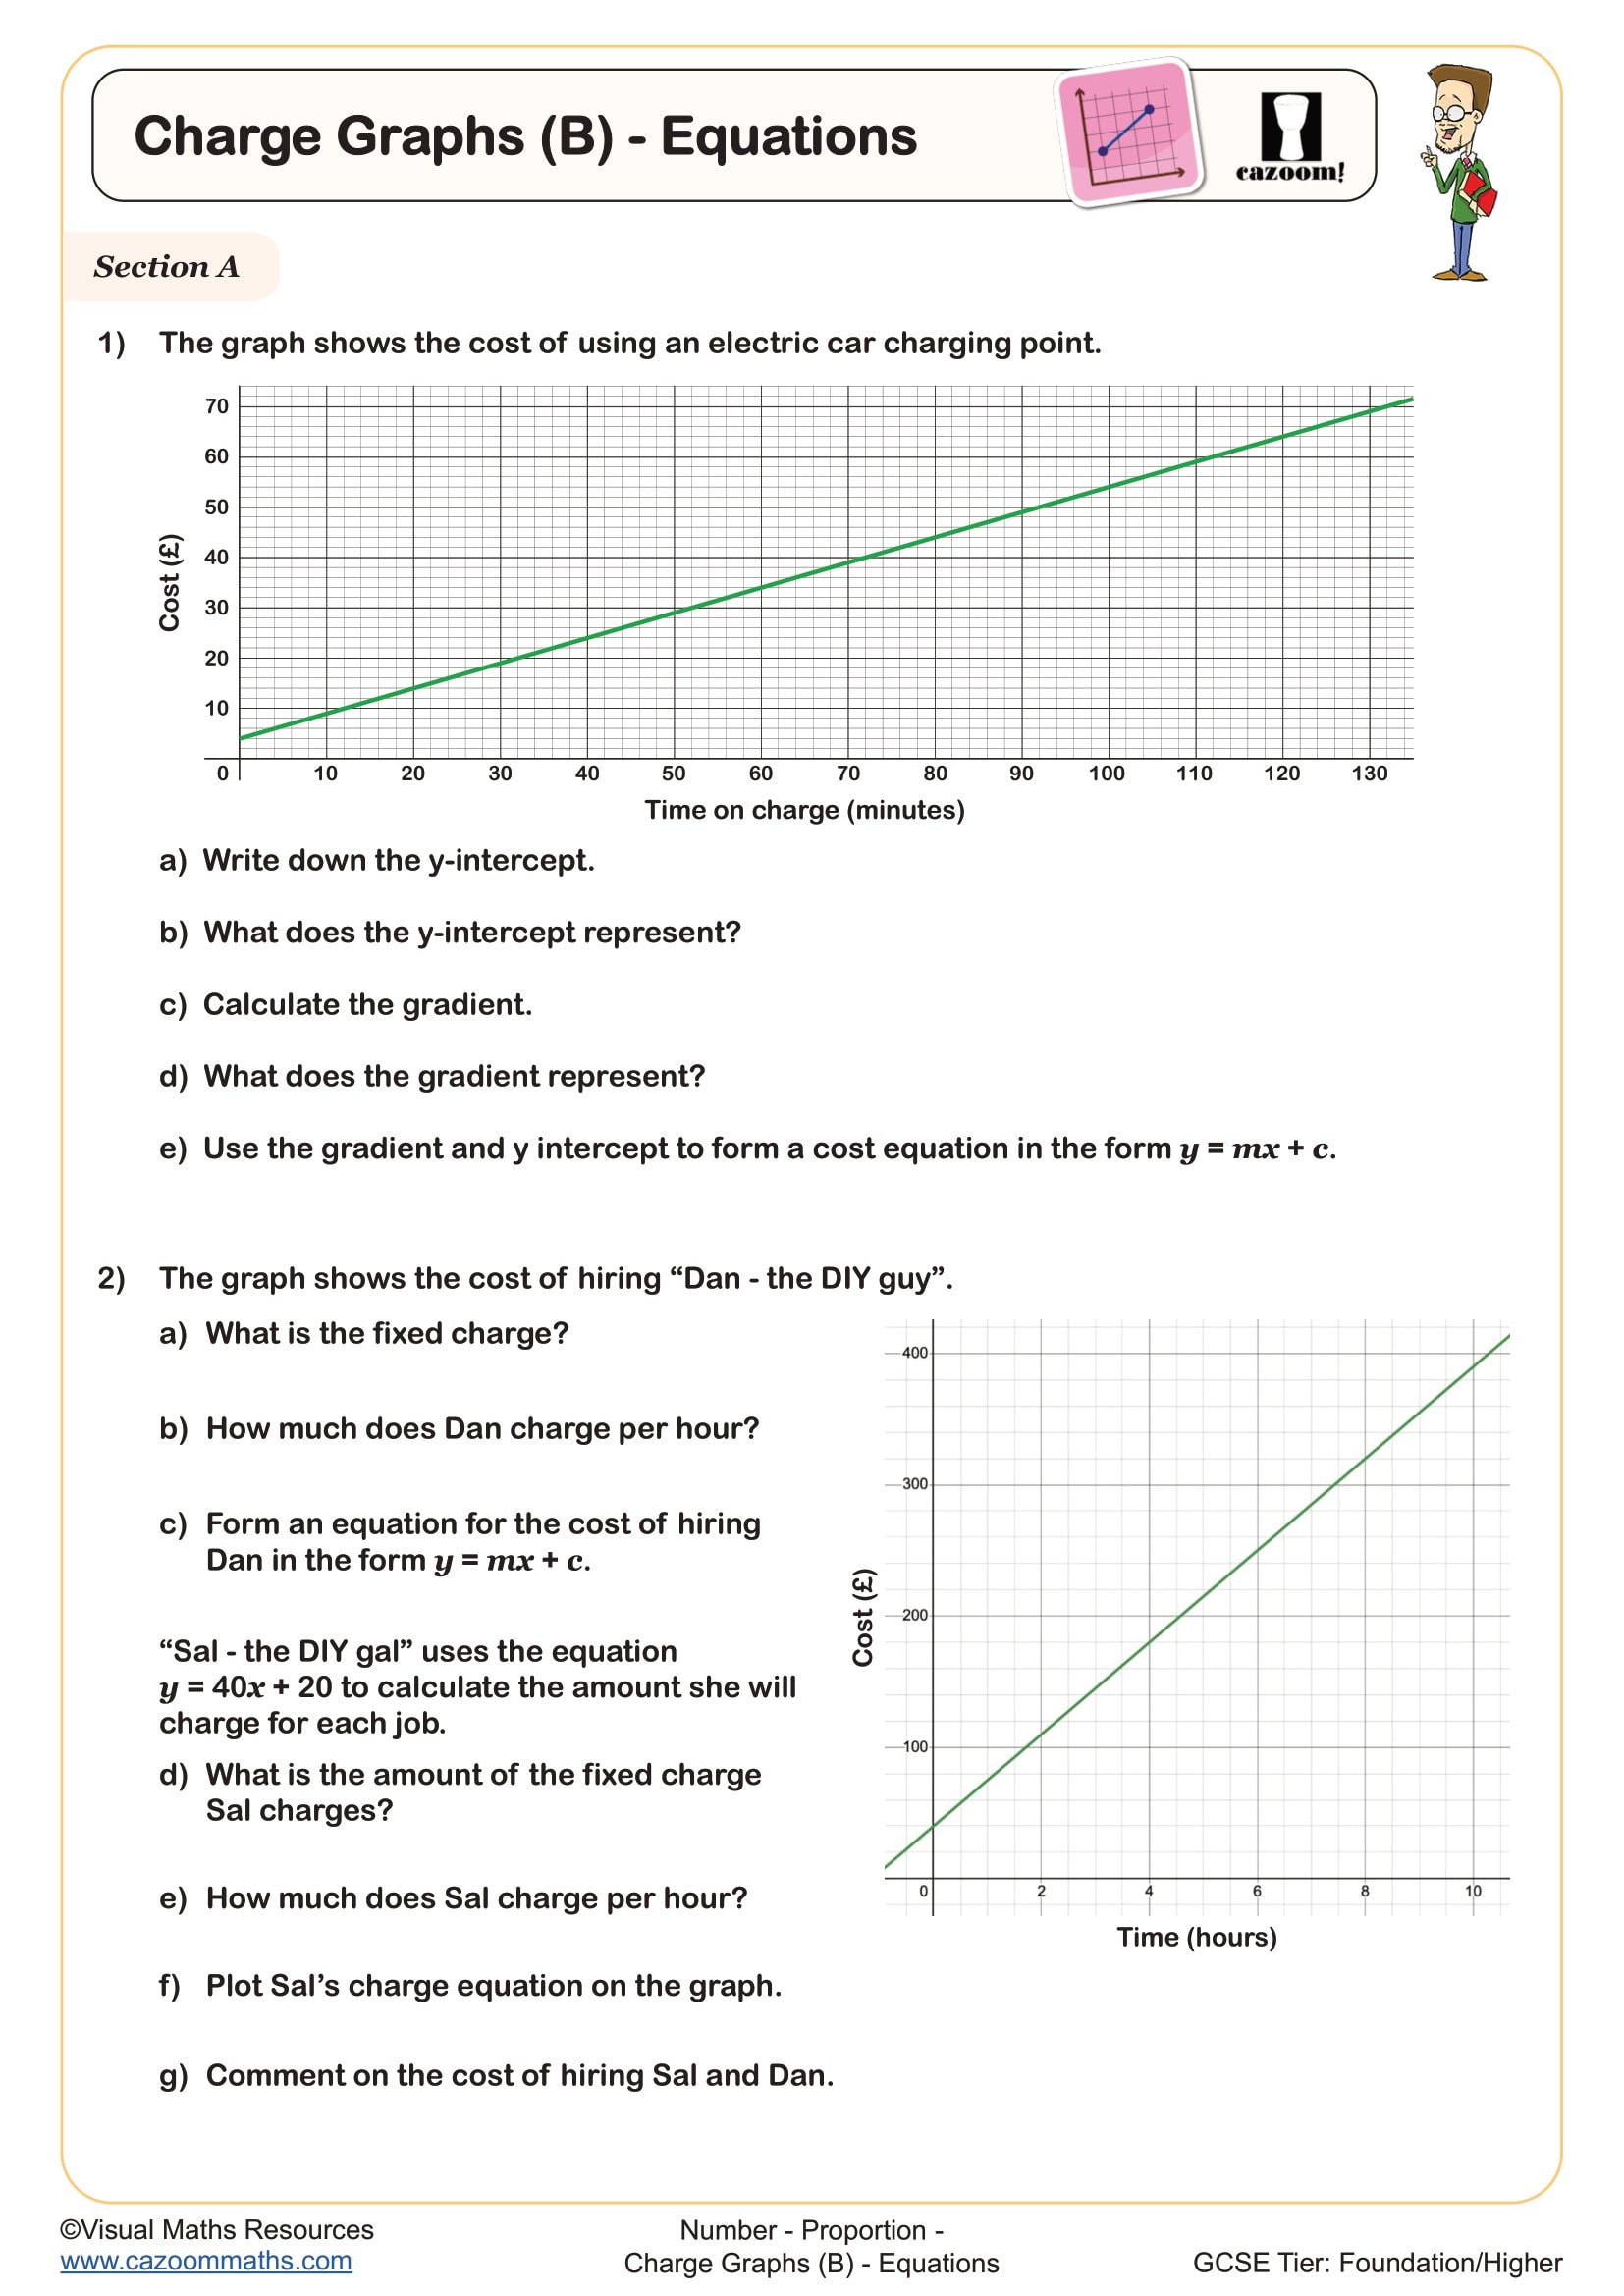
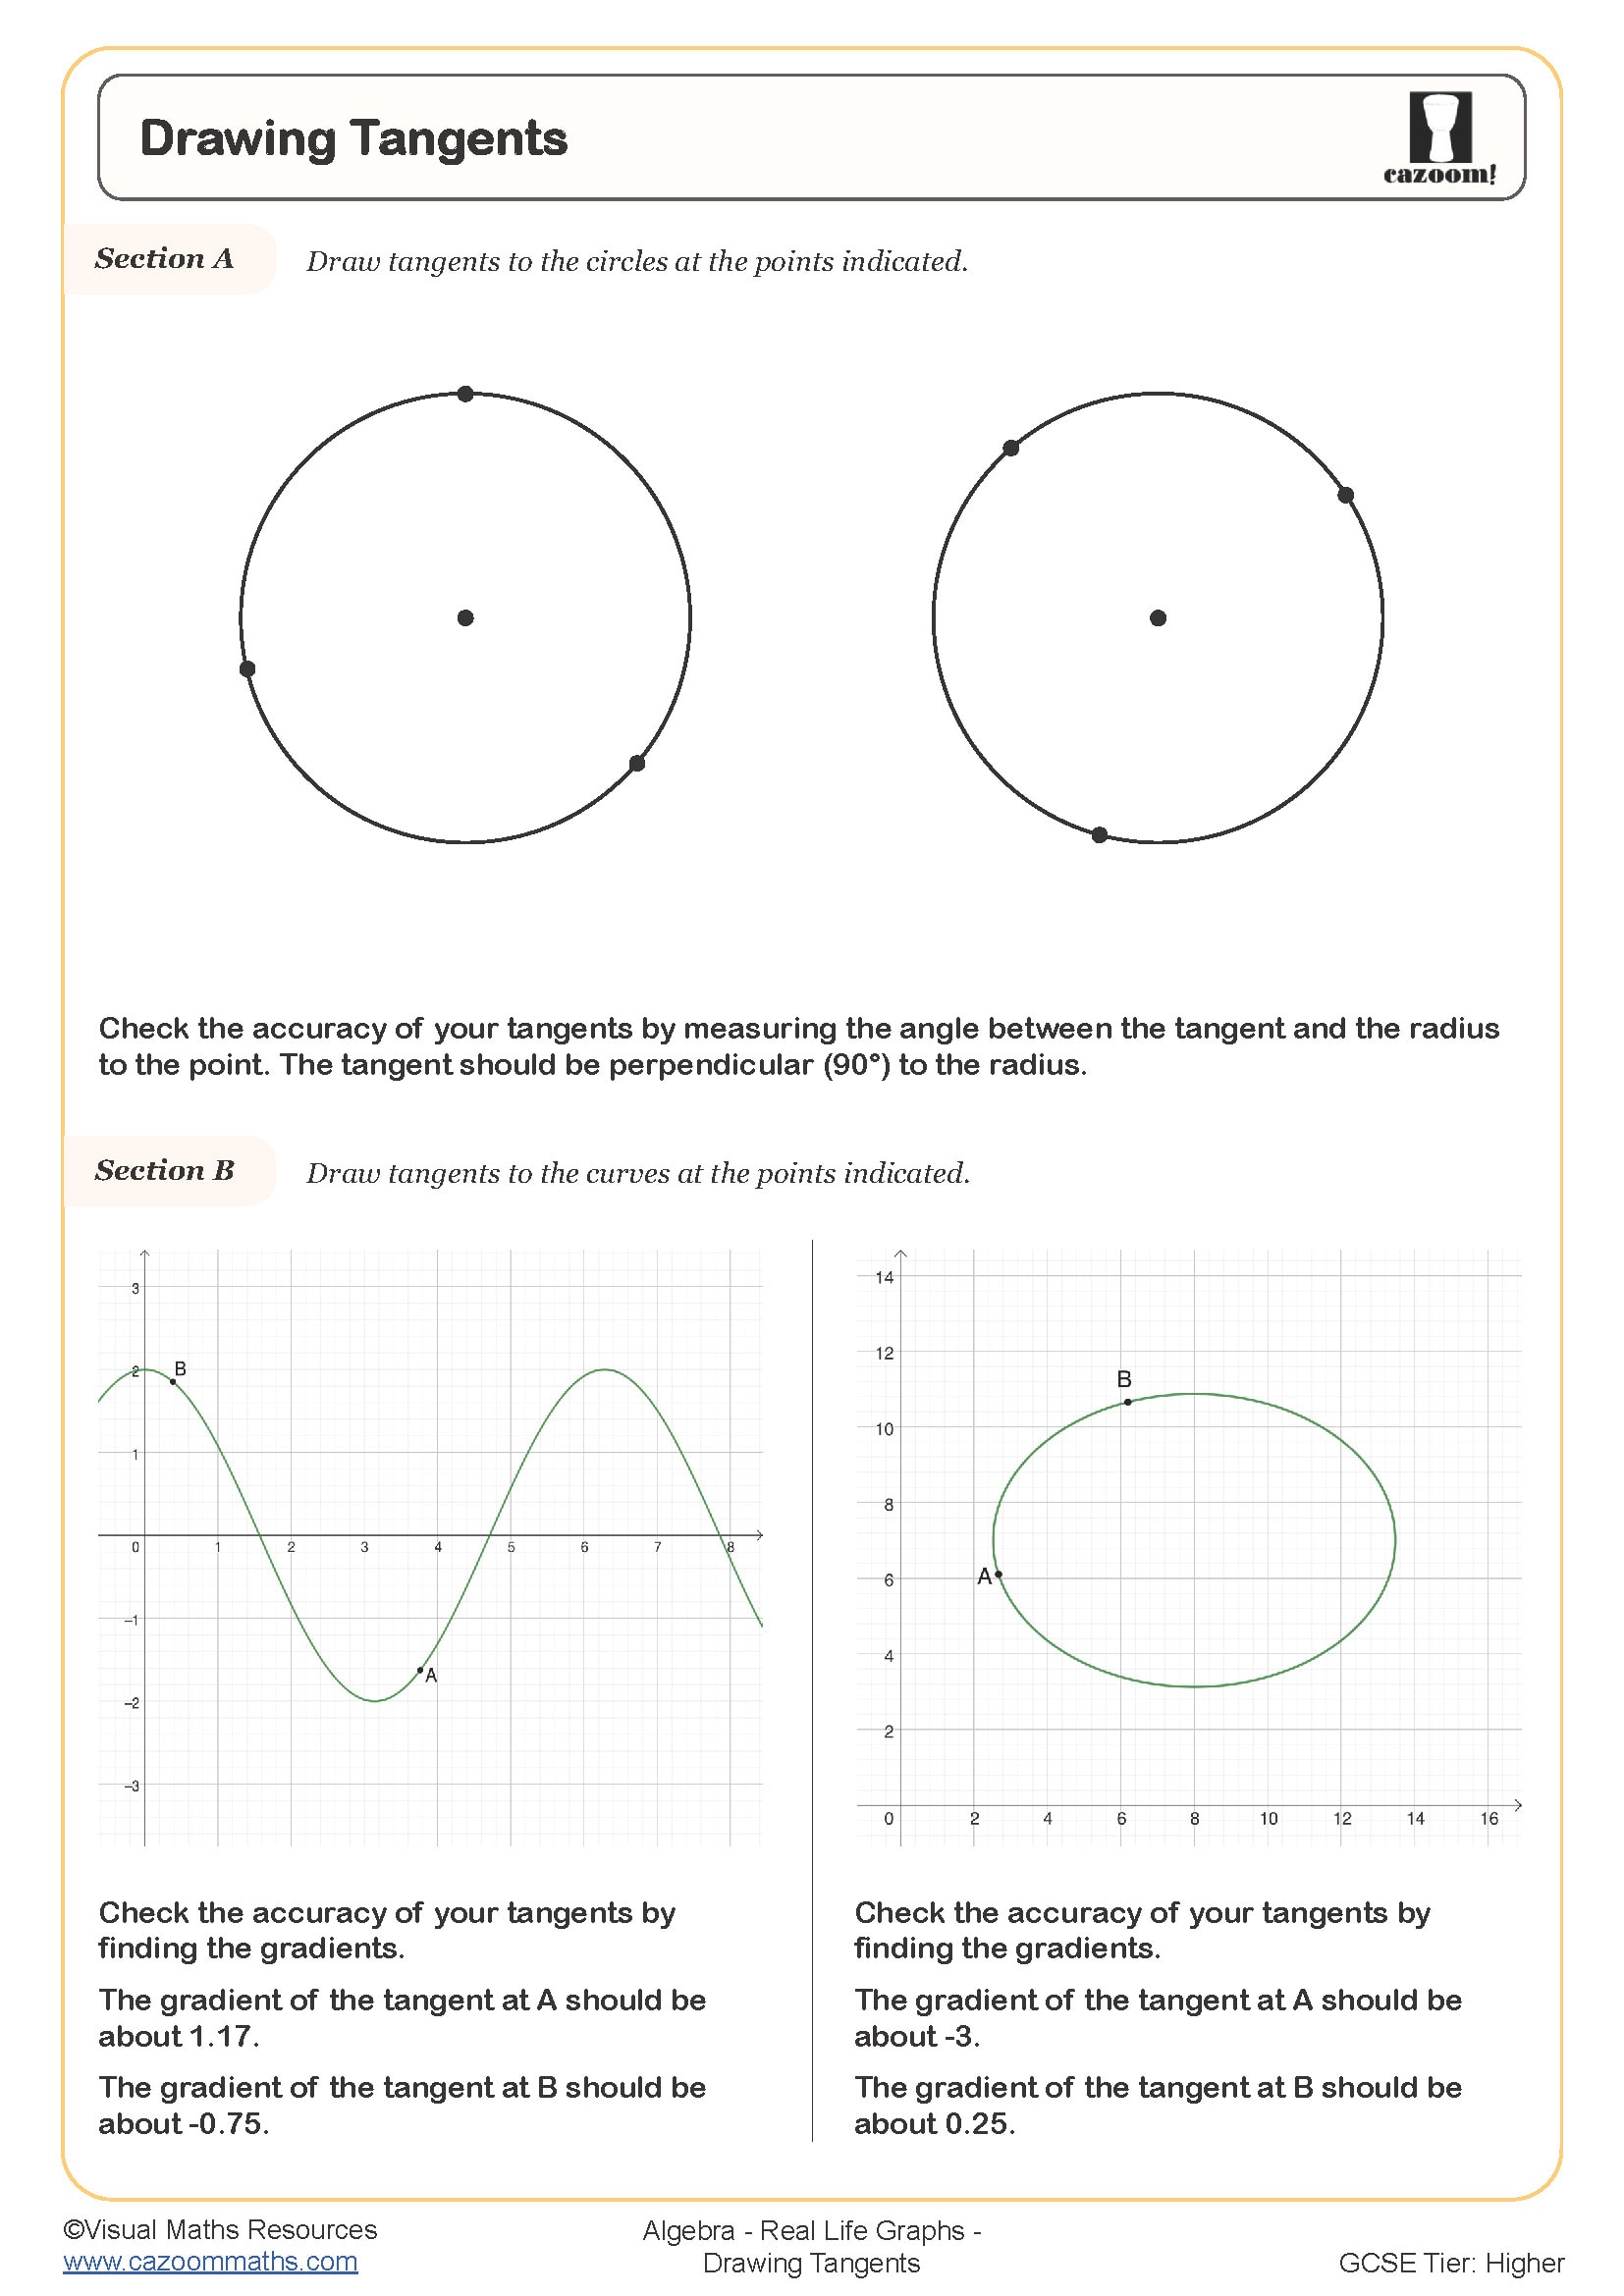
• Gradient analysis for rate of change problems
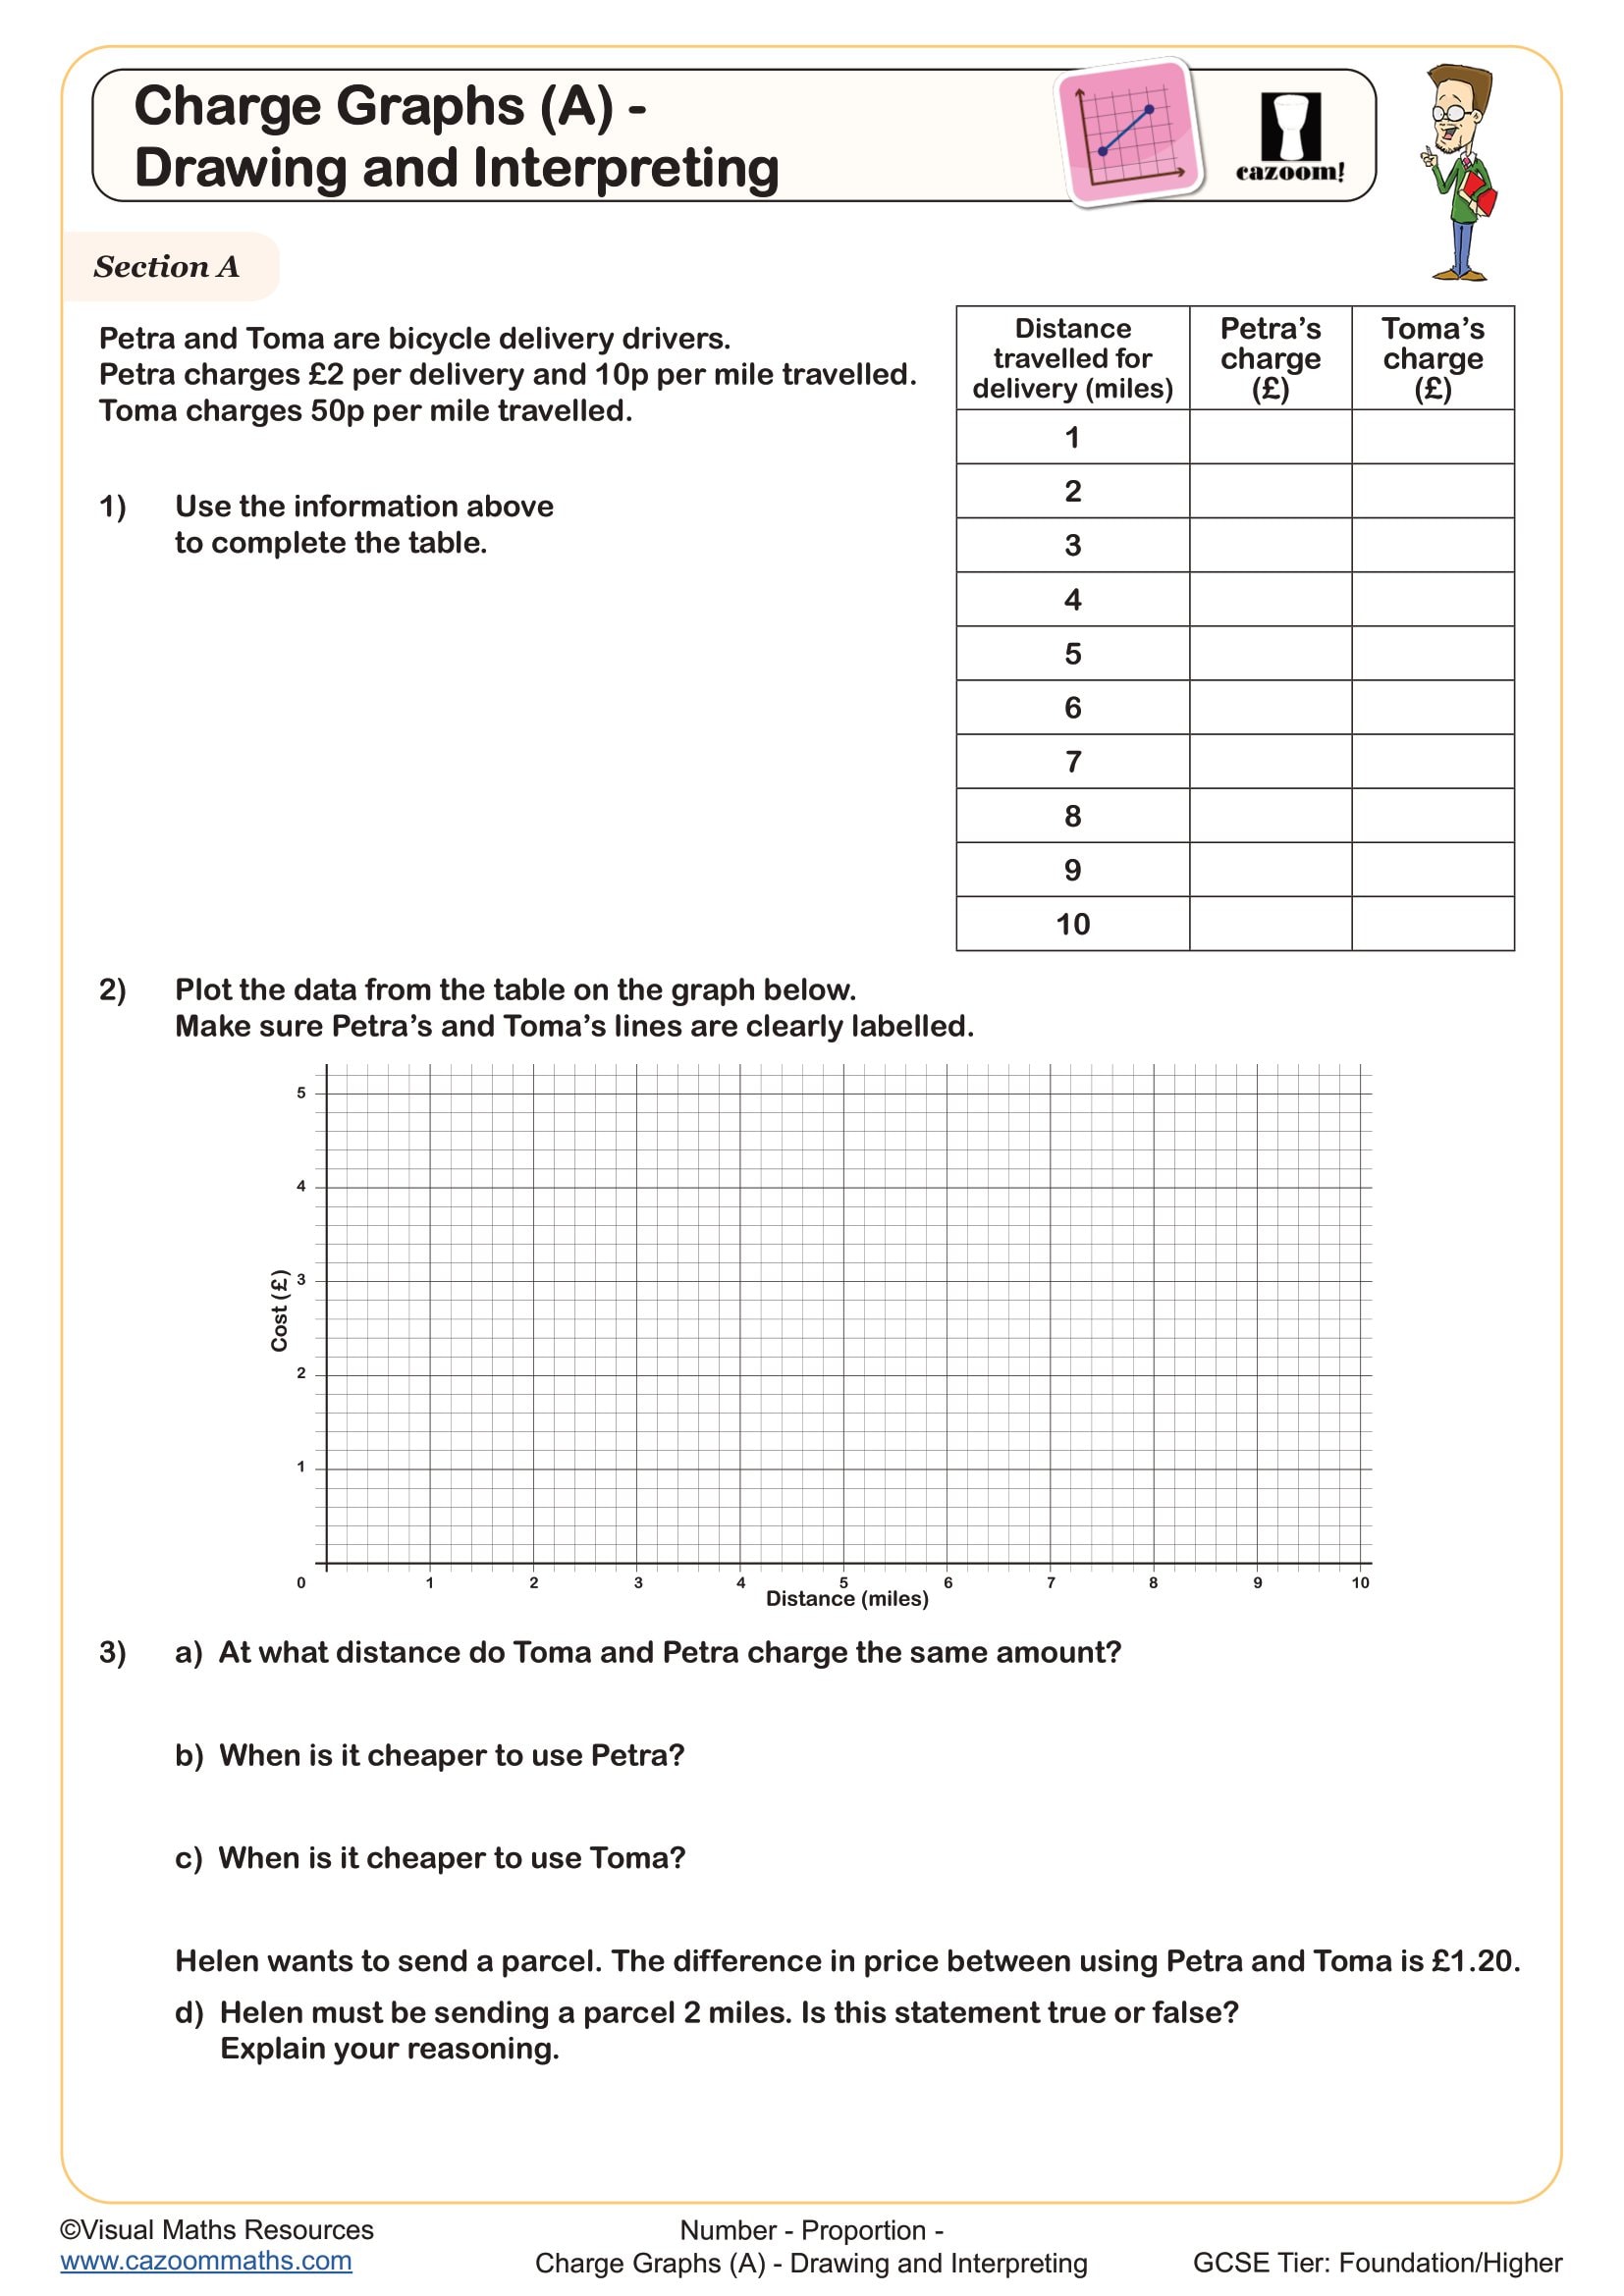
• Cost relationship graphs and linear functions
• Volume-time and capacity scenarios
Perfect for GCSE Preparation and Classroom Success
Year 10 marks the crucial transition to GCSE exam prep. Our real life graphs worksheet collection builds essential foundation skills that your young learners need for higher-level mathematics. Regular practice with these interpreting real life graphs worksheet resources ensures students feel confident approaching exam-style real life graph questions.
Real-World Applications That Engage Students
Our real life line graphs bring maths to life through exciting scenarios that your students actually care about:
• Rocket launches and weather balloon descents that show speed changes over time
• Popcorn-making experiments where students track pops per minute
• Taxi fare calculations using gradient skills for real journeys
• Fuel cost analysis comparing petrol and diesel prices
• Mountain bike hire charges that change based on rental time
• Mobile phone tariffs with different rate structures