Year 11 Real Life Graphs Worksheets
All worksheets are created by the team of experienced teachers at Cazoom Maths.
Master Real Life Graph Analysis with Expert-Designed GCSE Worksheets
Finding quality real life graphs worksheets that actually engage Year 11 students isn't easy. We've created these resources after years of classroom testing, focusing on the exact skills students need for GCSE success. Each worksheet progresses logically from basic interpretation to complex analysis, with detailed solutions that show the thinking process behind every answer.
Essential Real Life Graph Skills Your Year 11 Students Will Develop
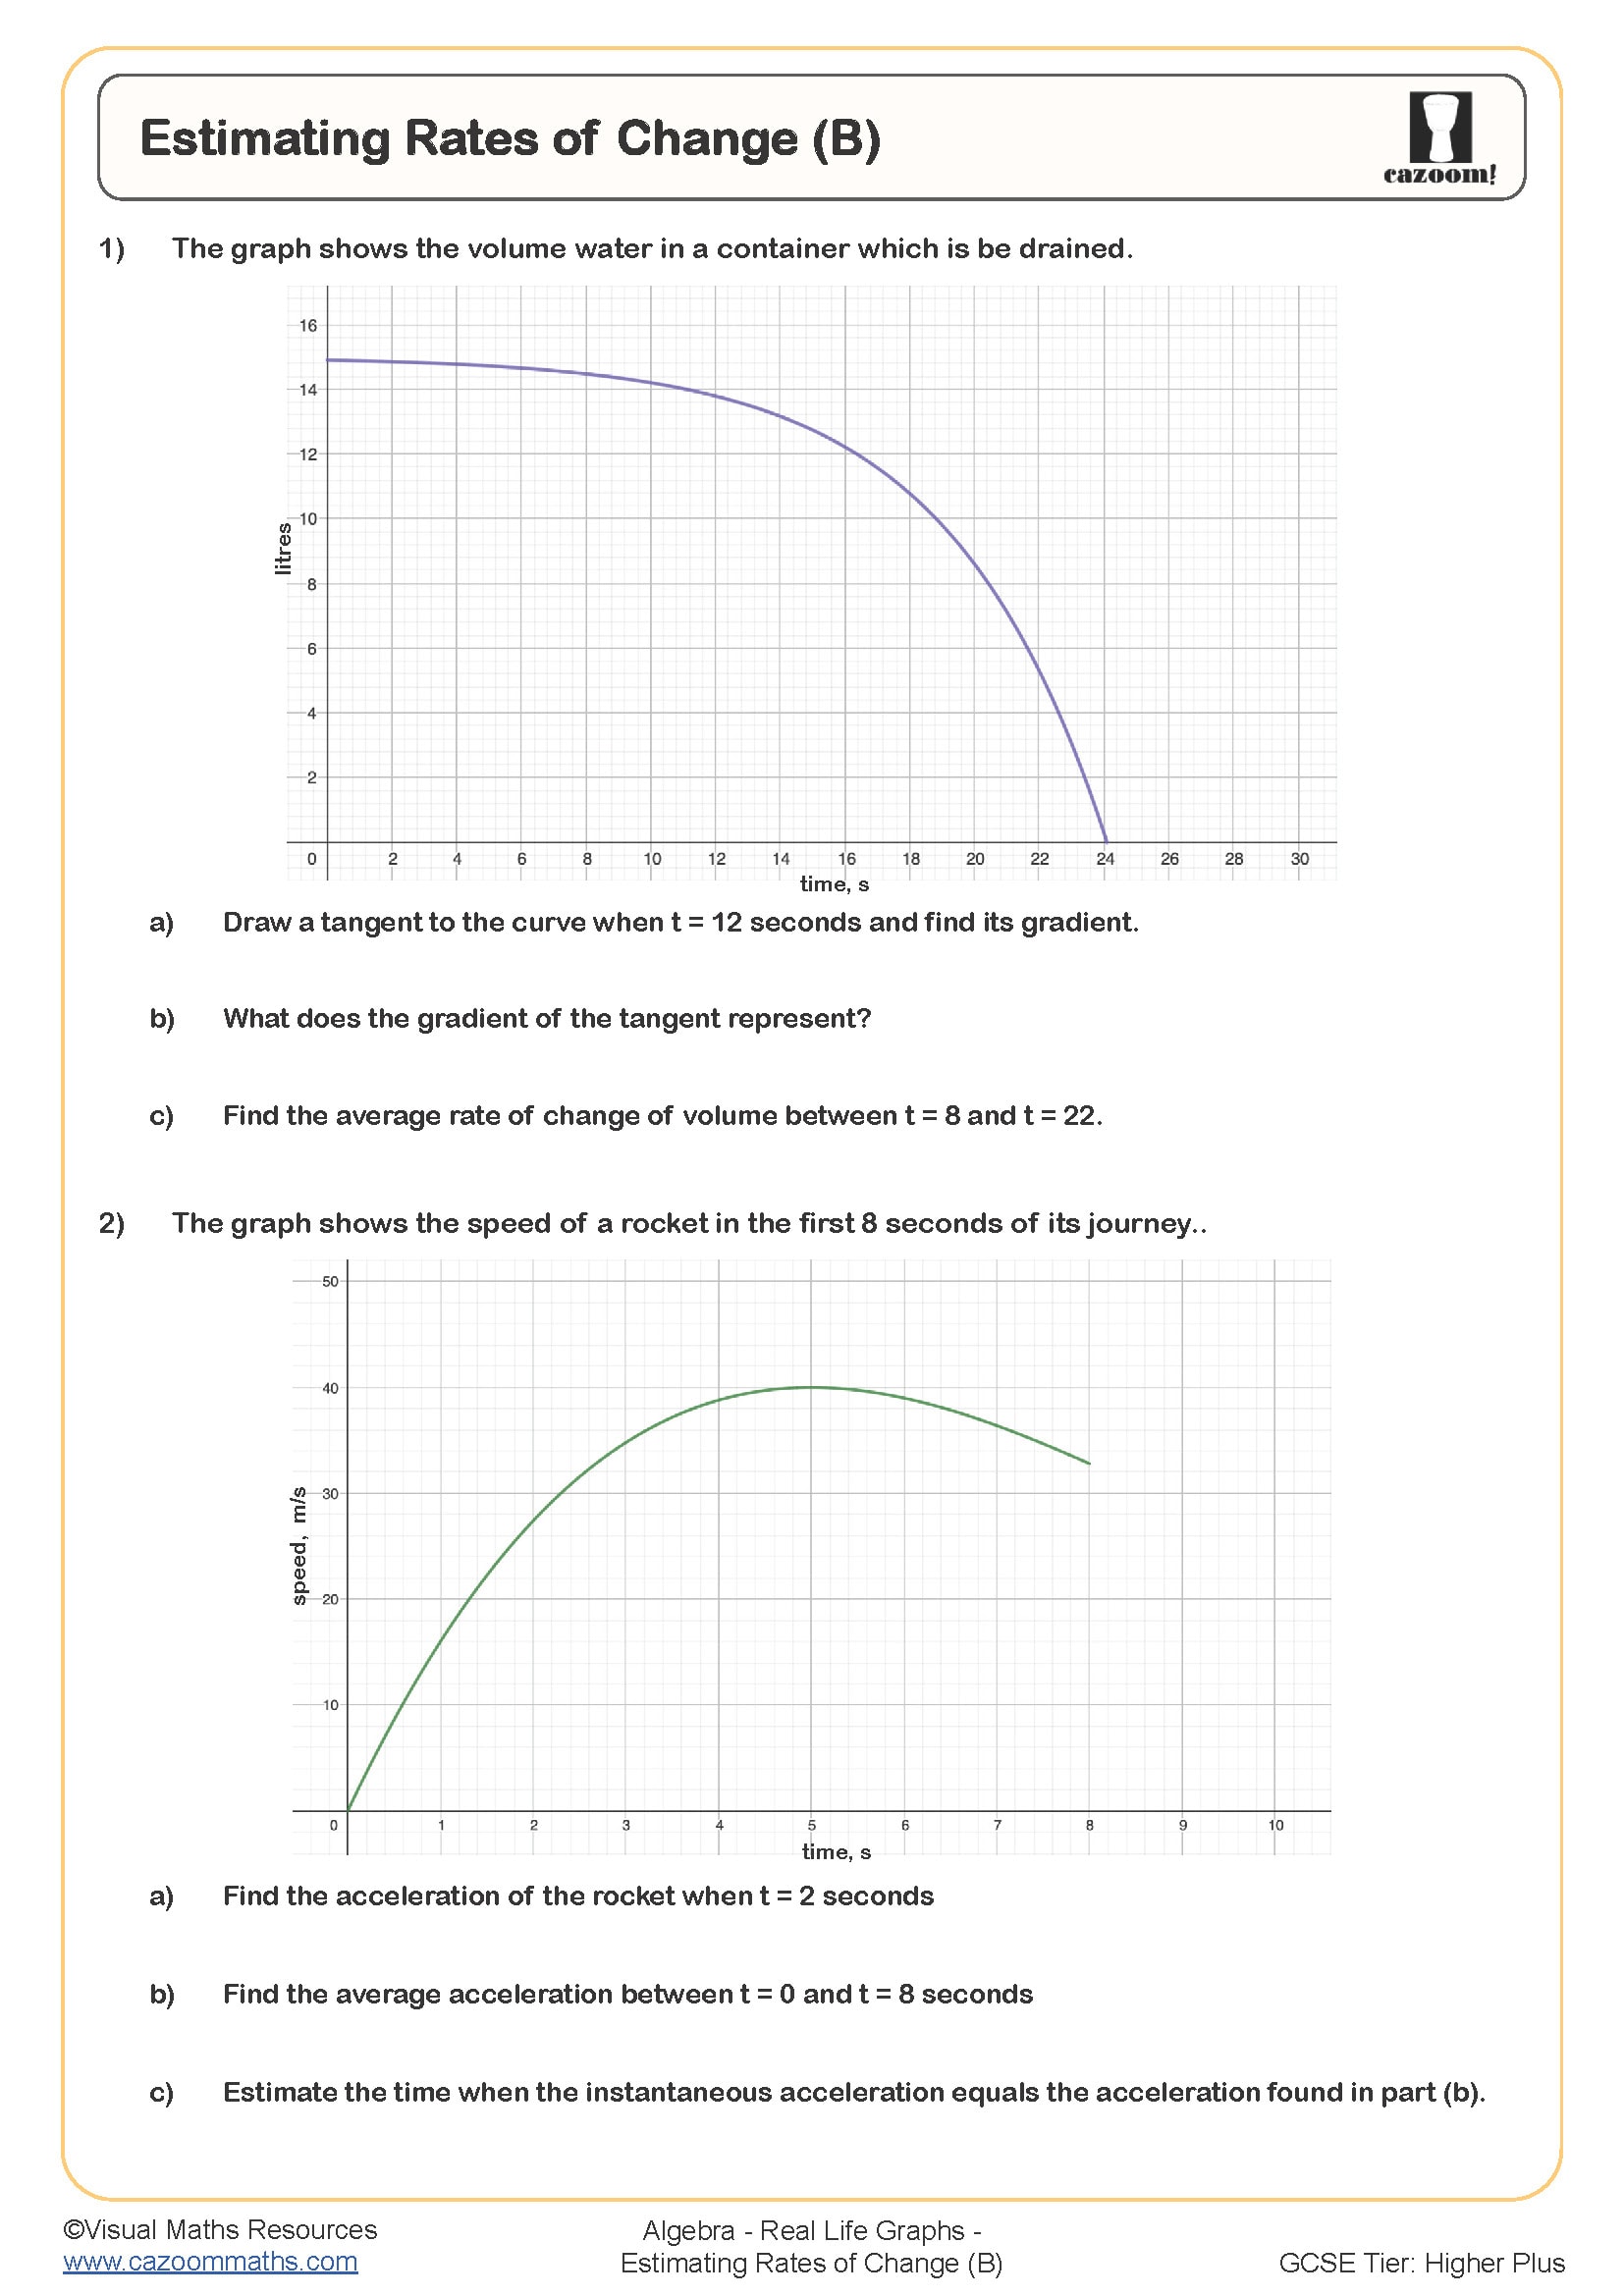
We've packed quite a lot into these real life graphs worksheets! Students start with simple line graph interpretation and progress to sophisticated analysis of rates of change, turning points, and trend predictions. The journey problems are particularly popular – students love working through scenarios involving travel, population growth, and business profits that mirror real GCSE questions.
Why Year 11 Students Need Structured Real Life Graph Practice
Here's what we've noticed after years of teaching: students who regularly practice interpreting real life graphs perform significantly better on their GCSE papers. These worksheets provide the systematic practice needed to build automatic recognition of graph patterns and relationships.
• Improved exam confidence when facing unfamiliar graph scenarios
• Stronger analytical thinking for problem-solving questions
• Better understanding of rates of change and gradient concepts
• Enhanced ability to extract information from complex visual data
• Increased speed and accuracy in graph interpretation tasks
Real-World Connections That Make Graph Skills Meaningful
Students always ask, "When will we ever use this?" – and with real life graphs, we've got brilliant answers! These skills appear across science subjects when analysing experimental data, in geography for population studies, and in business studies for profit analysis. It's actually quite satisfying when students suddenly realise they're using graph skills in other lessons too.
• Physics experiments involving distance-time and velocity-time graphs
• Geography coursework analysing climate and demographic data
• Business studies examining sales trends and market analysis
• Biology investigations tracking growth rates and population changes
• Economics lessons understanding supply and demand curves
• Psychology research interpreting experimental results and correlations
