Year 8 Real Life Graphs Worksheets
All worksheets are created by the team of experienced teachers at Cazoom Maths.
Get Higher Marks Using Year 8 Real-Life Printable PDF Worksheets
Mastering real-life graphs marks a crucial turning point in the mathematical development of Year 8 students, bridging the gap between abstract algebra and practical problem-solving. The development from basic coordinate work in Year 7 to understanding complex relationships leads students to master rate of change concepts, which form the basis of physics, economics and data science. Students learn to see algebra as a predictive tool through graph connections that relate to journey planning and scientific experiments. The systematic method of graphical analysis helps students develop critical thinking skills, which they need to understand media reports, scientific studies, and financial information throughout their lives. Students who practice different graph types develop their ability to identify mathematical patterns which relate to various real-world scenarios.
Specific learning benefits include:
• Master the interpretation of distance-time relationships
• Develops speed calculation from gradient analysis
• Strengthens conversion between different units
• Identifies patterns in non-linear data
• Improves cross-curricular data analysis
• Enhances scientific investigation skills
• Builds algebraic reasoning through visual representations
Master These 8 Core Graph Concepts With Our Worksheets
Our worksheets guide students through the natural learning progression from concrete examples to pictorial representations and finally to abstract mathematical reasoning, ensuring deep understanding at every stage. Each resource includes fully worked solutions that demonstrate the mathematical thinking behind every answer, helping students understand not just what the correct response is, but why it's correct. This scaffolded approach means students can work independently whilst having access to detailed explanations whenever they need support.
The worksheets in this collection include:
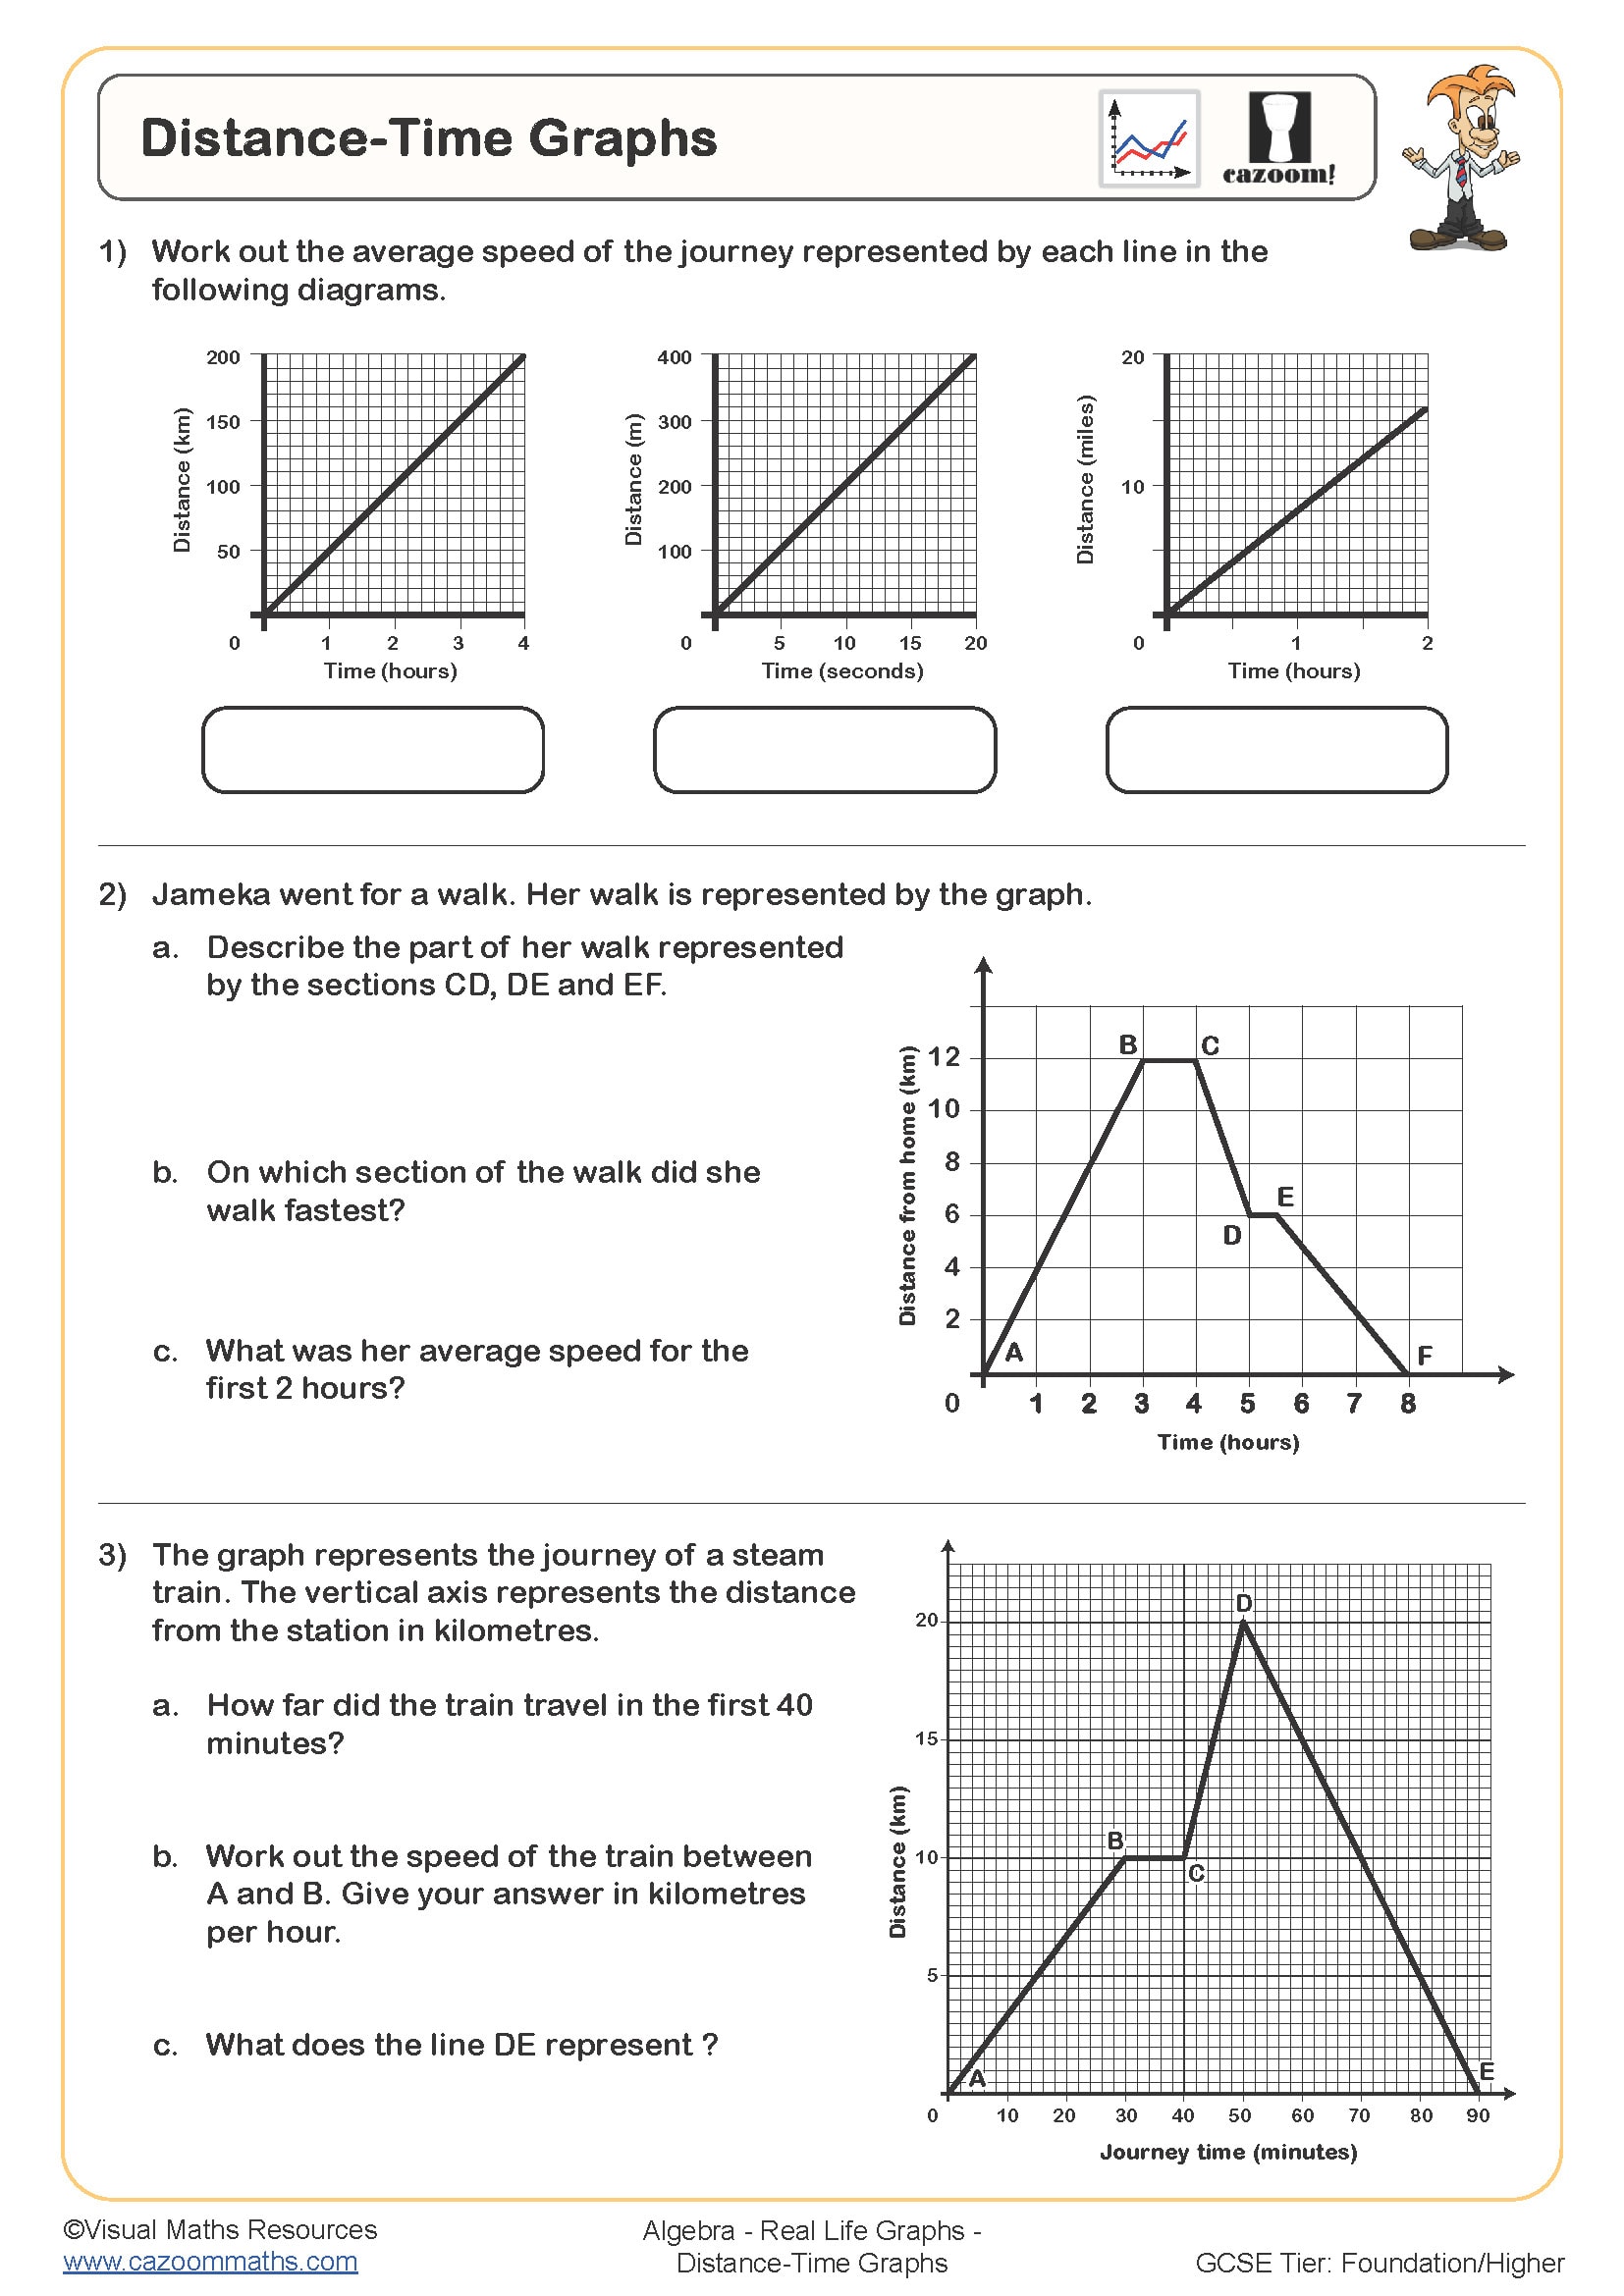
• Distance-Time Graphs 1 — interprets journeys with constant speeds and stationary periods
• Distance-Time Graphs 2 — calculates average speeds from multi-stage journeys
• Speed-Time Graphs Introduction — understands acceleration and deceleration patterns
• Speed-Time Graphs Practice — finds distance travelled using area calculations
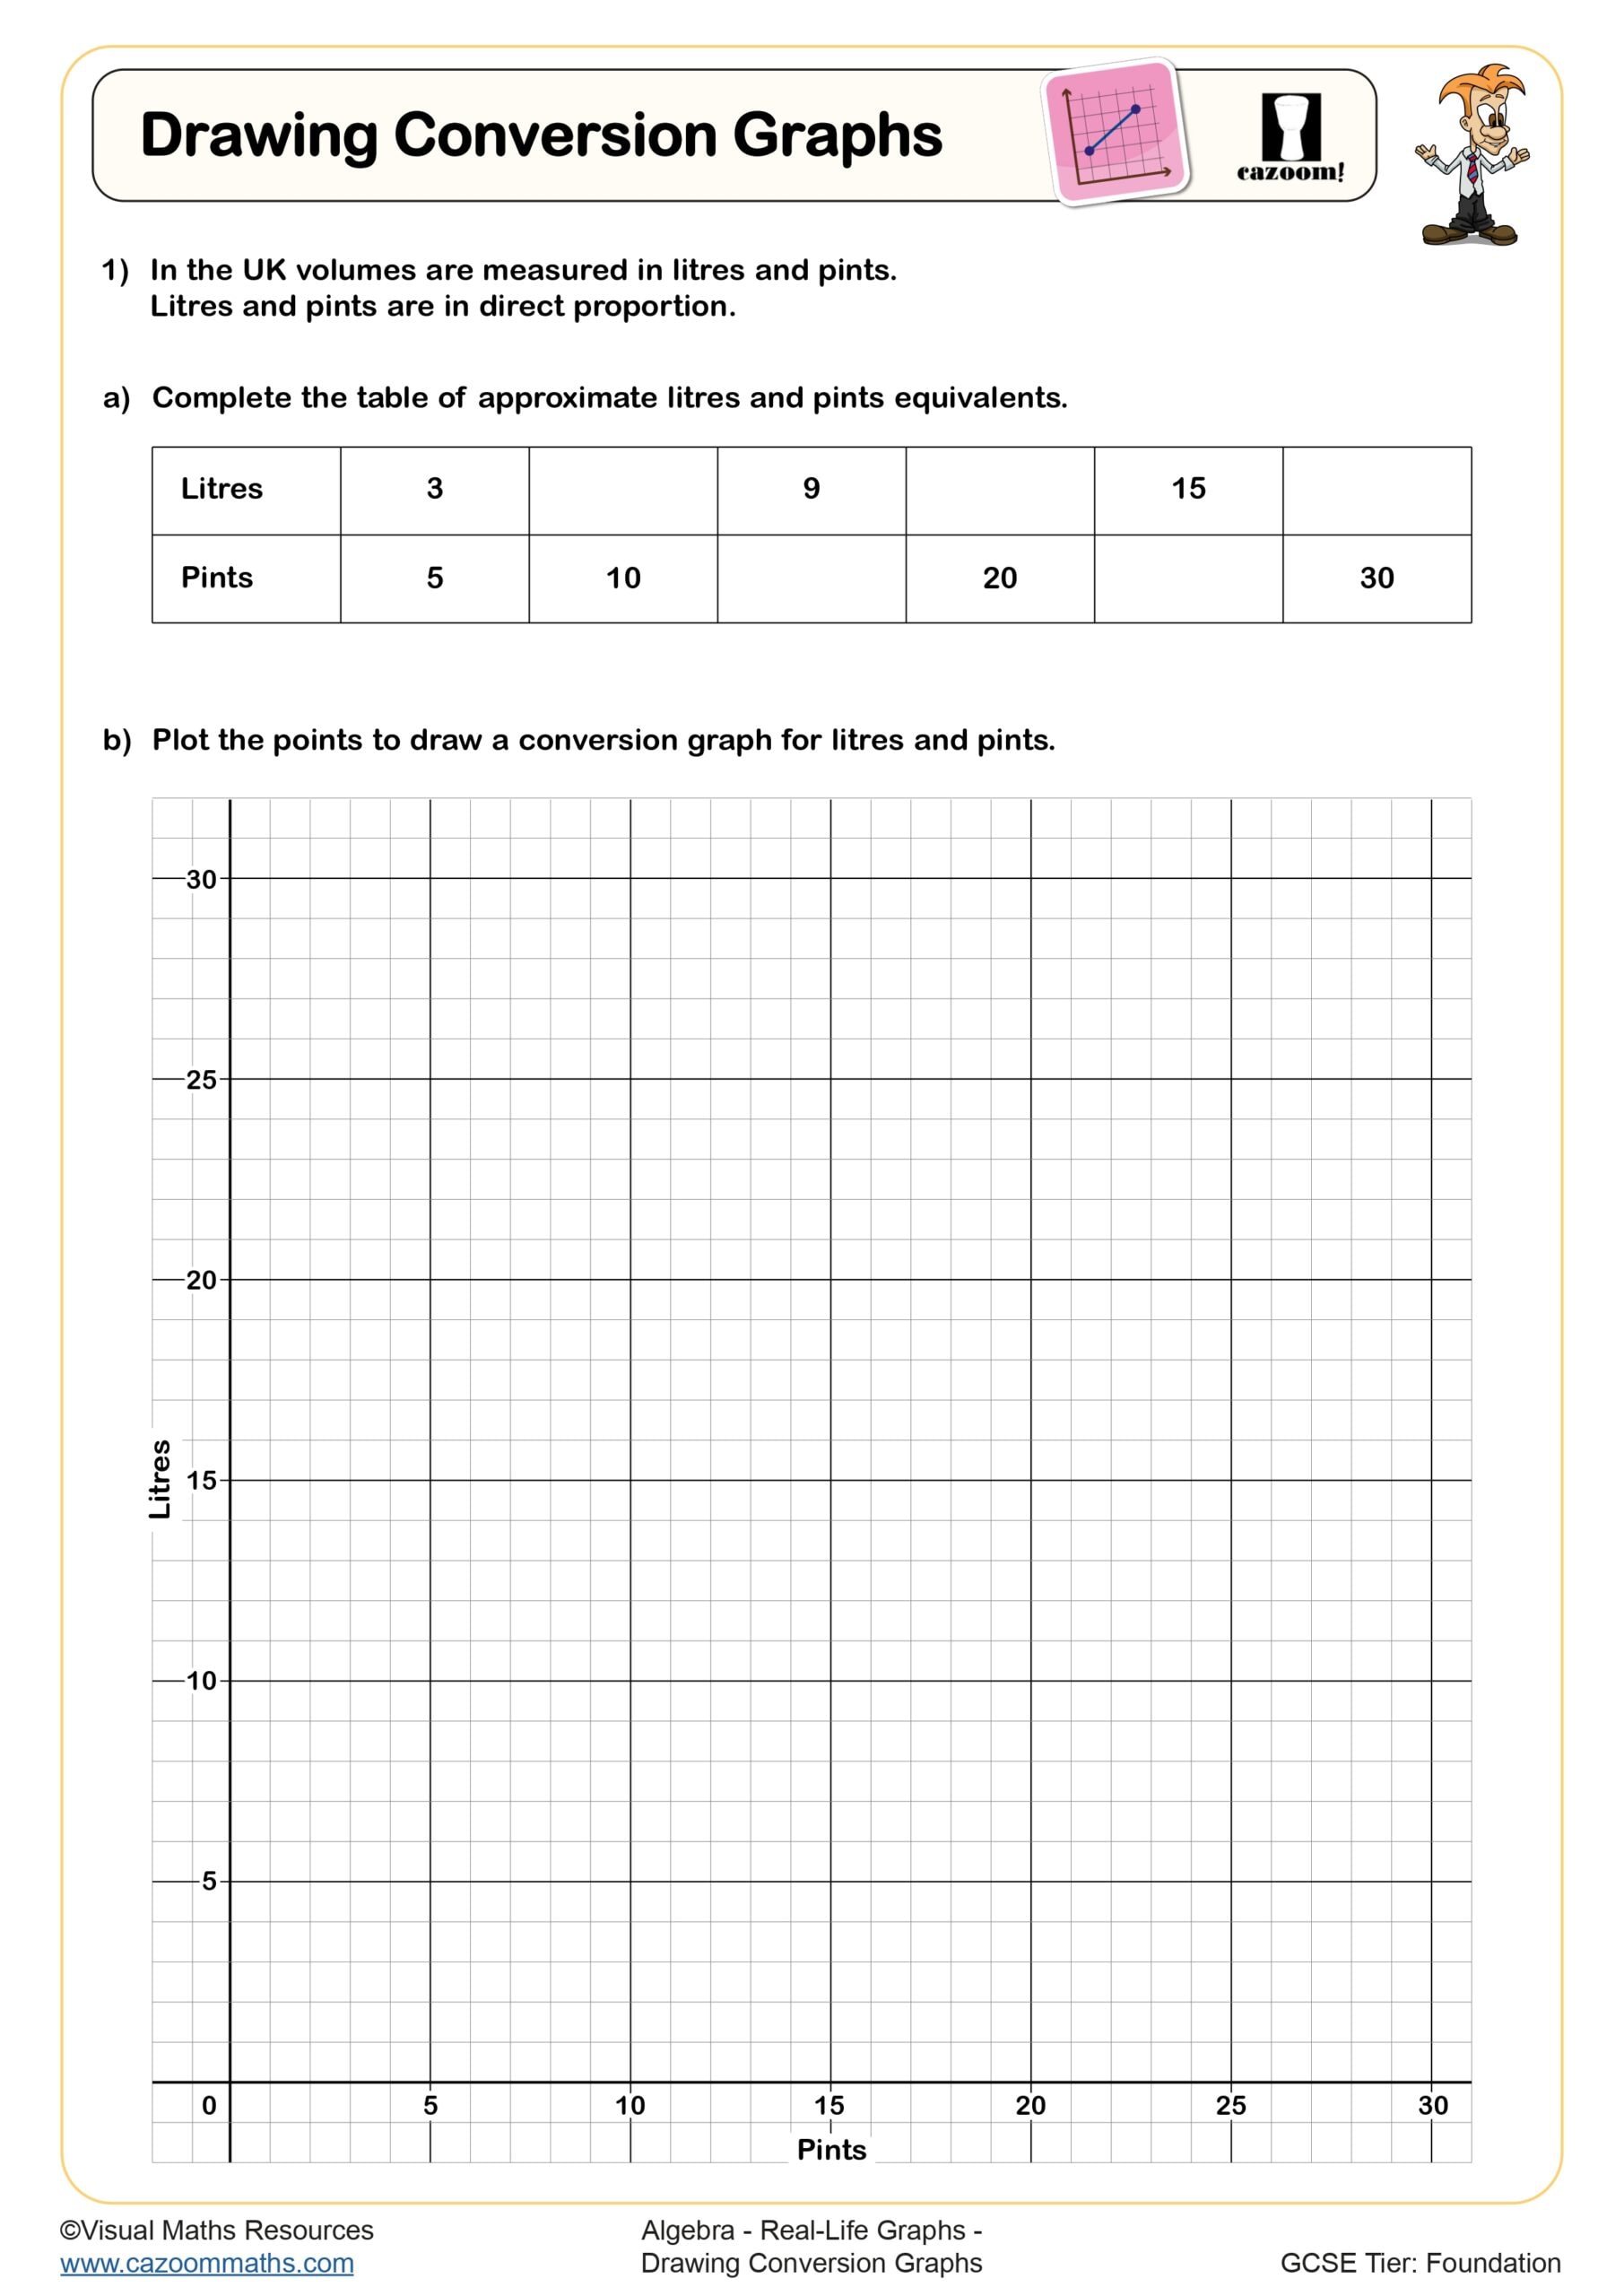
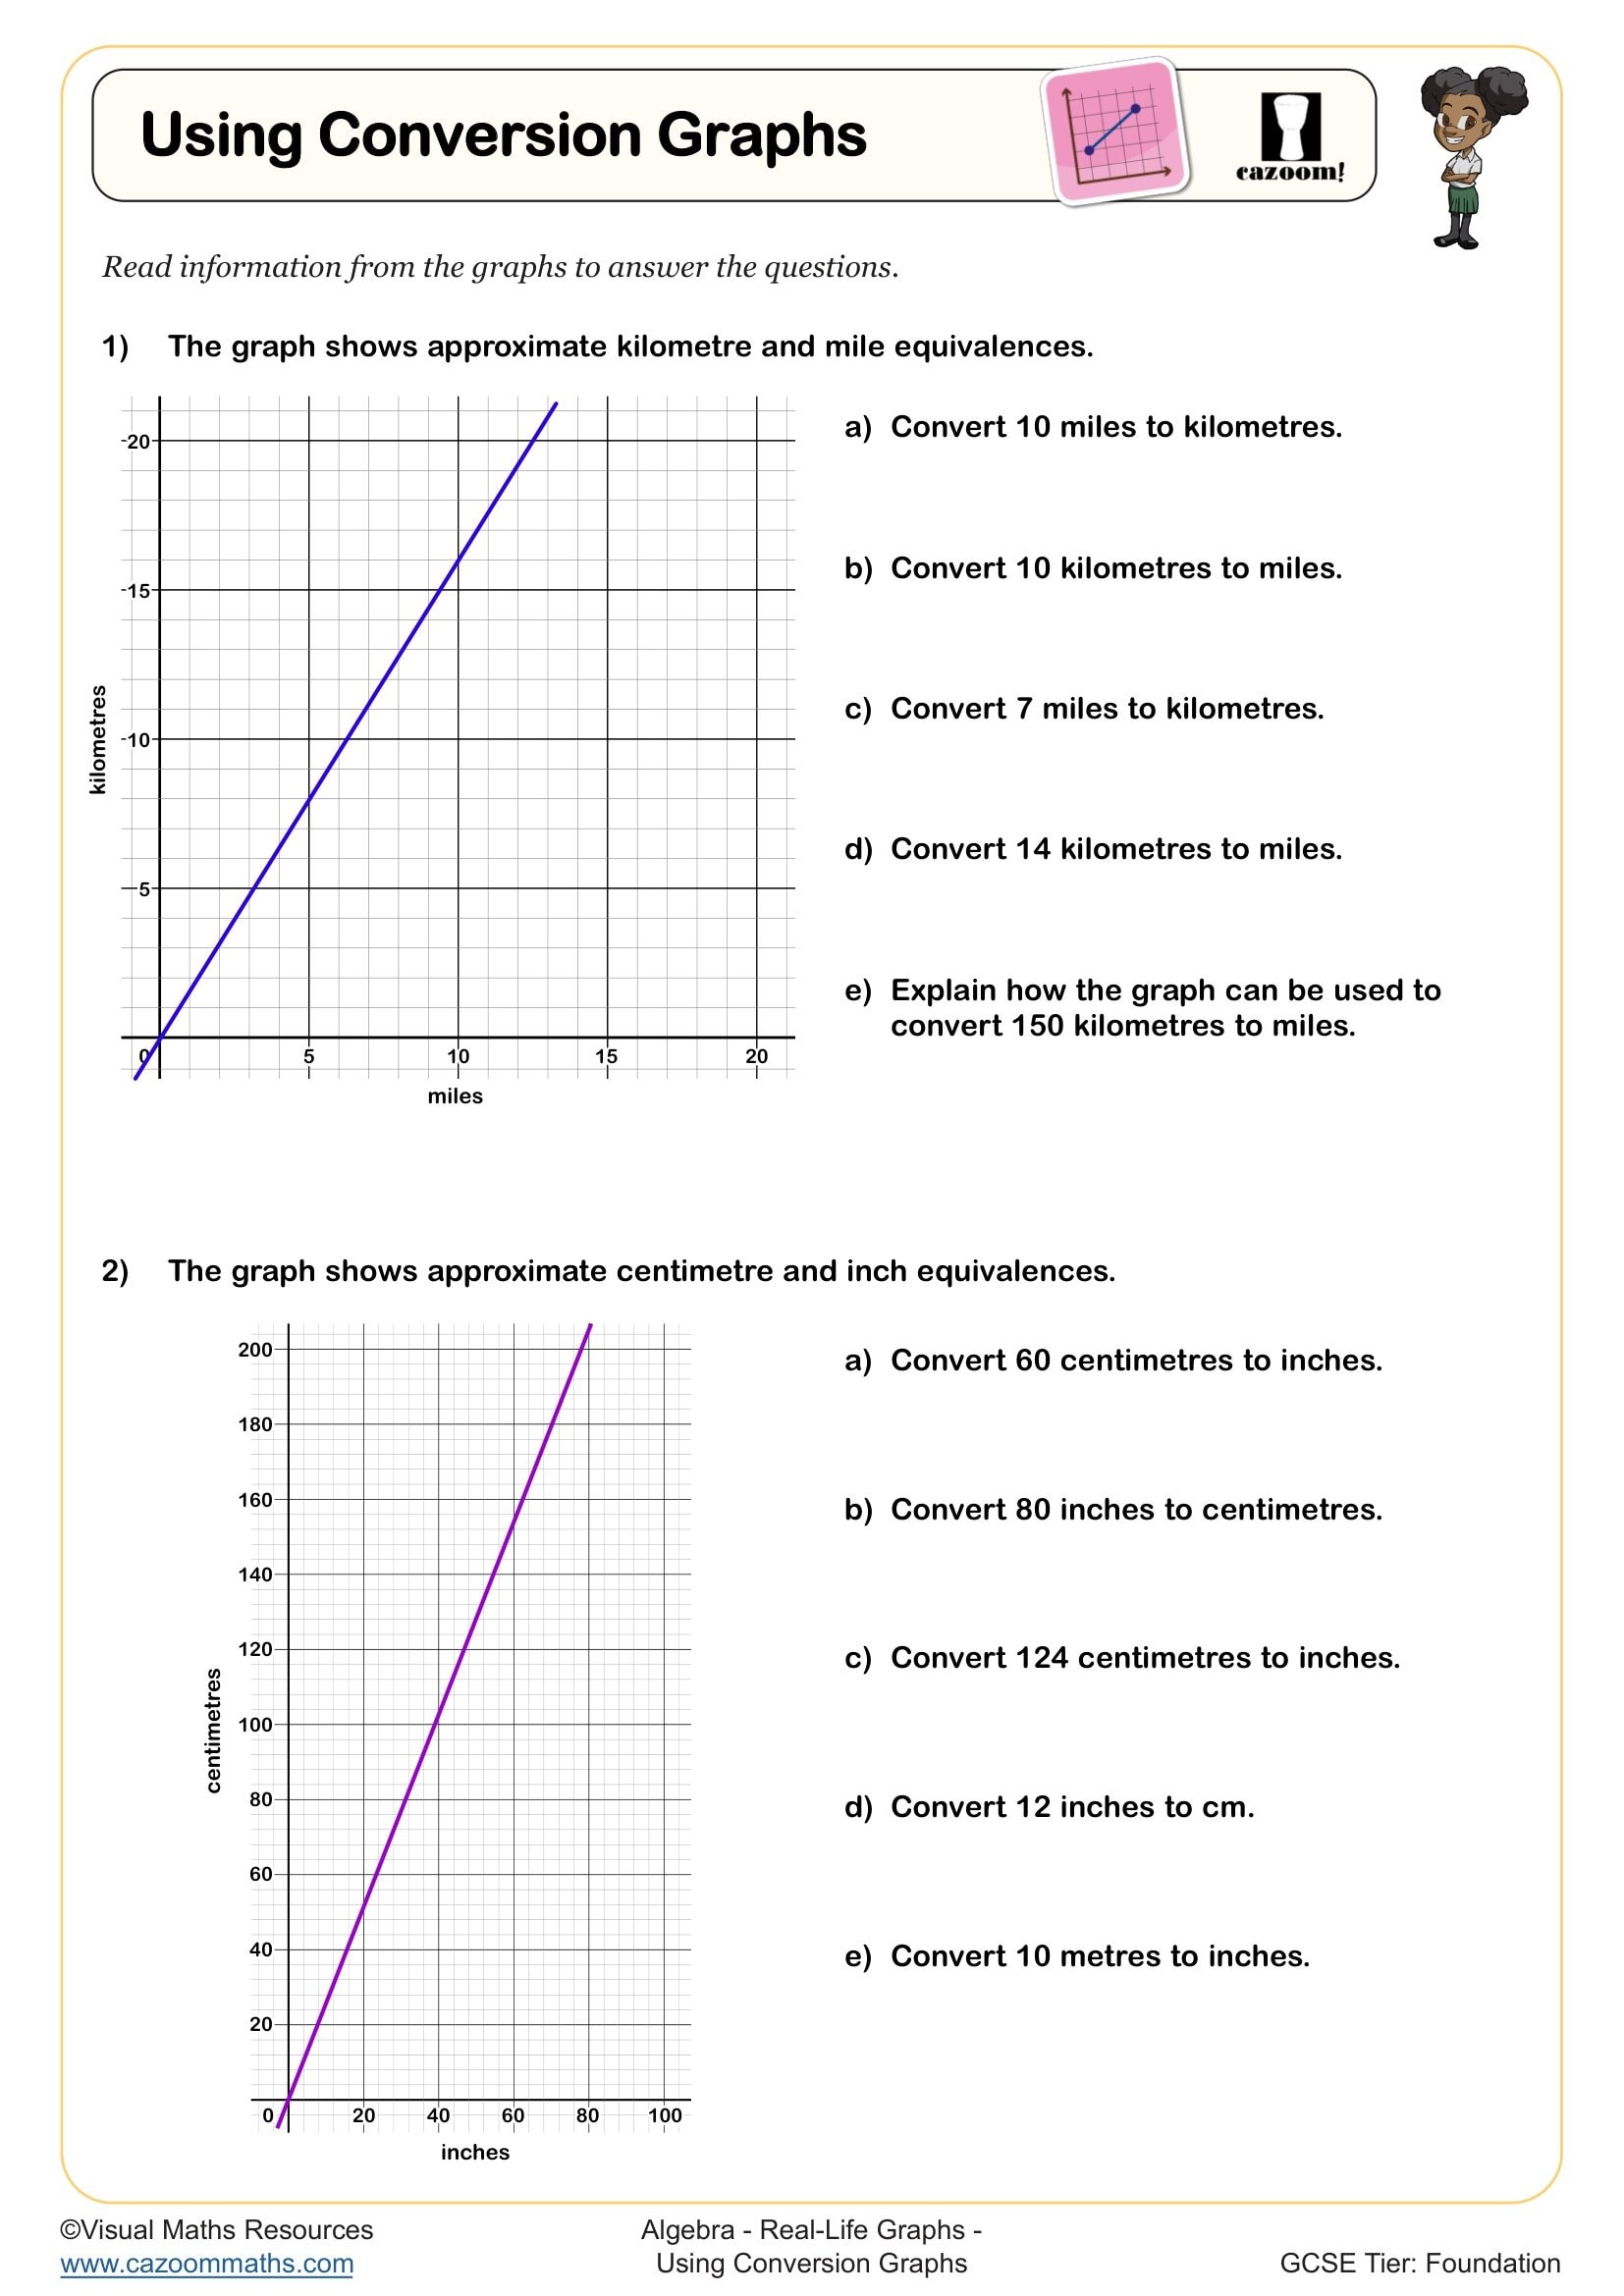
• Conversion Graphs — converts between currencies, temperatures, and measurements
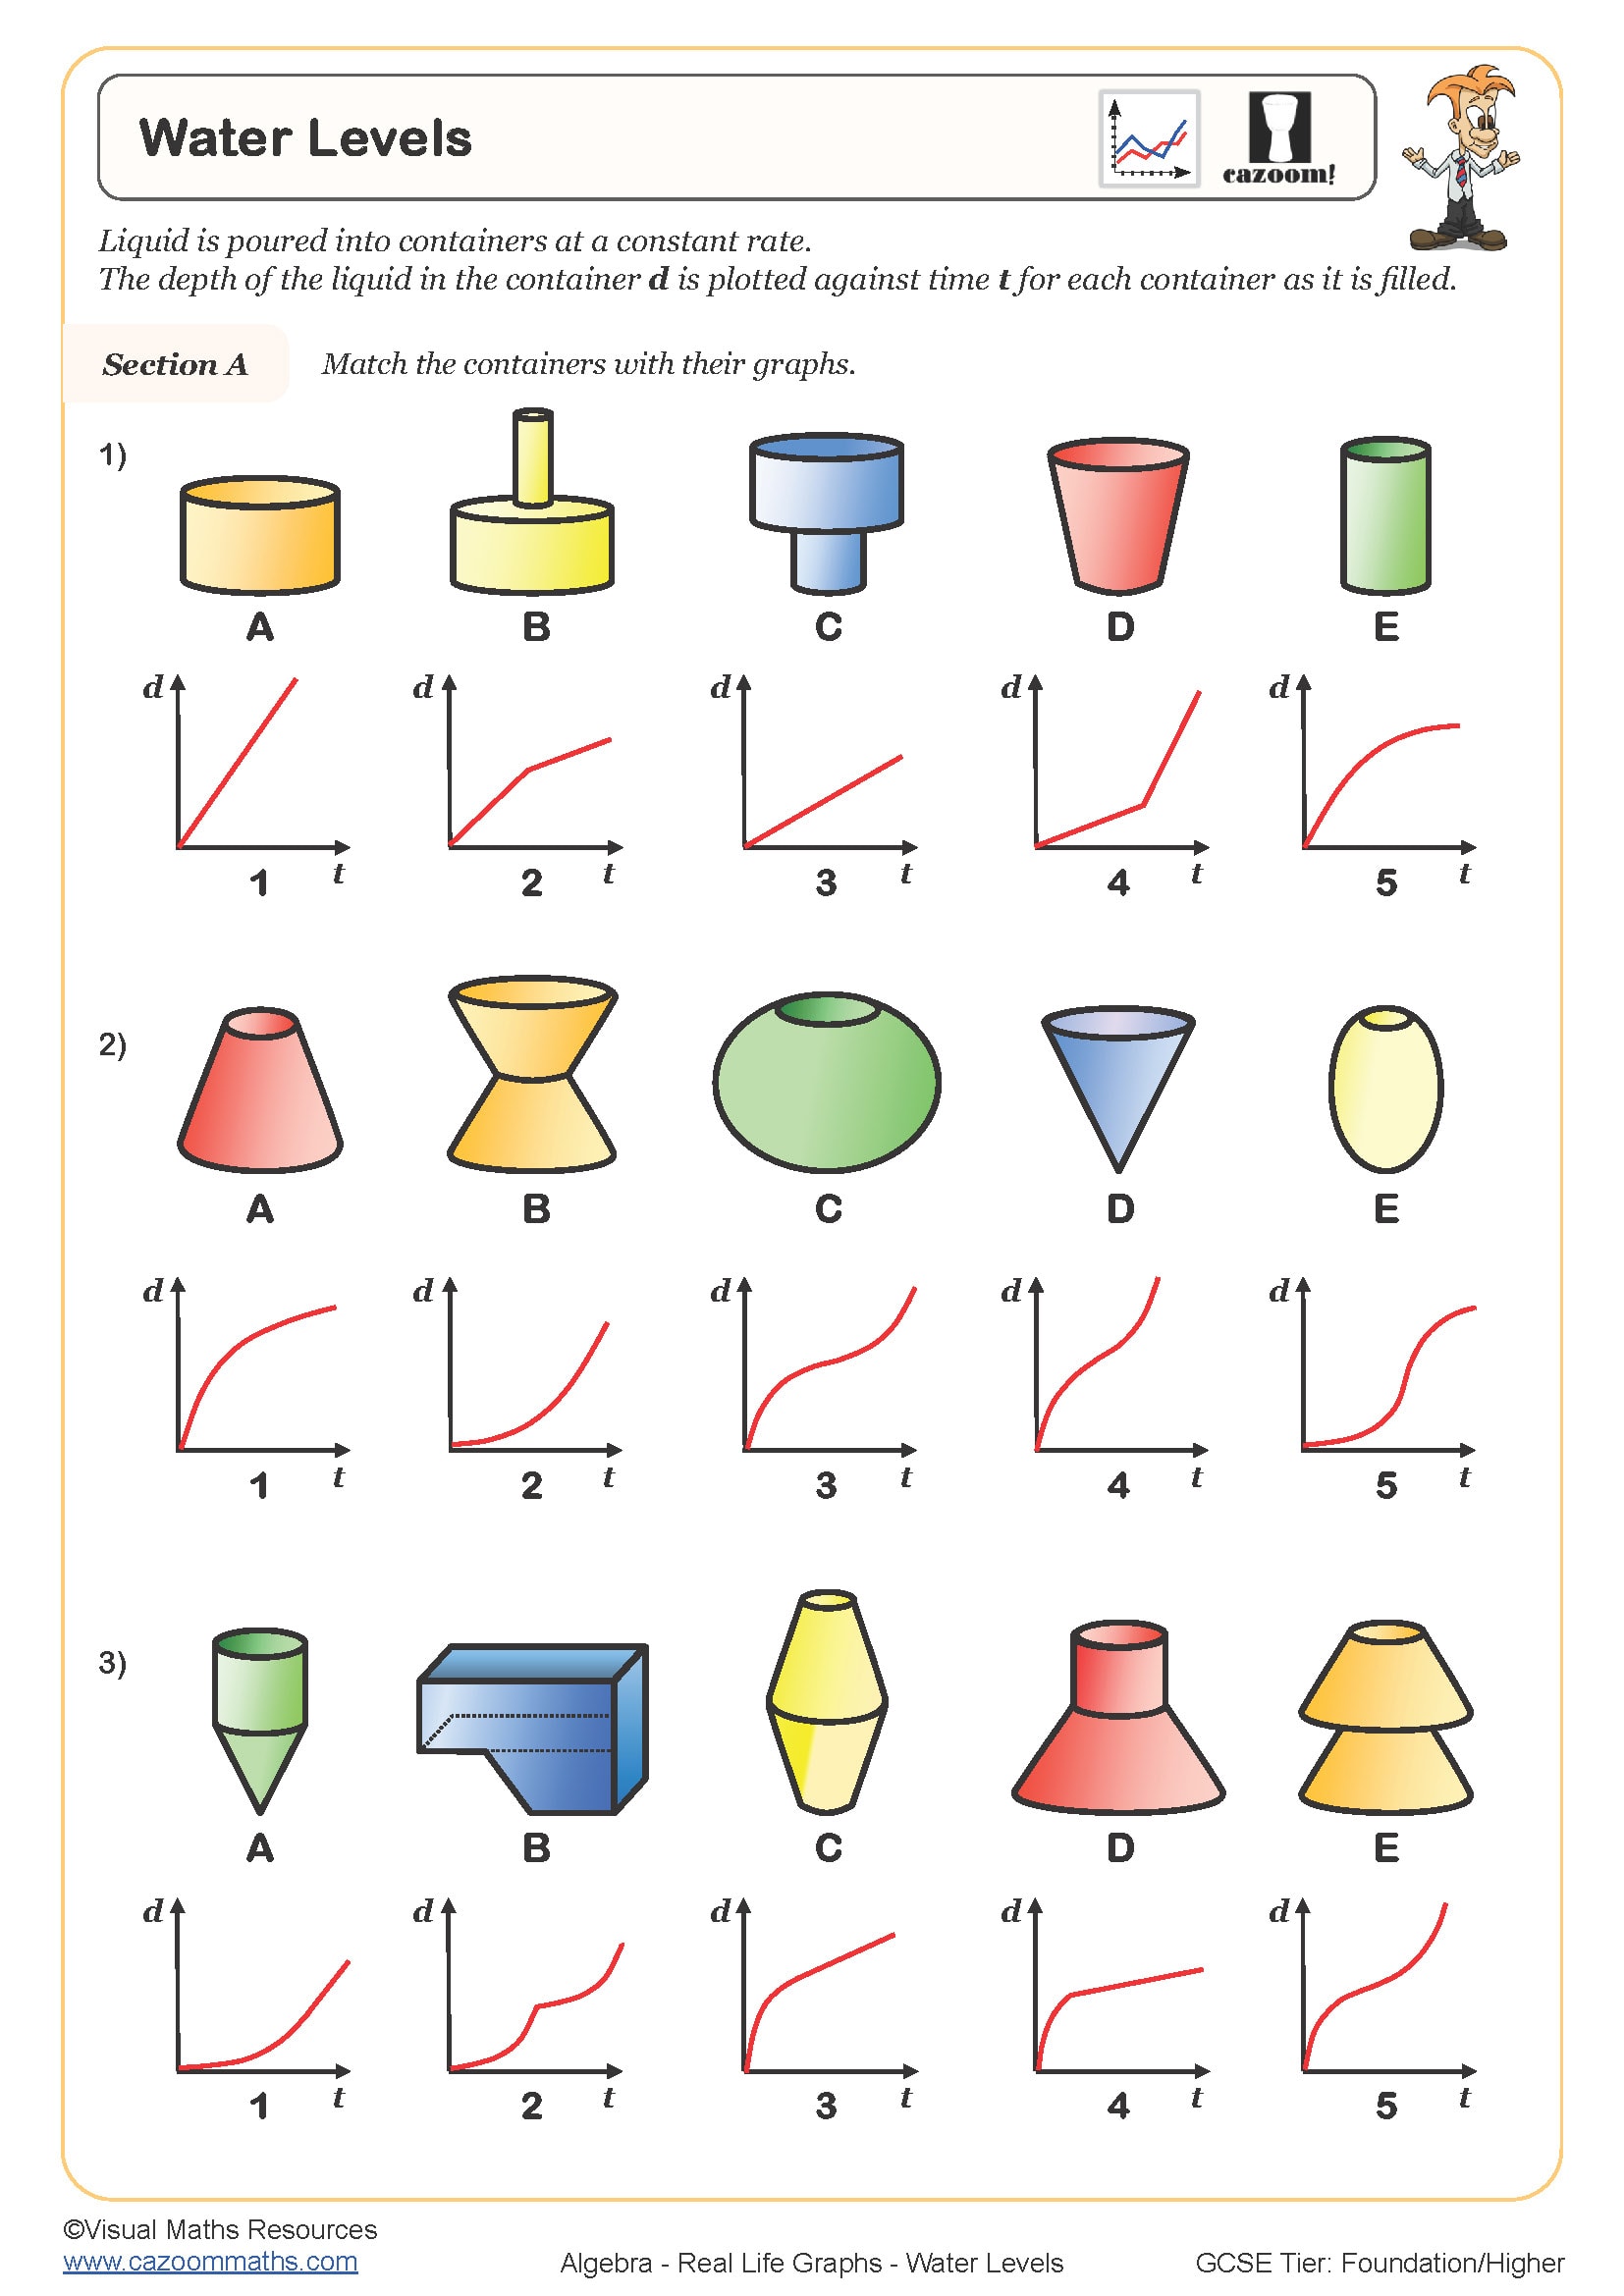
• Rate of Change Problems — applies gradient concepts to filling containers
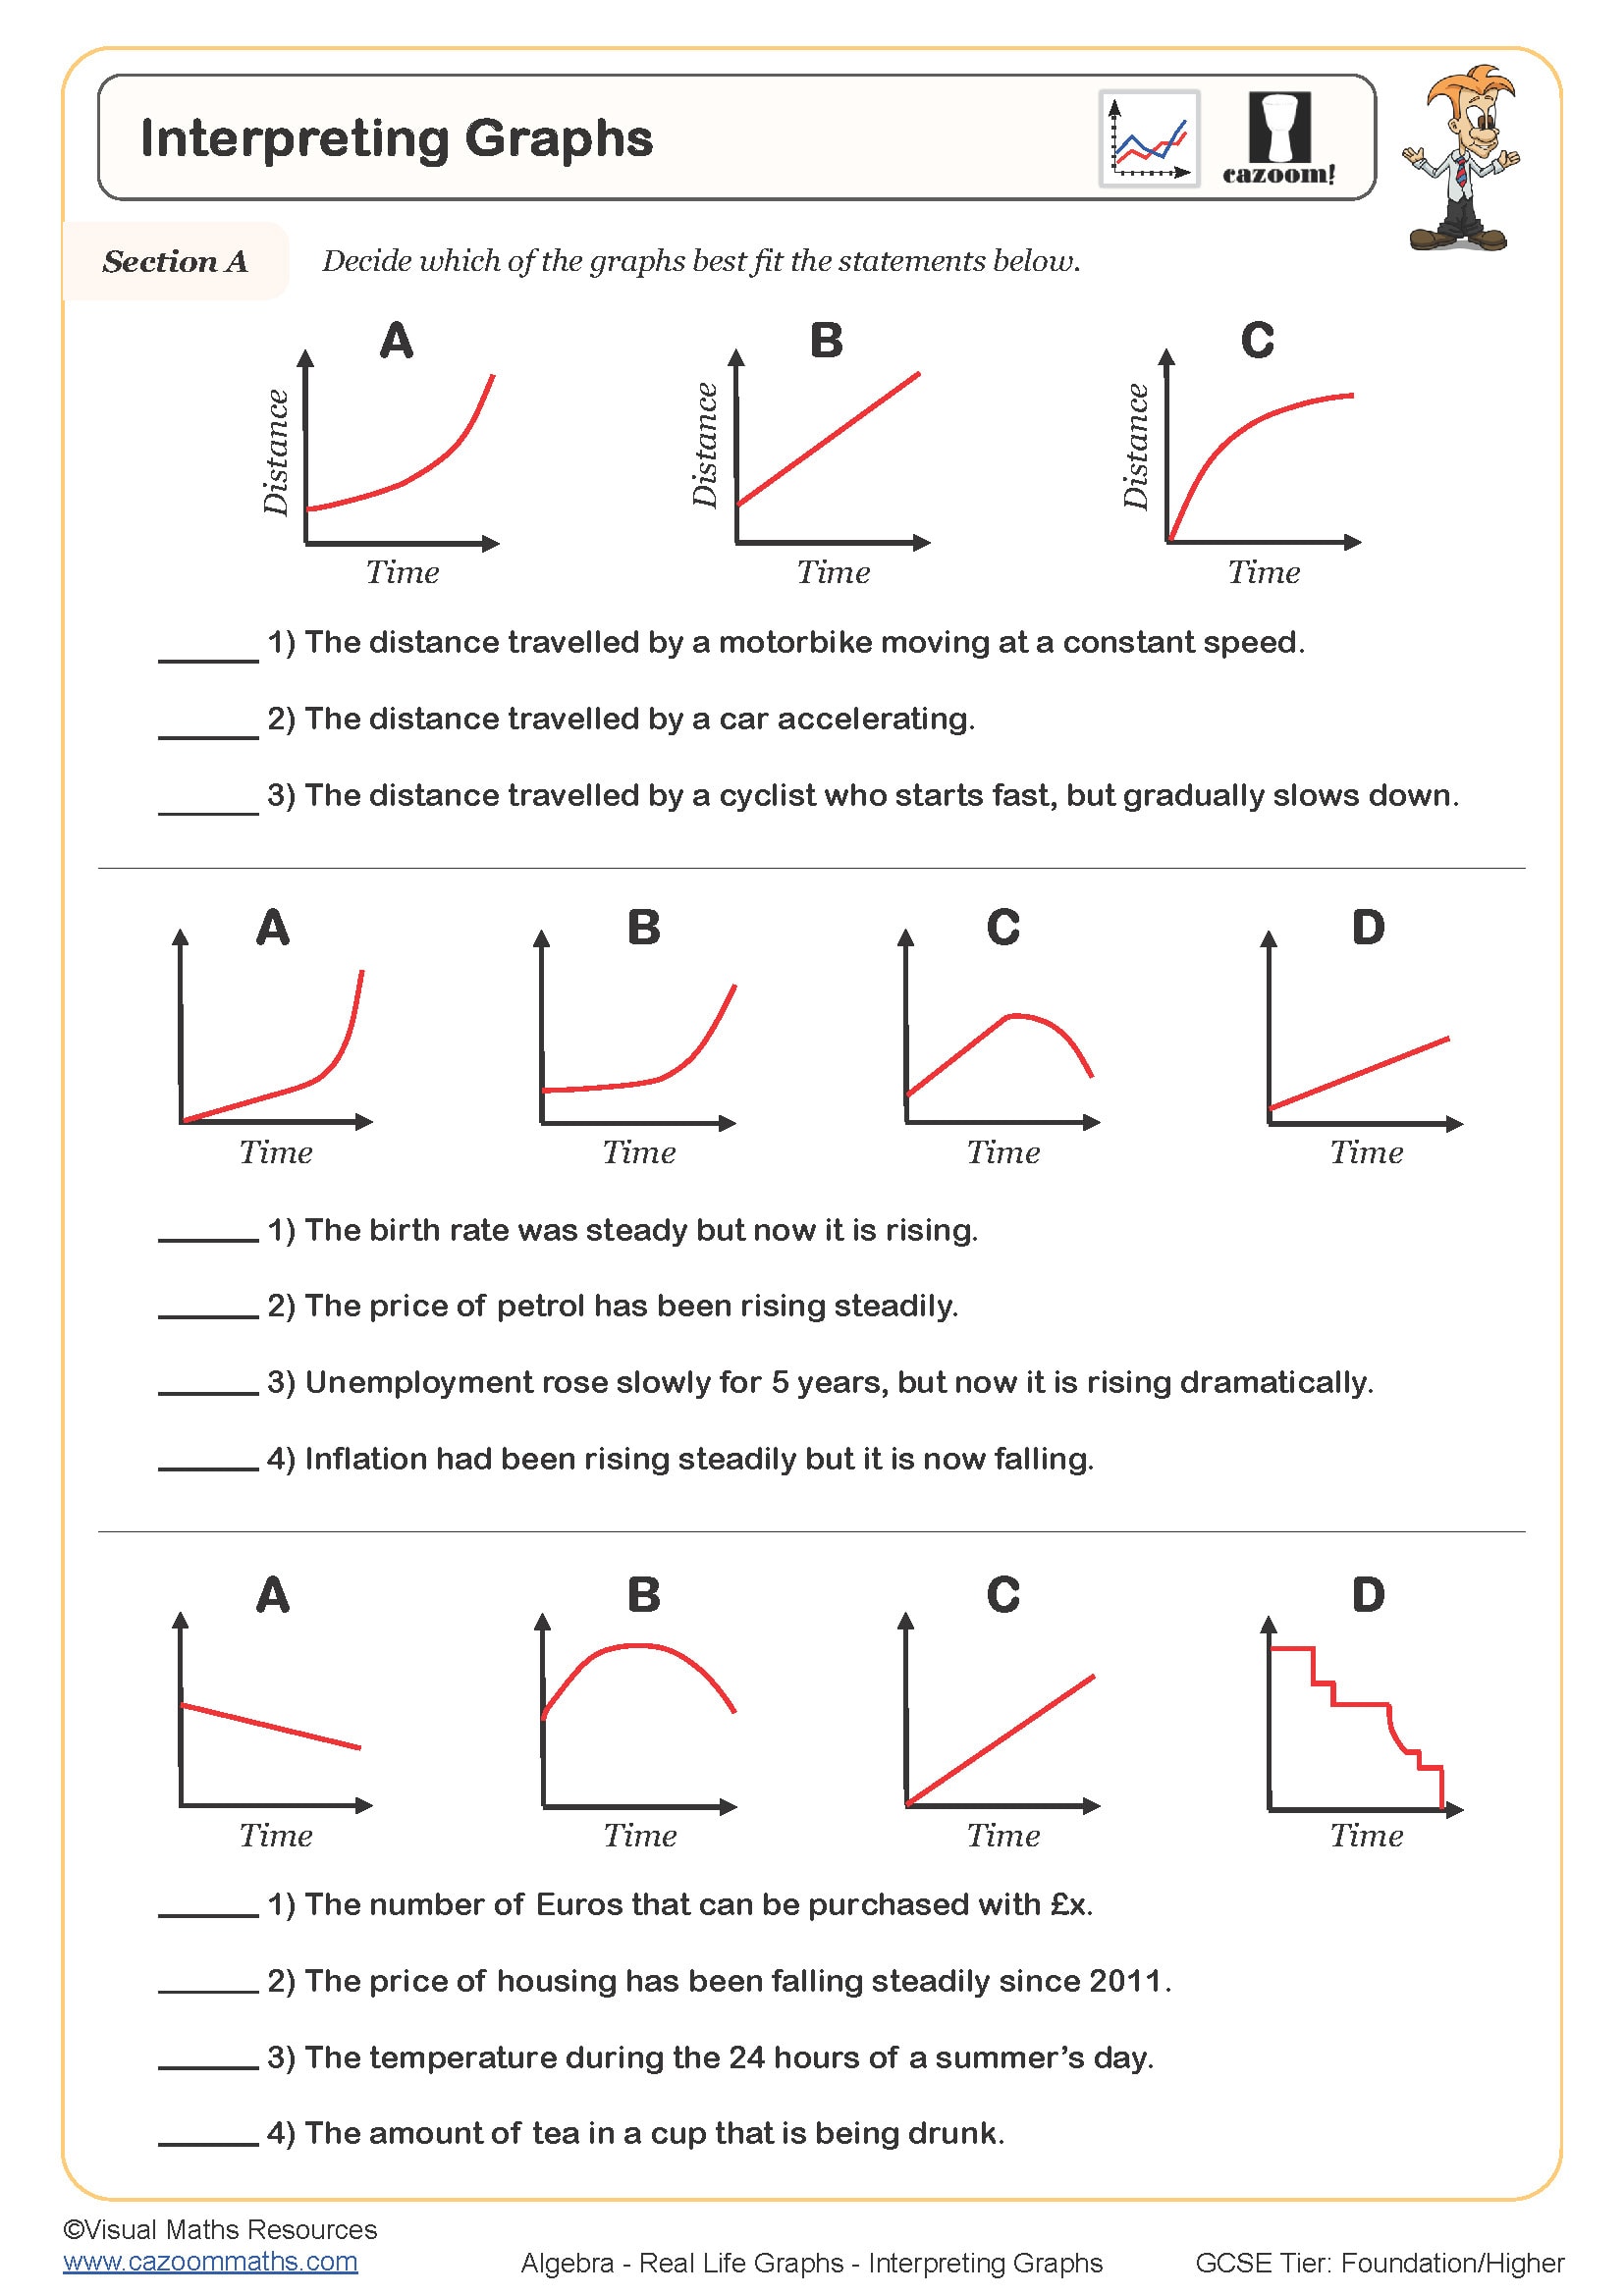
• Interpreting Real Life Graphs — analyses mobile phone tariffs and utility bills
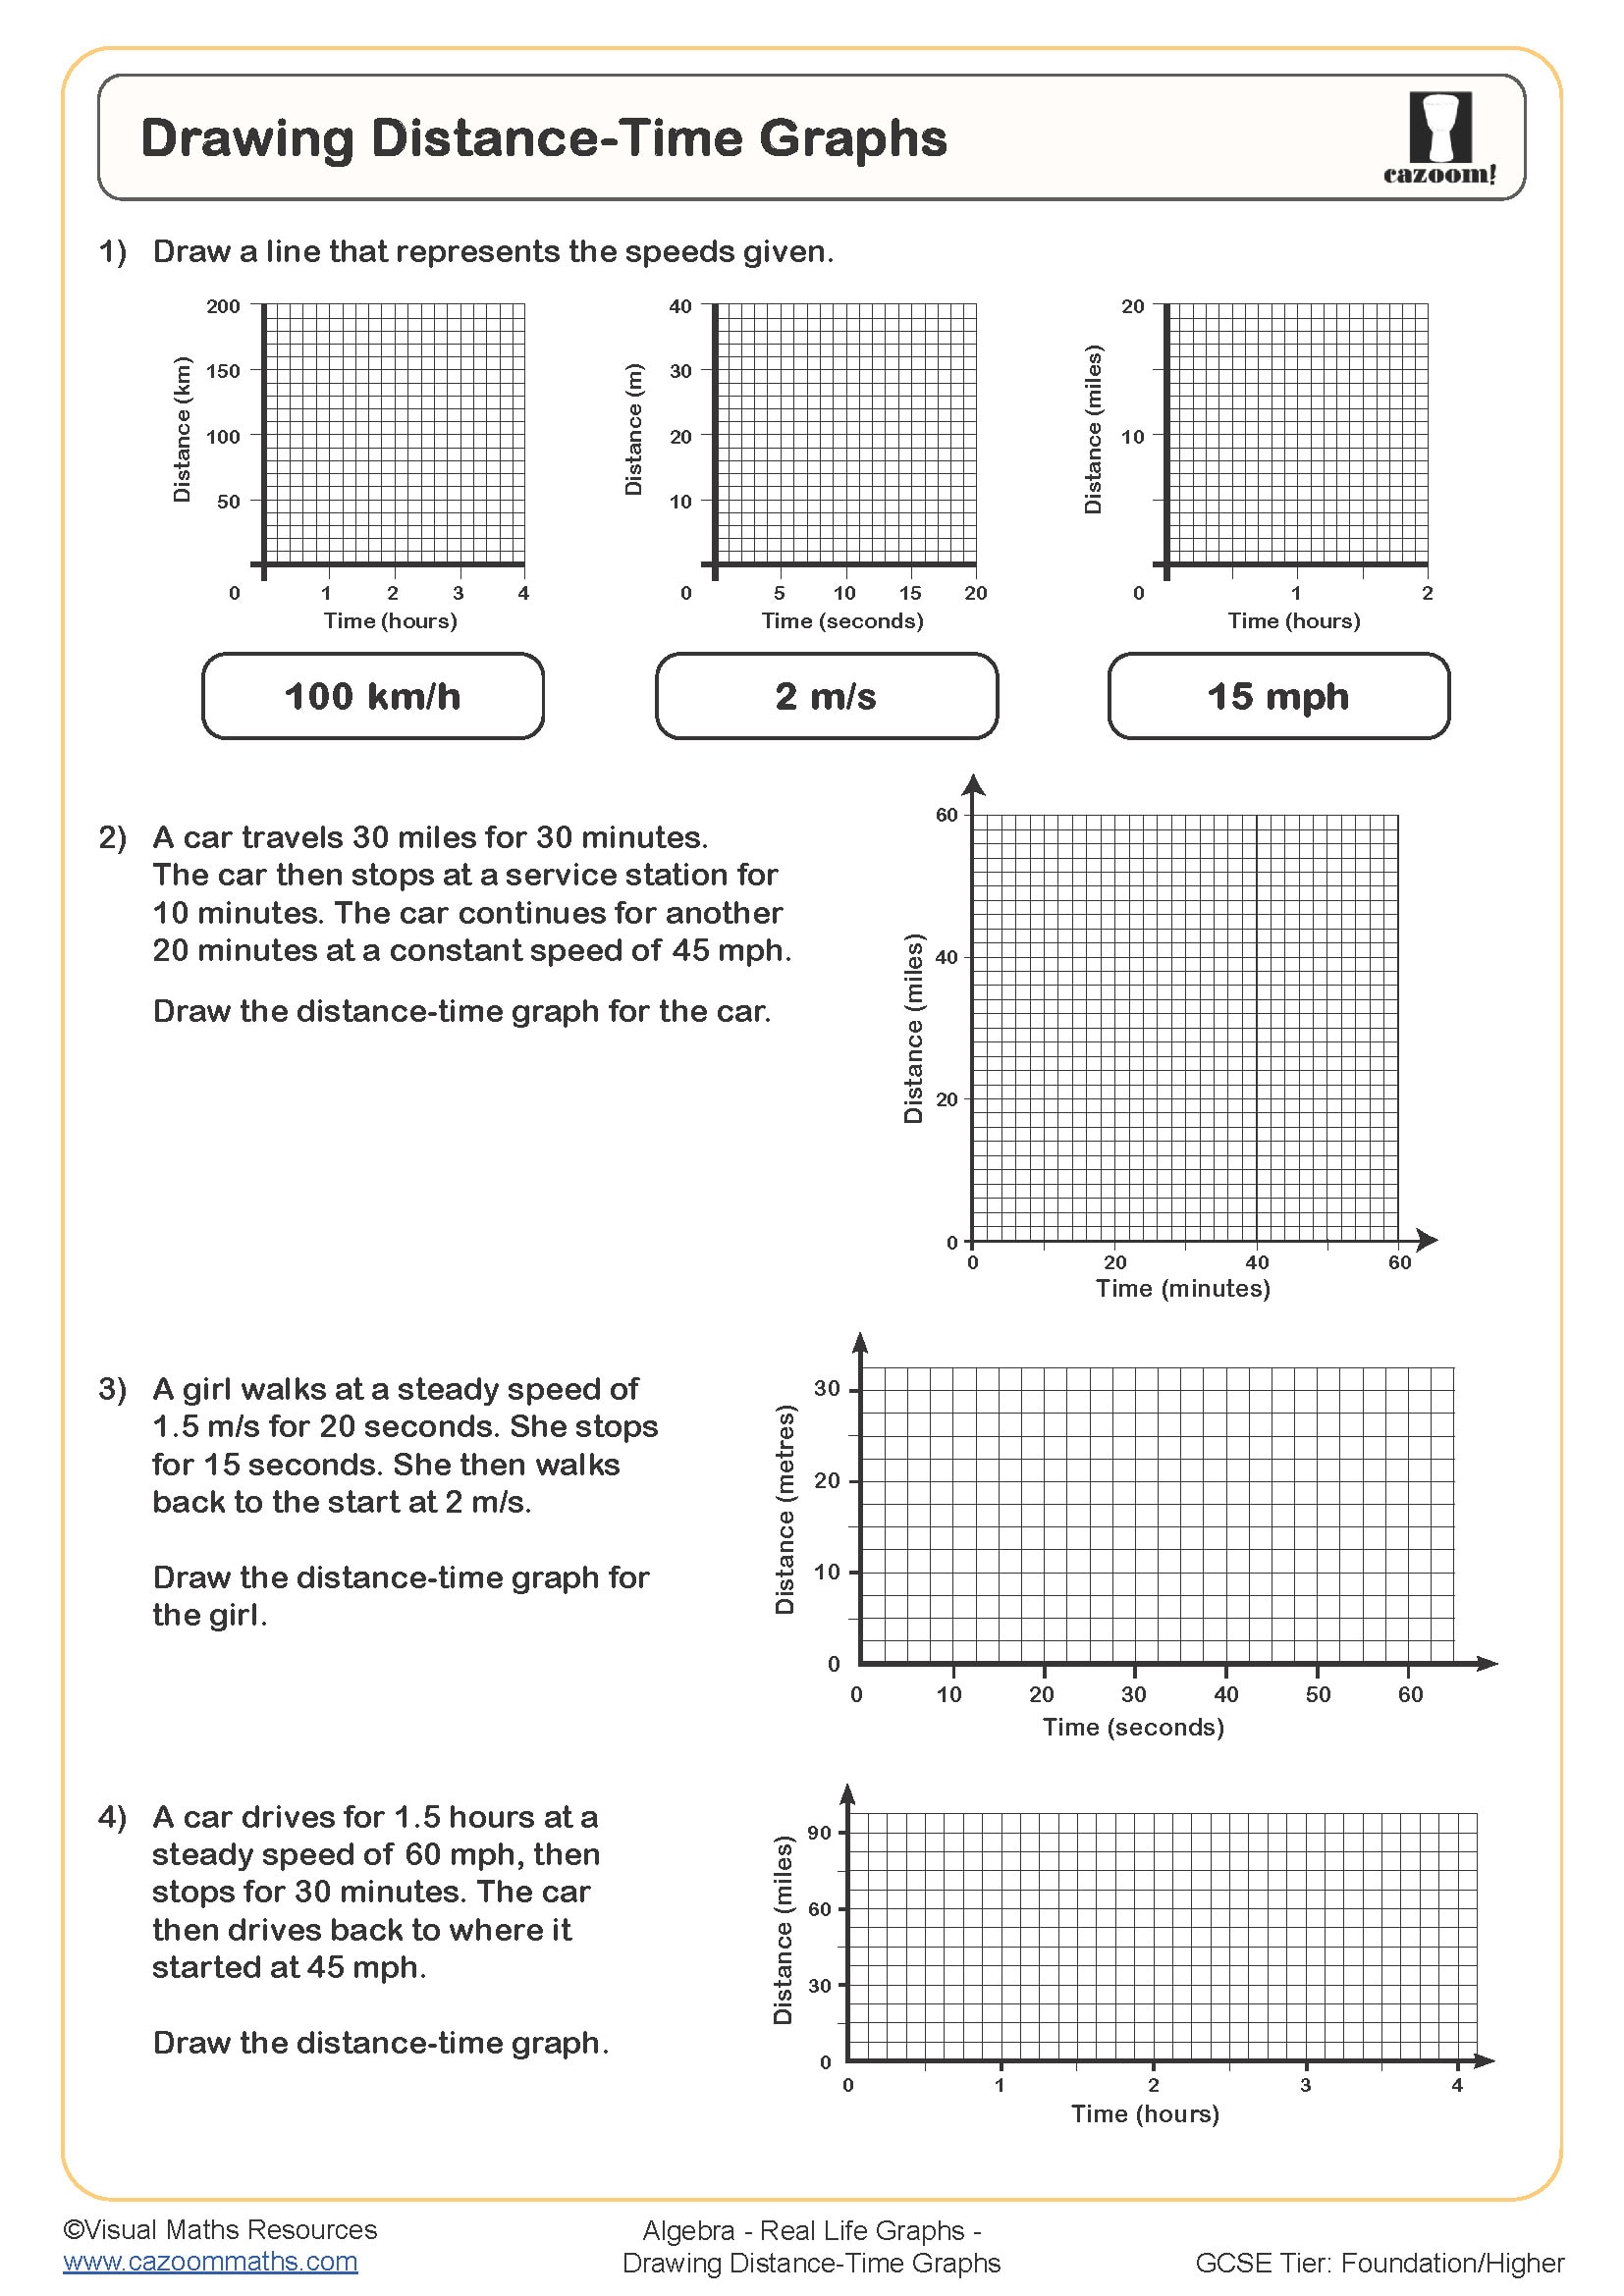
• Drawing Graphs from Descriptions — creates accurate graphs from written scenarios
Why KS3 Teachers Trust These Graph Resources for Differentiated Learning
These worksheets address the diverse needs found in every Year 8 classroom by providing multiple entry points into each topic whilst maintaining high expectations for all learners. The strategic combination of accessible content with challenging extension questions enables struggling students to achieve success while advanced learners continue to engage through the additional questions that deepen their understanding. Clear visual layouts reduce cognitive load, allowing students to focus on mathematical reasoning rather than decoding complicated instructions or cluttered presentations. Time-pressed teachers appreciate the comprehensive answer sheets that streamline marking whilst revealing common misconceptions through the step-by-step working shown. The structured progression through each worksheet mirrors effective classroom teaching, making these resources ideal for cover lessons, homework assignments, or intervention sessions where consistent quality matters.
Connecting Graph Skills to Students' Everyday Experiences
Understanding how to read and create graphs empowers Year 8 students to navigate an increasingly data-driven world where visual information shapes decisions and opinions.
• Planning optimal travel routes using journey time comparisons
• Analysing sports performance data and fitness tracking
• Understanding energy consumption patterns at home
• Interpreting weather forecasts and climate graphs
• Comparing online shopping deals and price trends
• Reading experimental results in science lessons
• Evaluating social media engagement metrics
• Making sense of news reports featuring statistical graphs