Year 9 Real Life Graphs Worksheets
All worksheets are created by the team of experienced teachers at Cazoom Maths.
What makes a real life graphs worksheet effective for Key Stage 3?
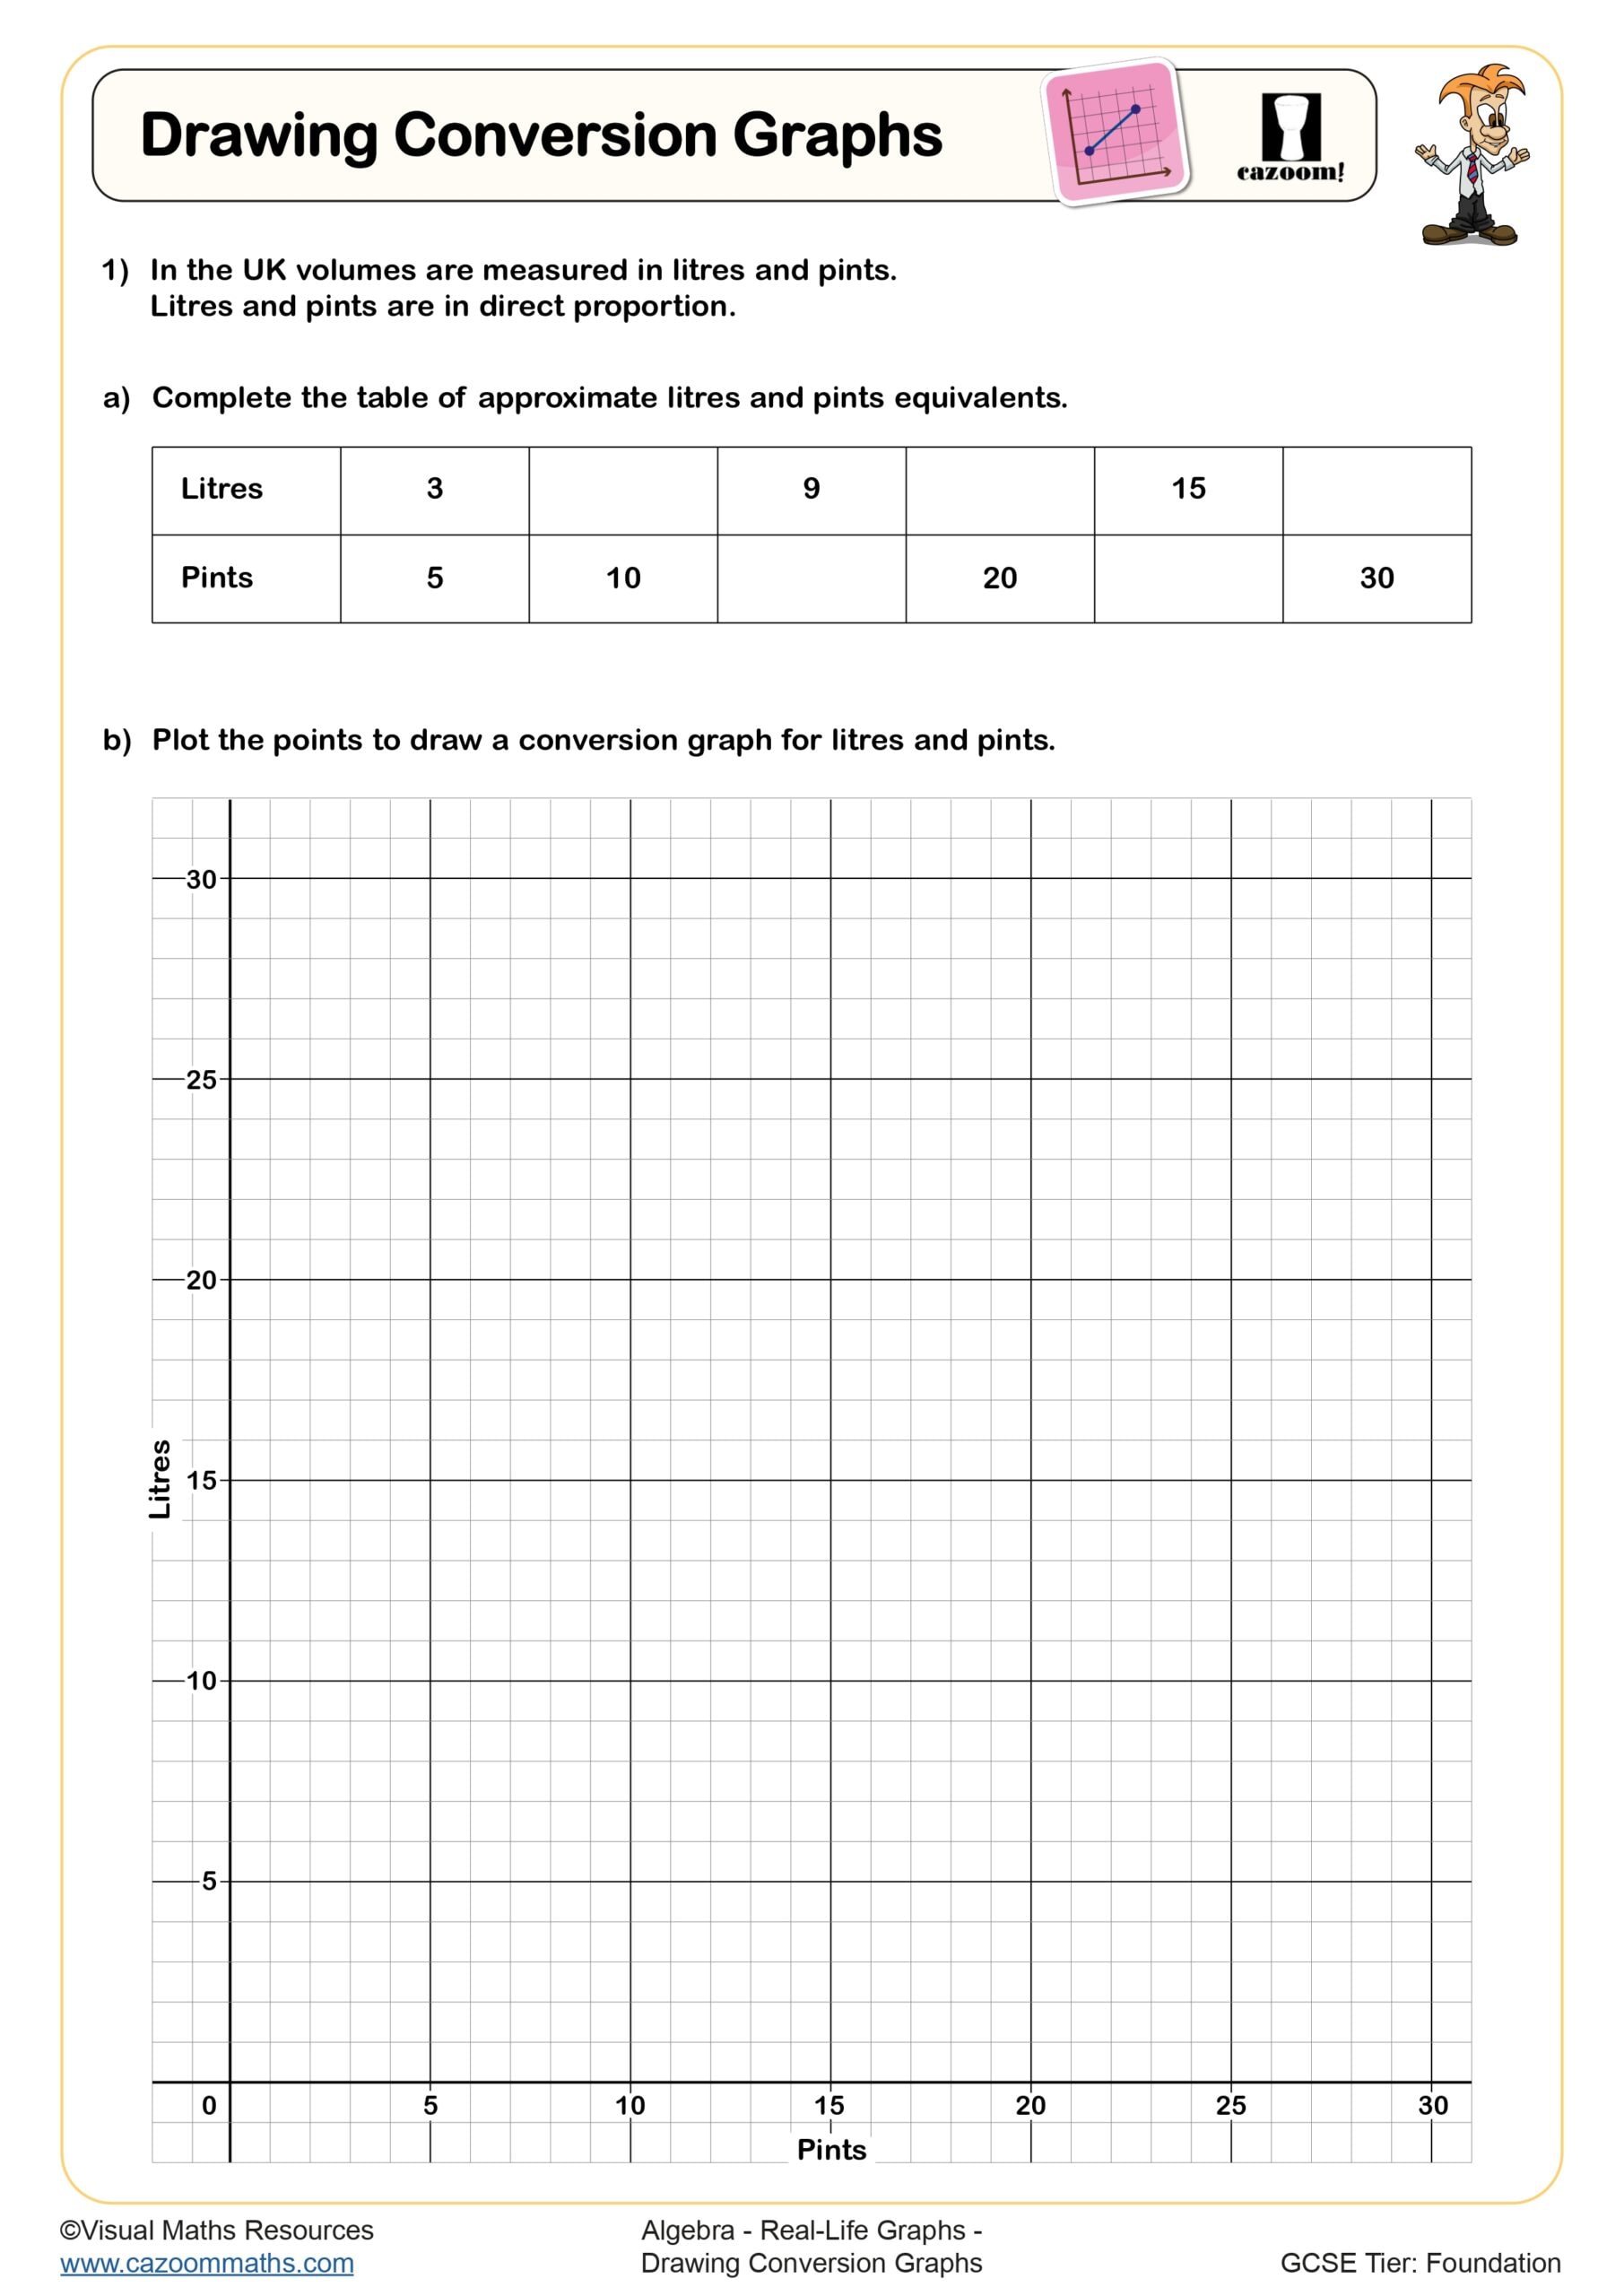
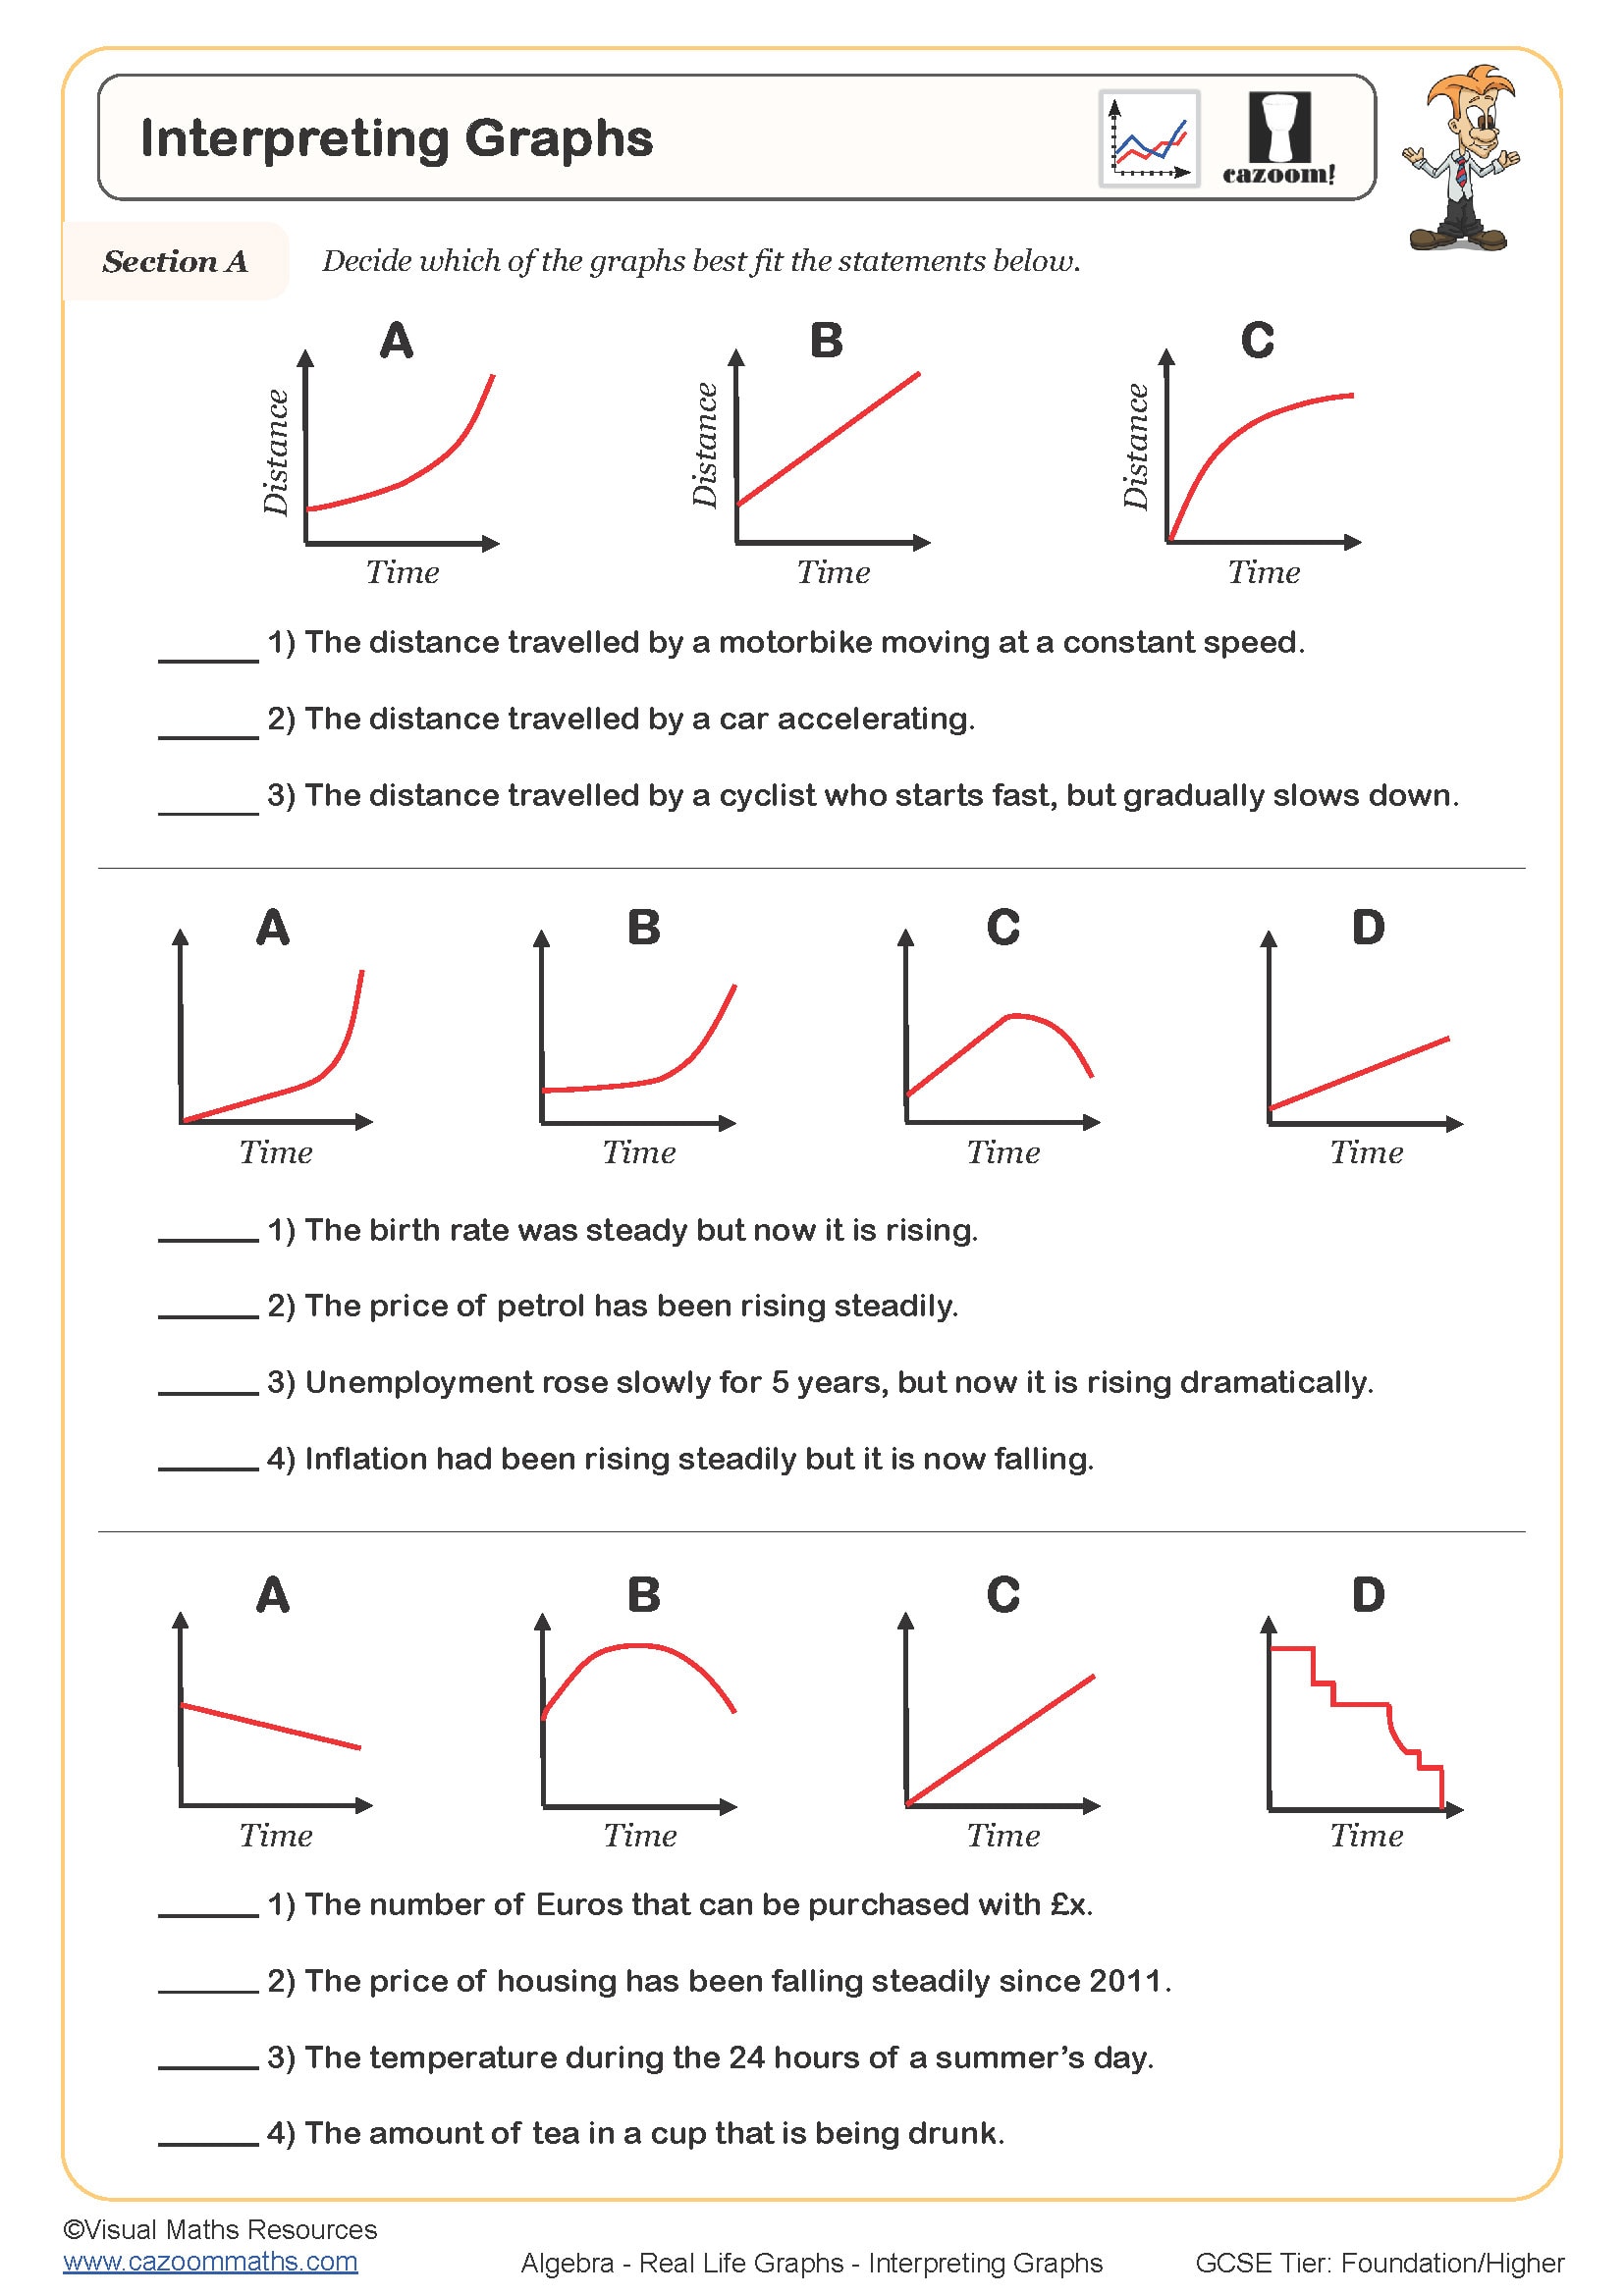
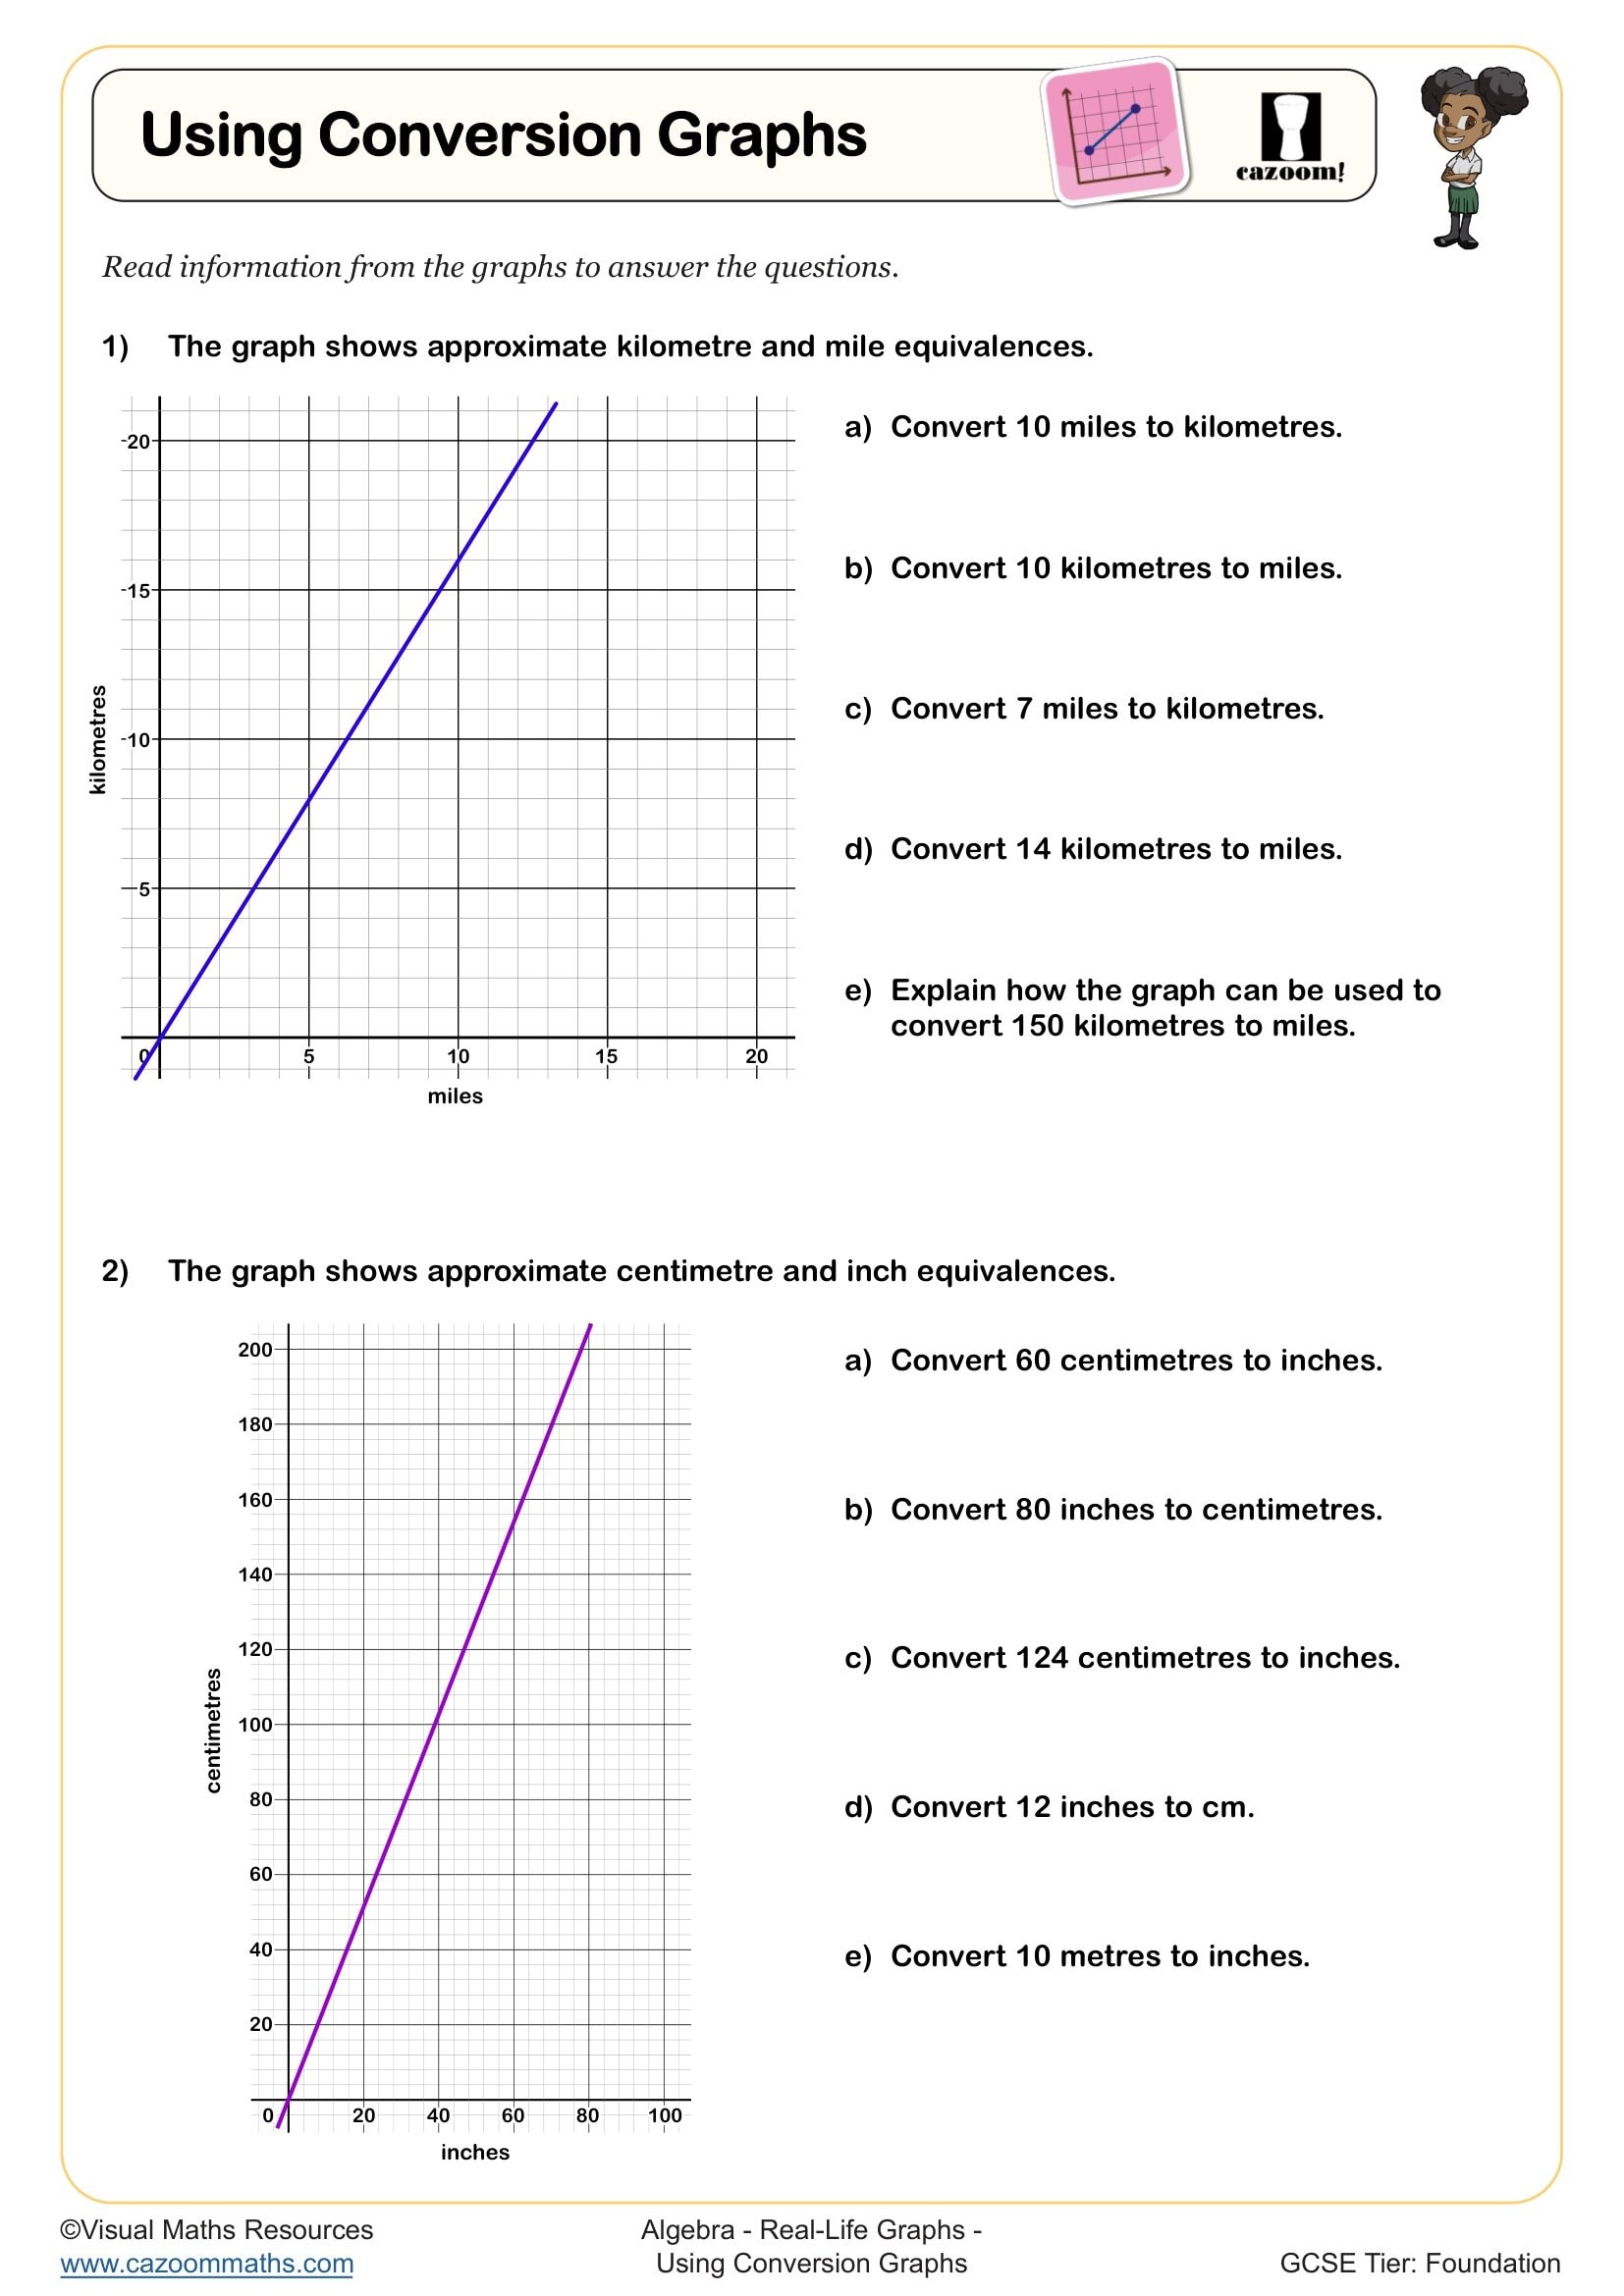
An effective real life graph worksheet focuses on contexts that students can relate to whilst developing their understanding of gradient, intercepts, and rates of change within the Key Stage 3 algebra curriculum. The scenarios should progress from simple interpretations to more complex analysis of what different graph features represent in practical situations.
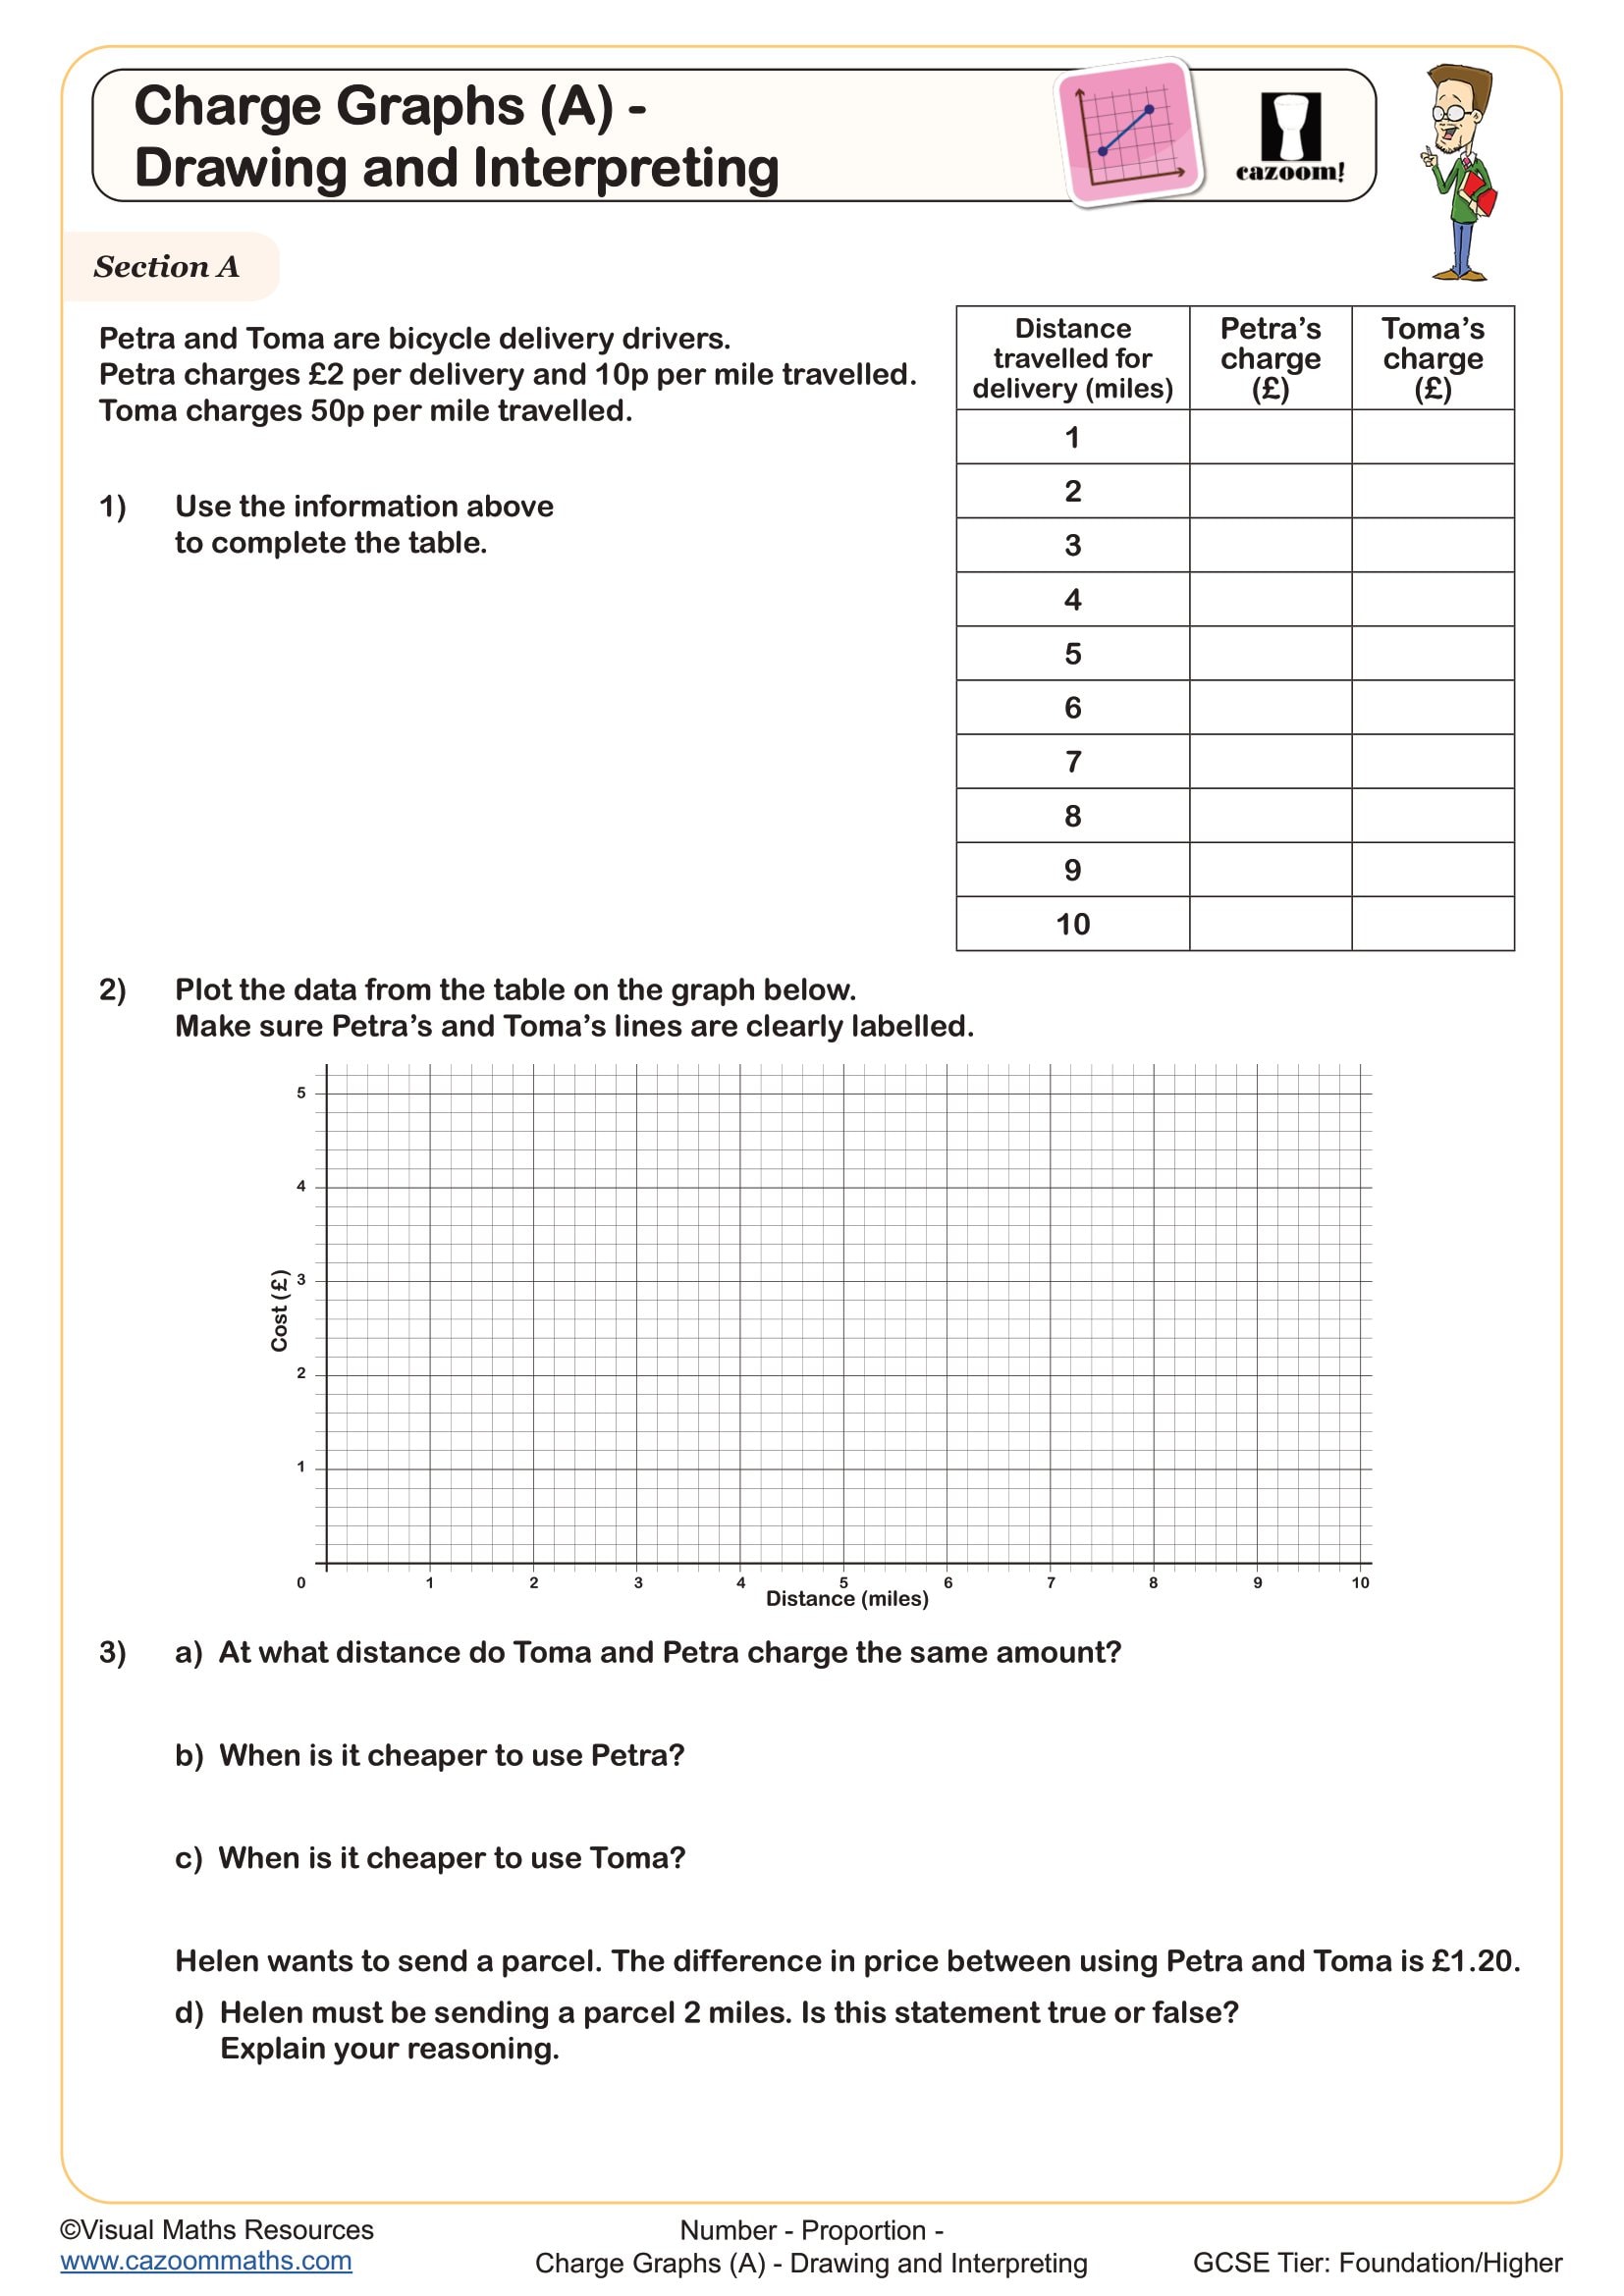
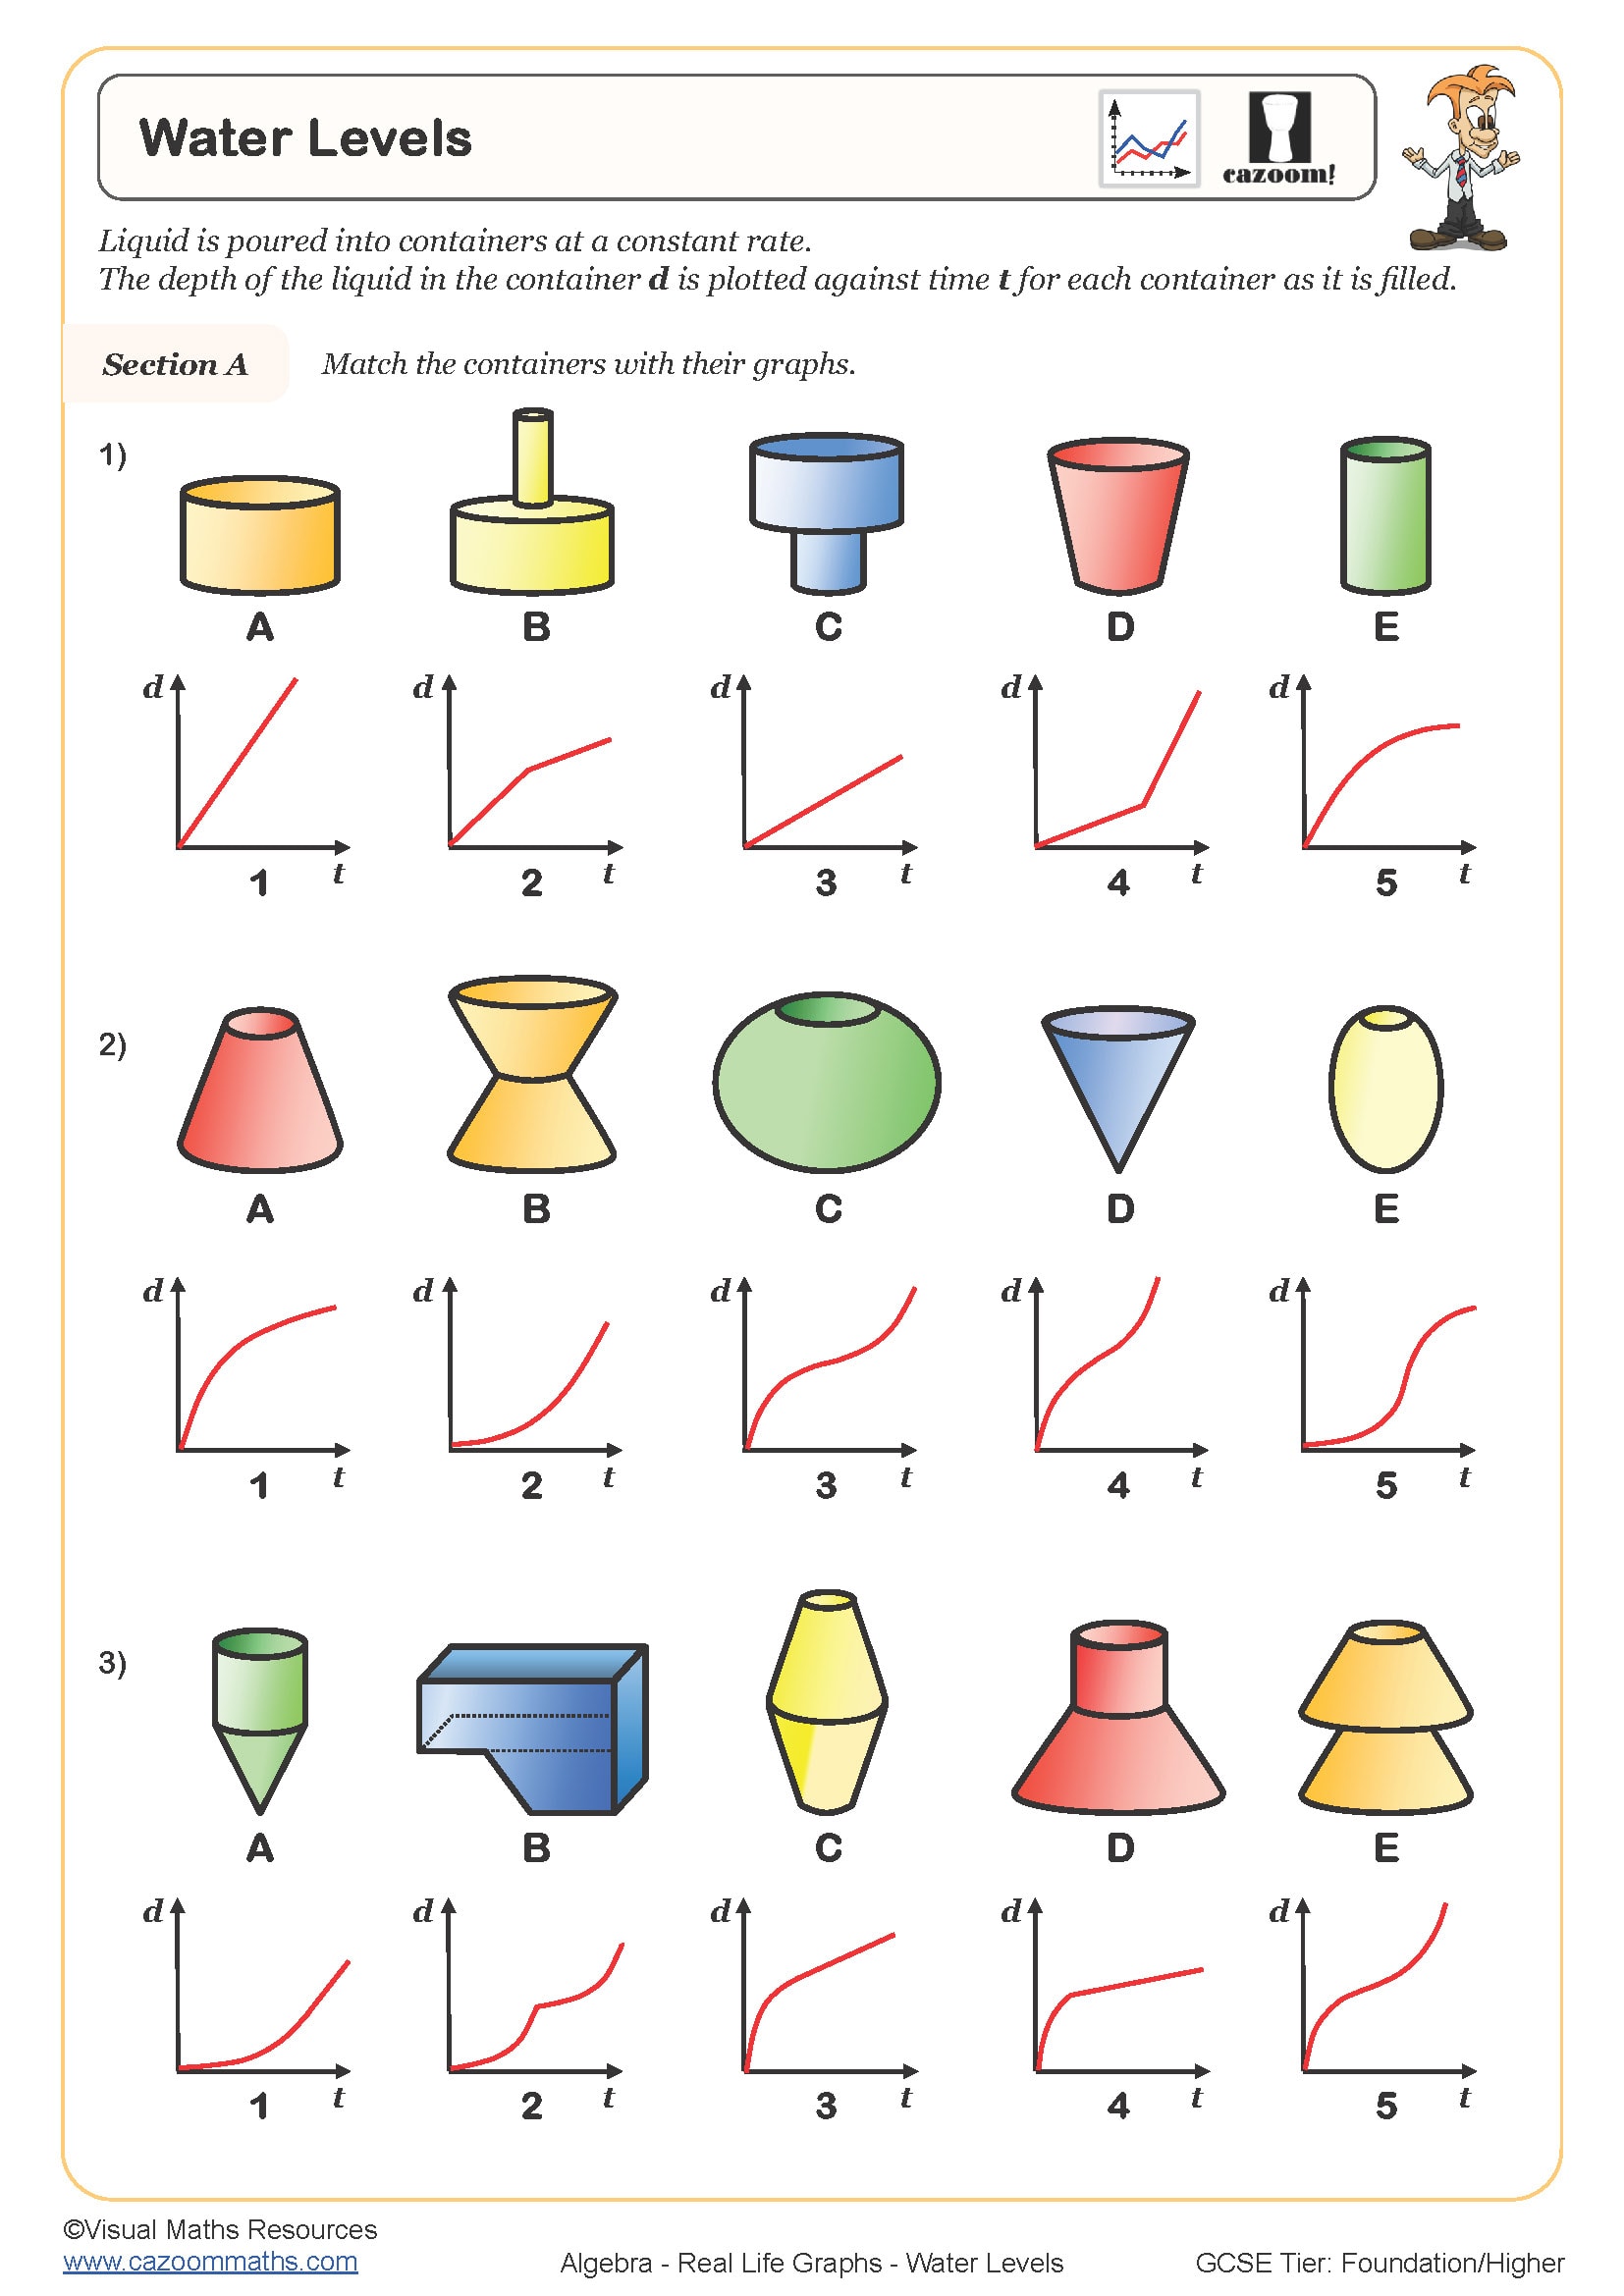
Teachers find that students respond well when worksheets include familiar contexts like mobile phone charges, journey graphs, or bath filling scenarios. However, many students initially read graphs like text, moving left to right, rather than considering the relationship between variables. Effective worksheets address this by including questions that specifically ask students to explain what different sections of the graph represent.
Which year groups benefit most from graphs in real life practice?
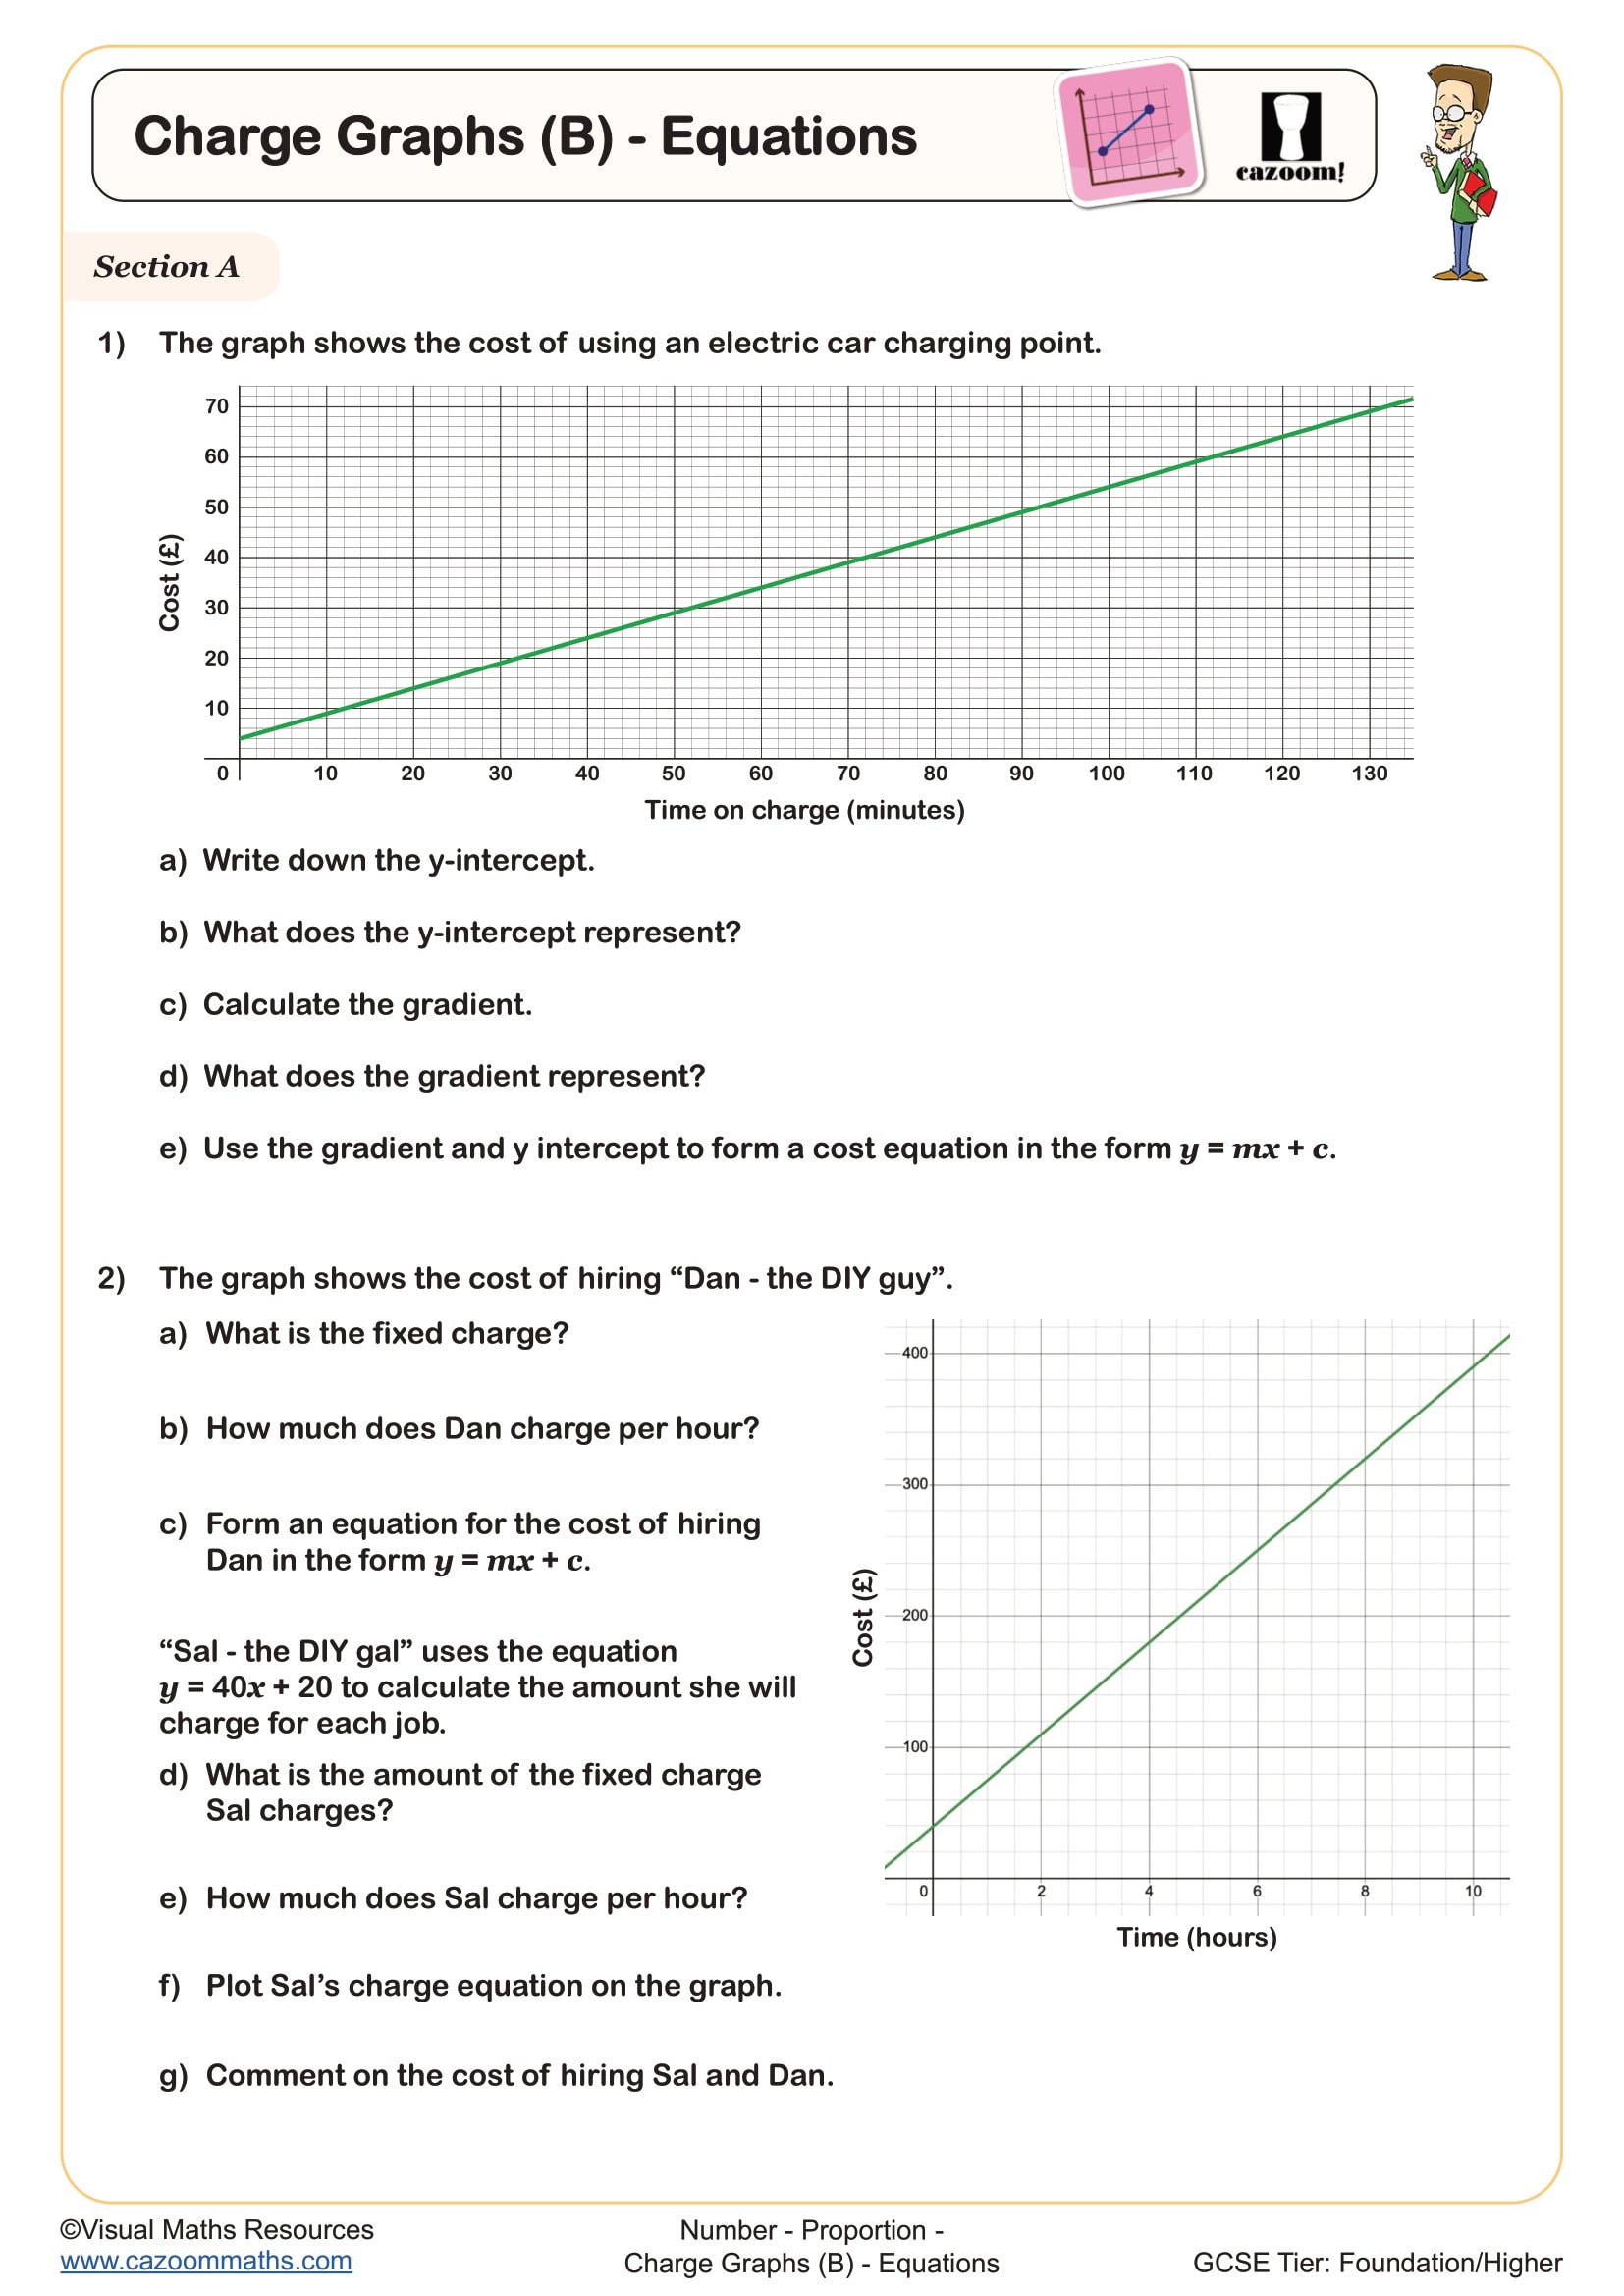
Year 9 students typically encounter real life graphs as part of their linear graphs work, building on coordinate geometry from Year 8. At this stage, students have sufficient algebraic understanding to interpret gradient and y-intercept in context, making connections between mathematical representations and practical meaning.
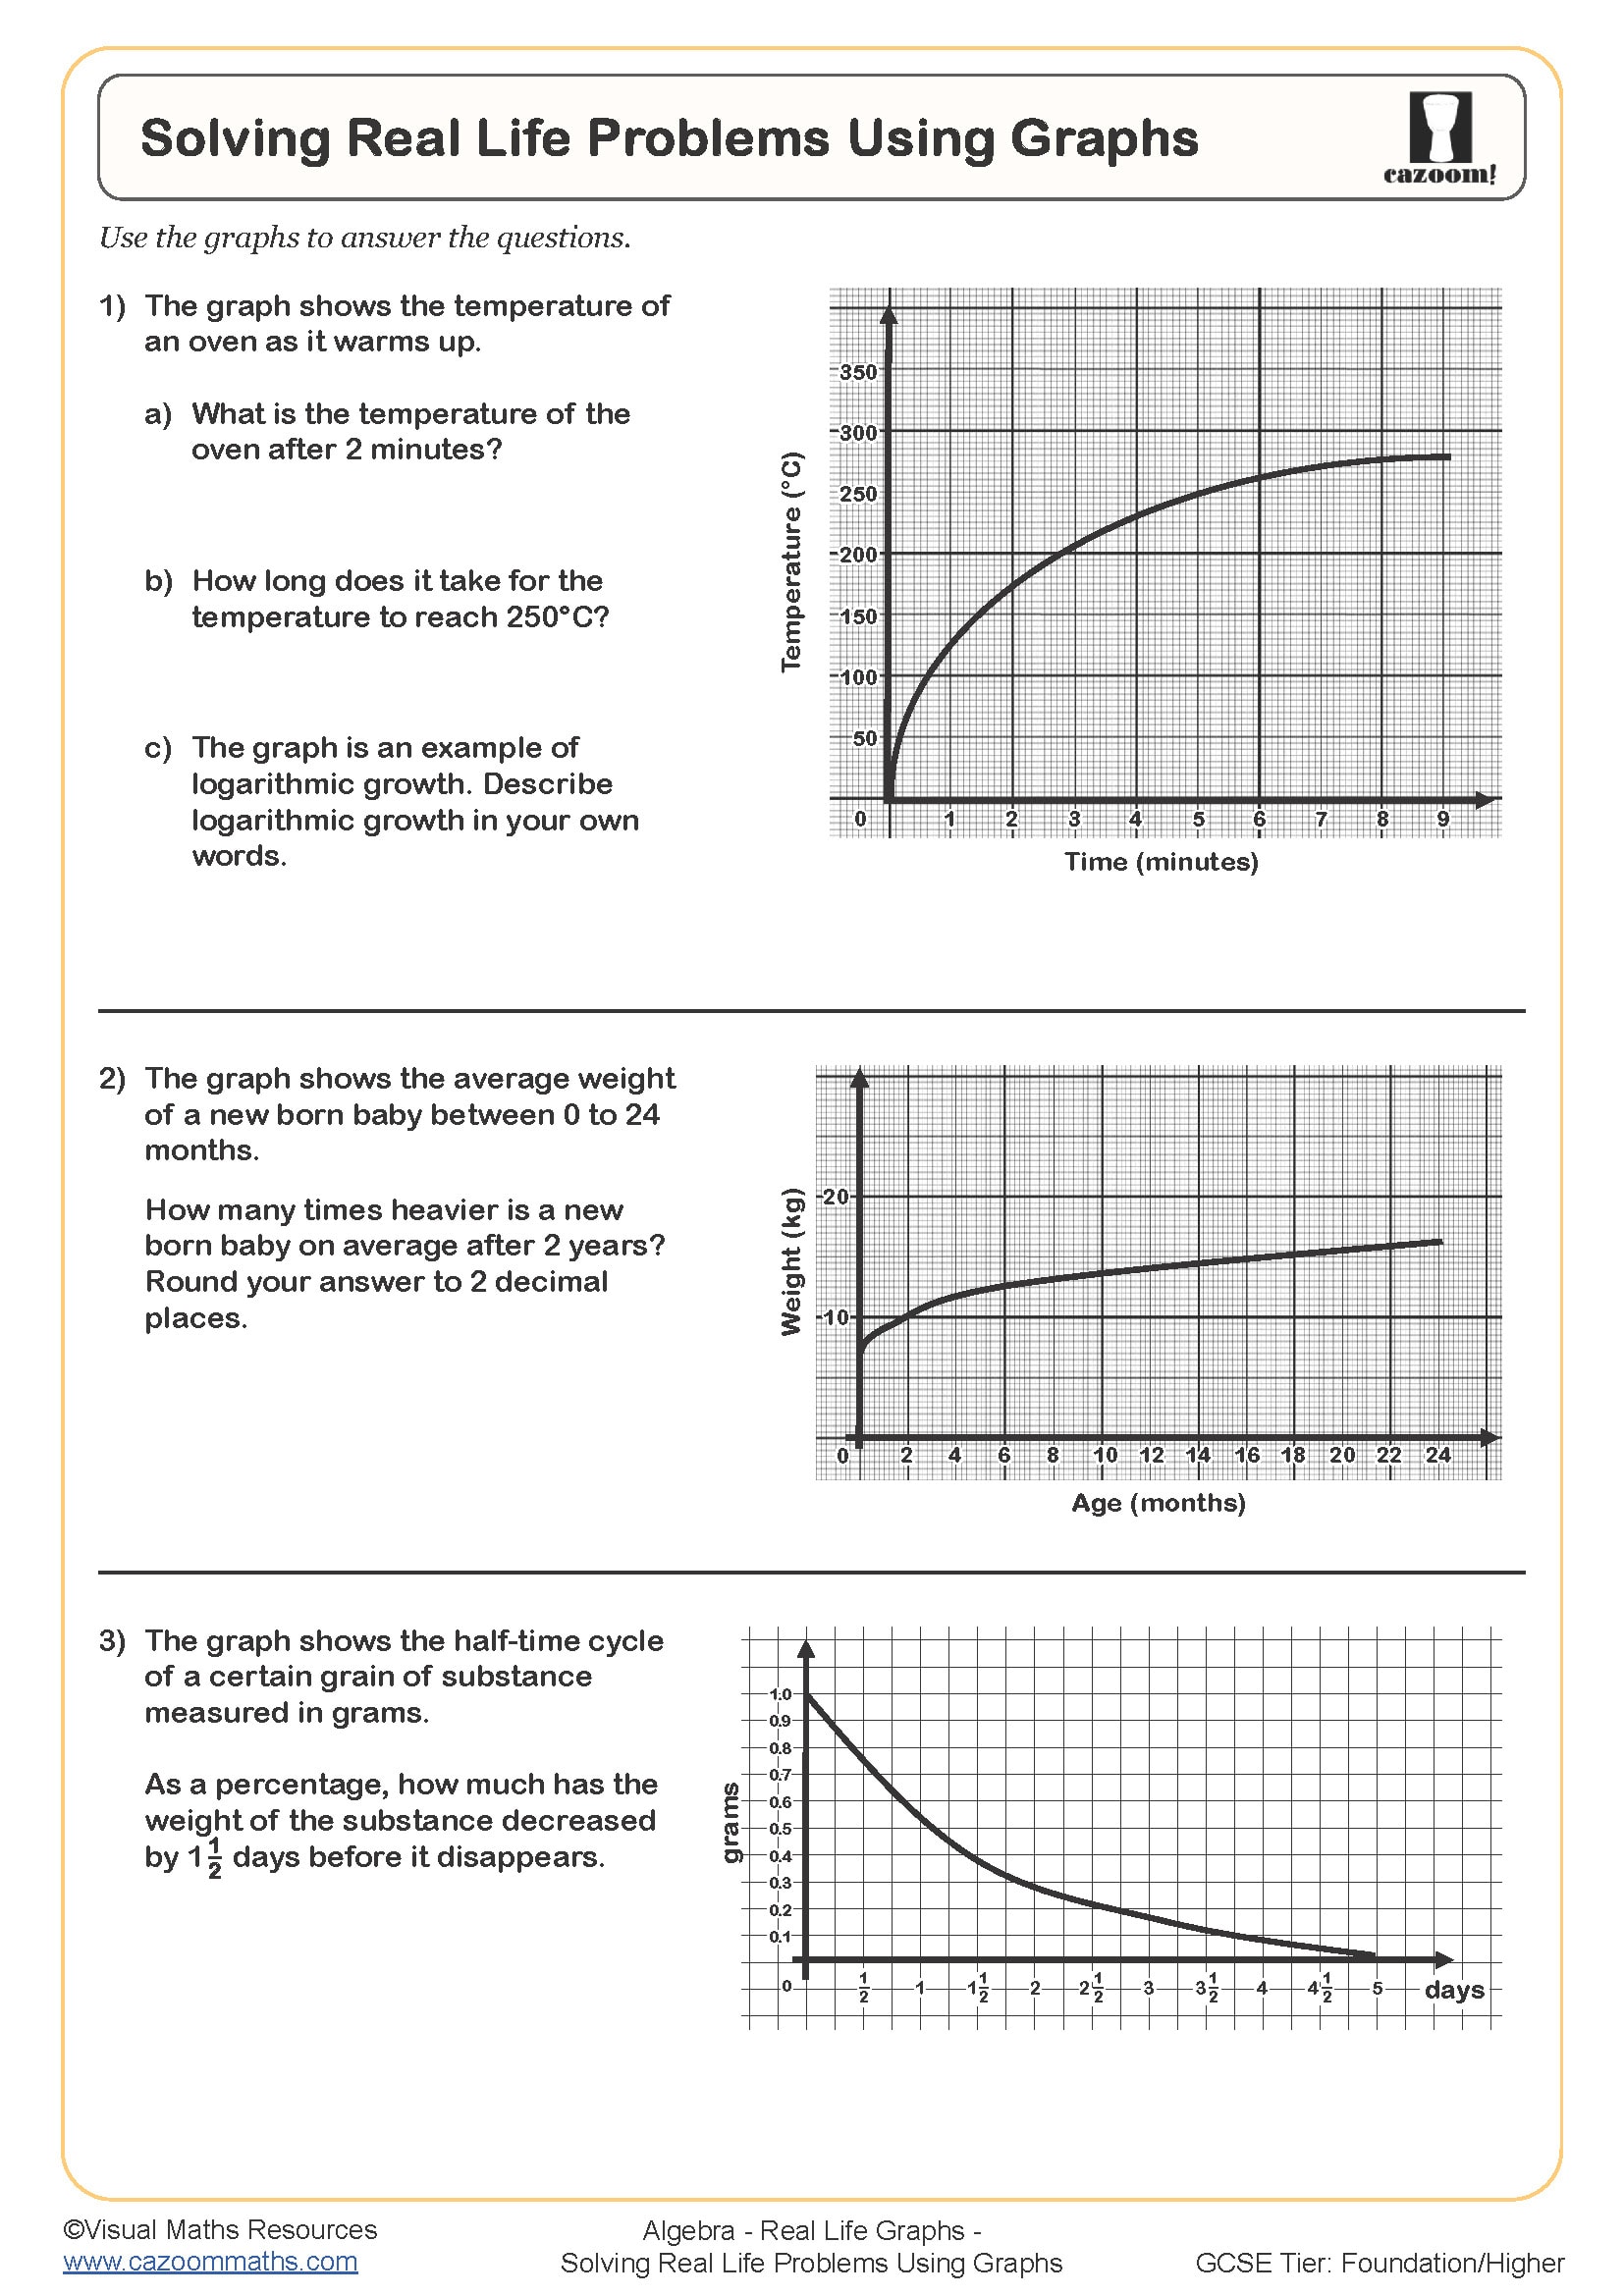
Year 10 students revisit these concepts when preparing for GCSE, often with more sophisticated scenarios involving quadratic or exponential relationships. Teachers observe that students who struggled with abstract linear graphs in Year 8 often show improved understanding when the same concepts are presented through real-world contexts, as the practical meaning helps them remember which variable goes on which axis.
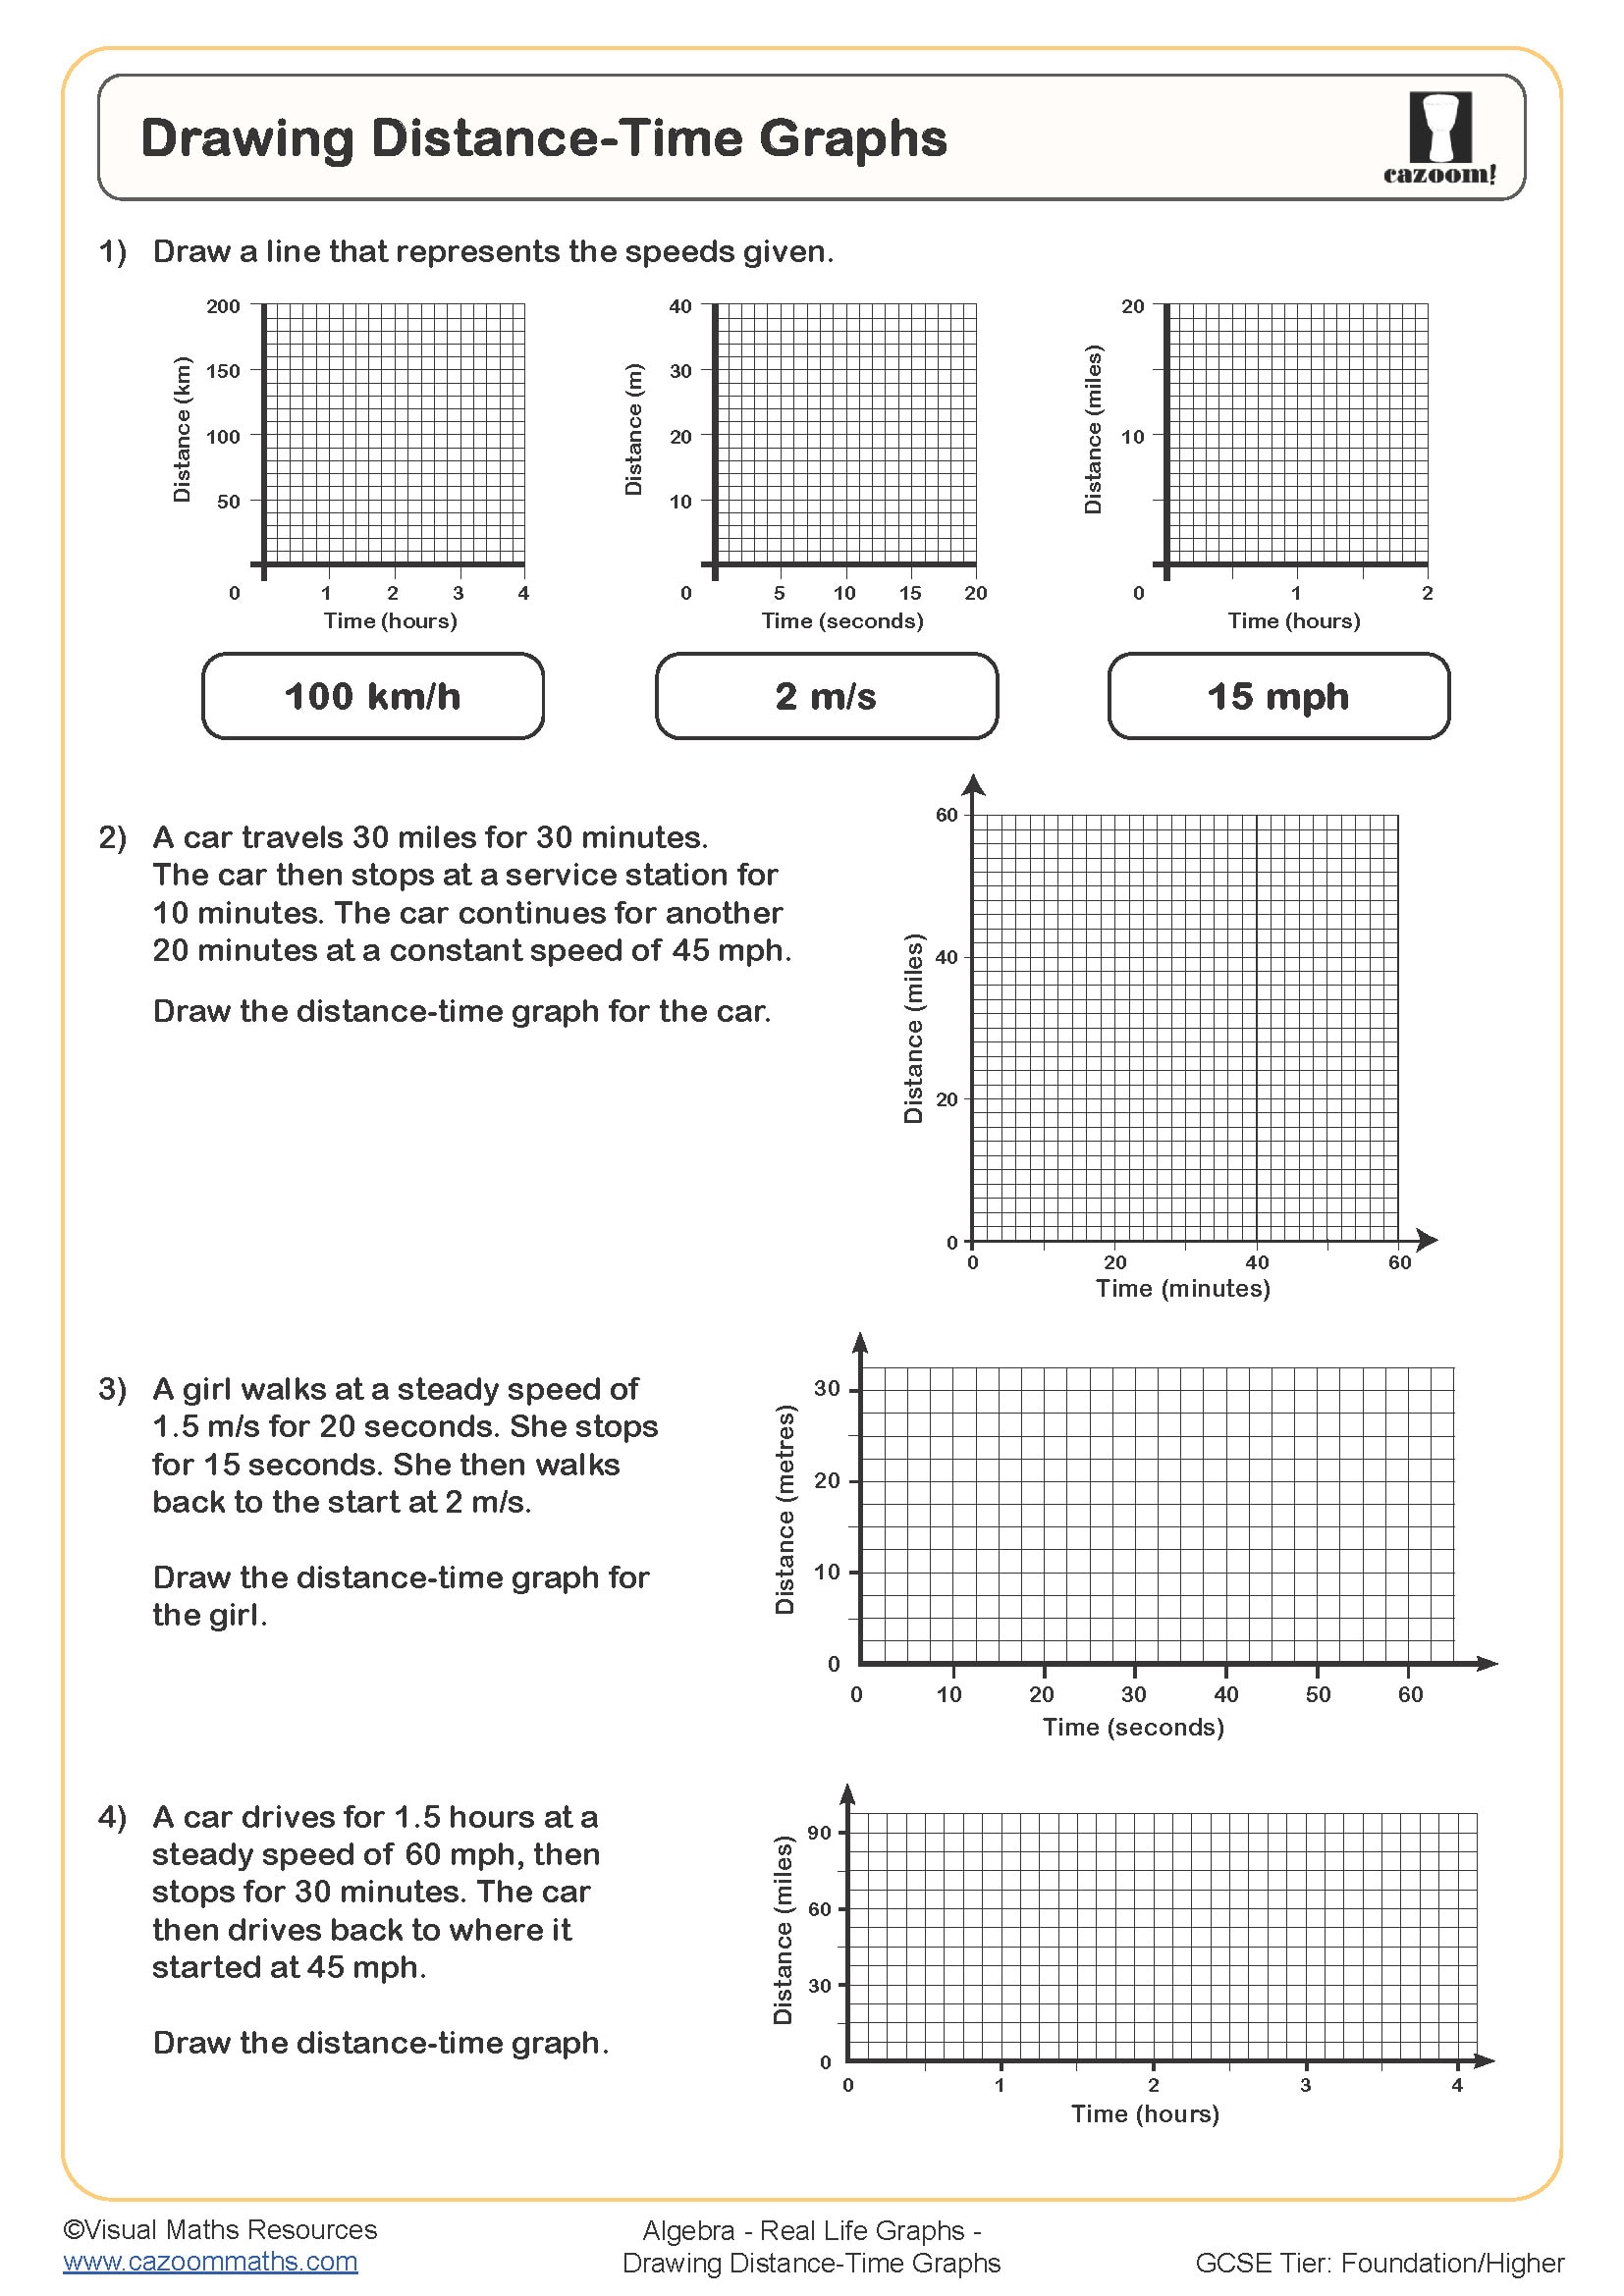
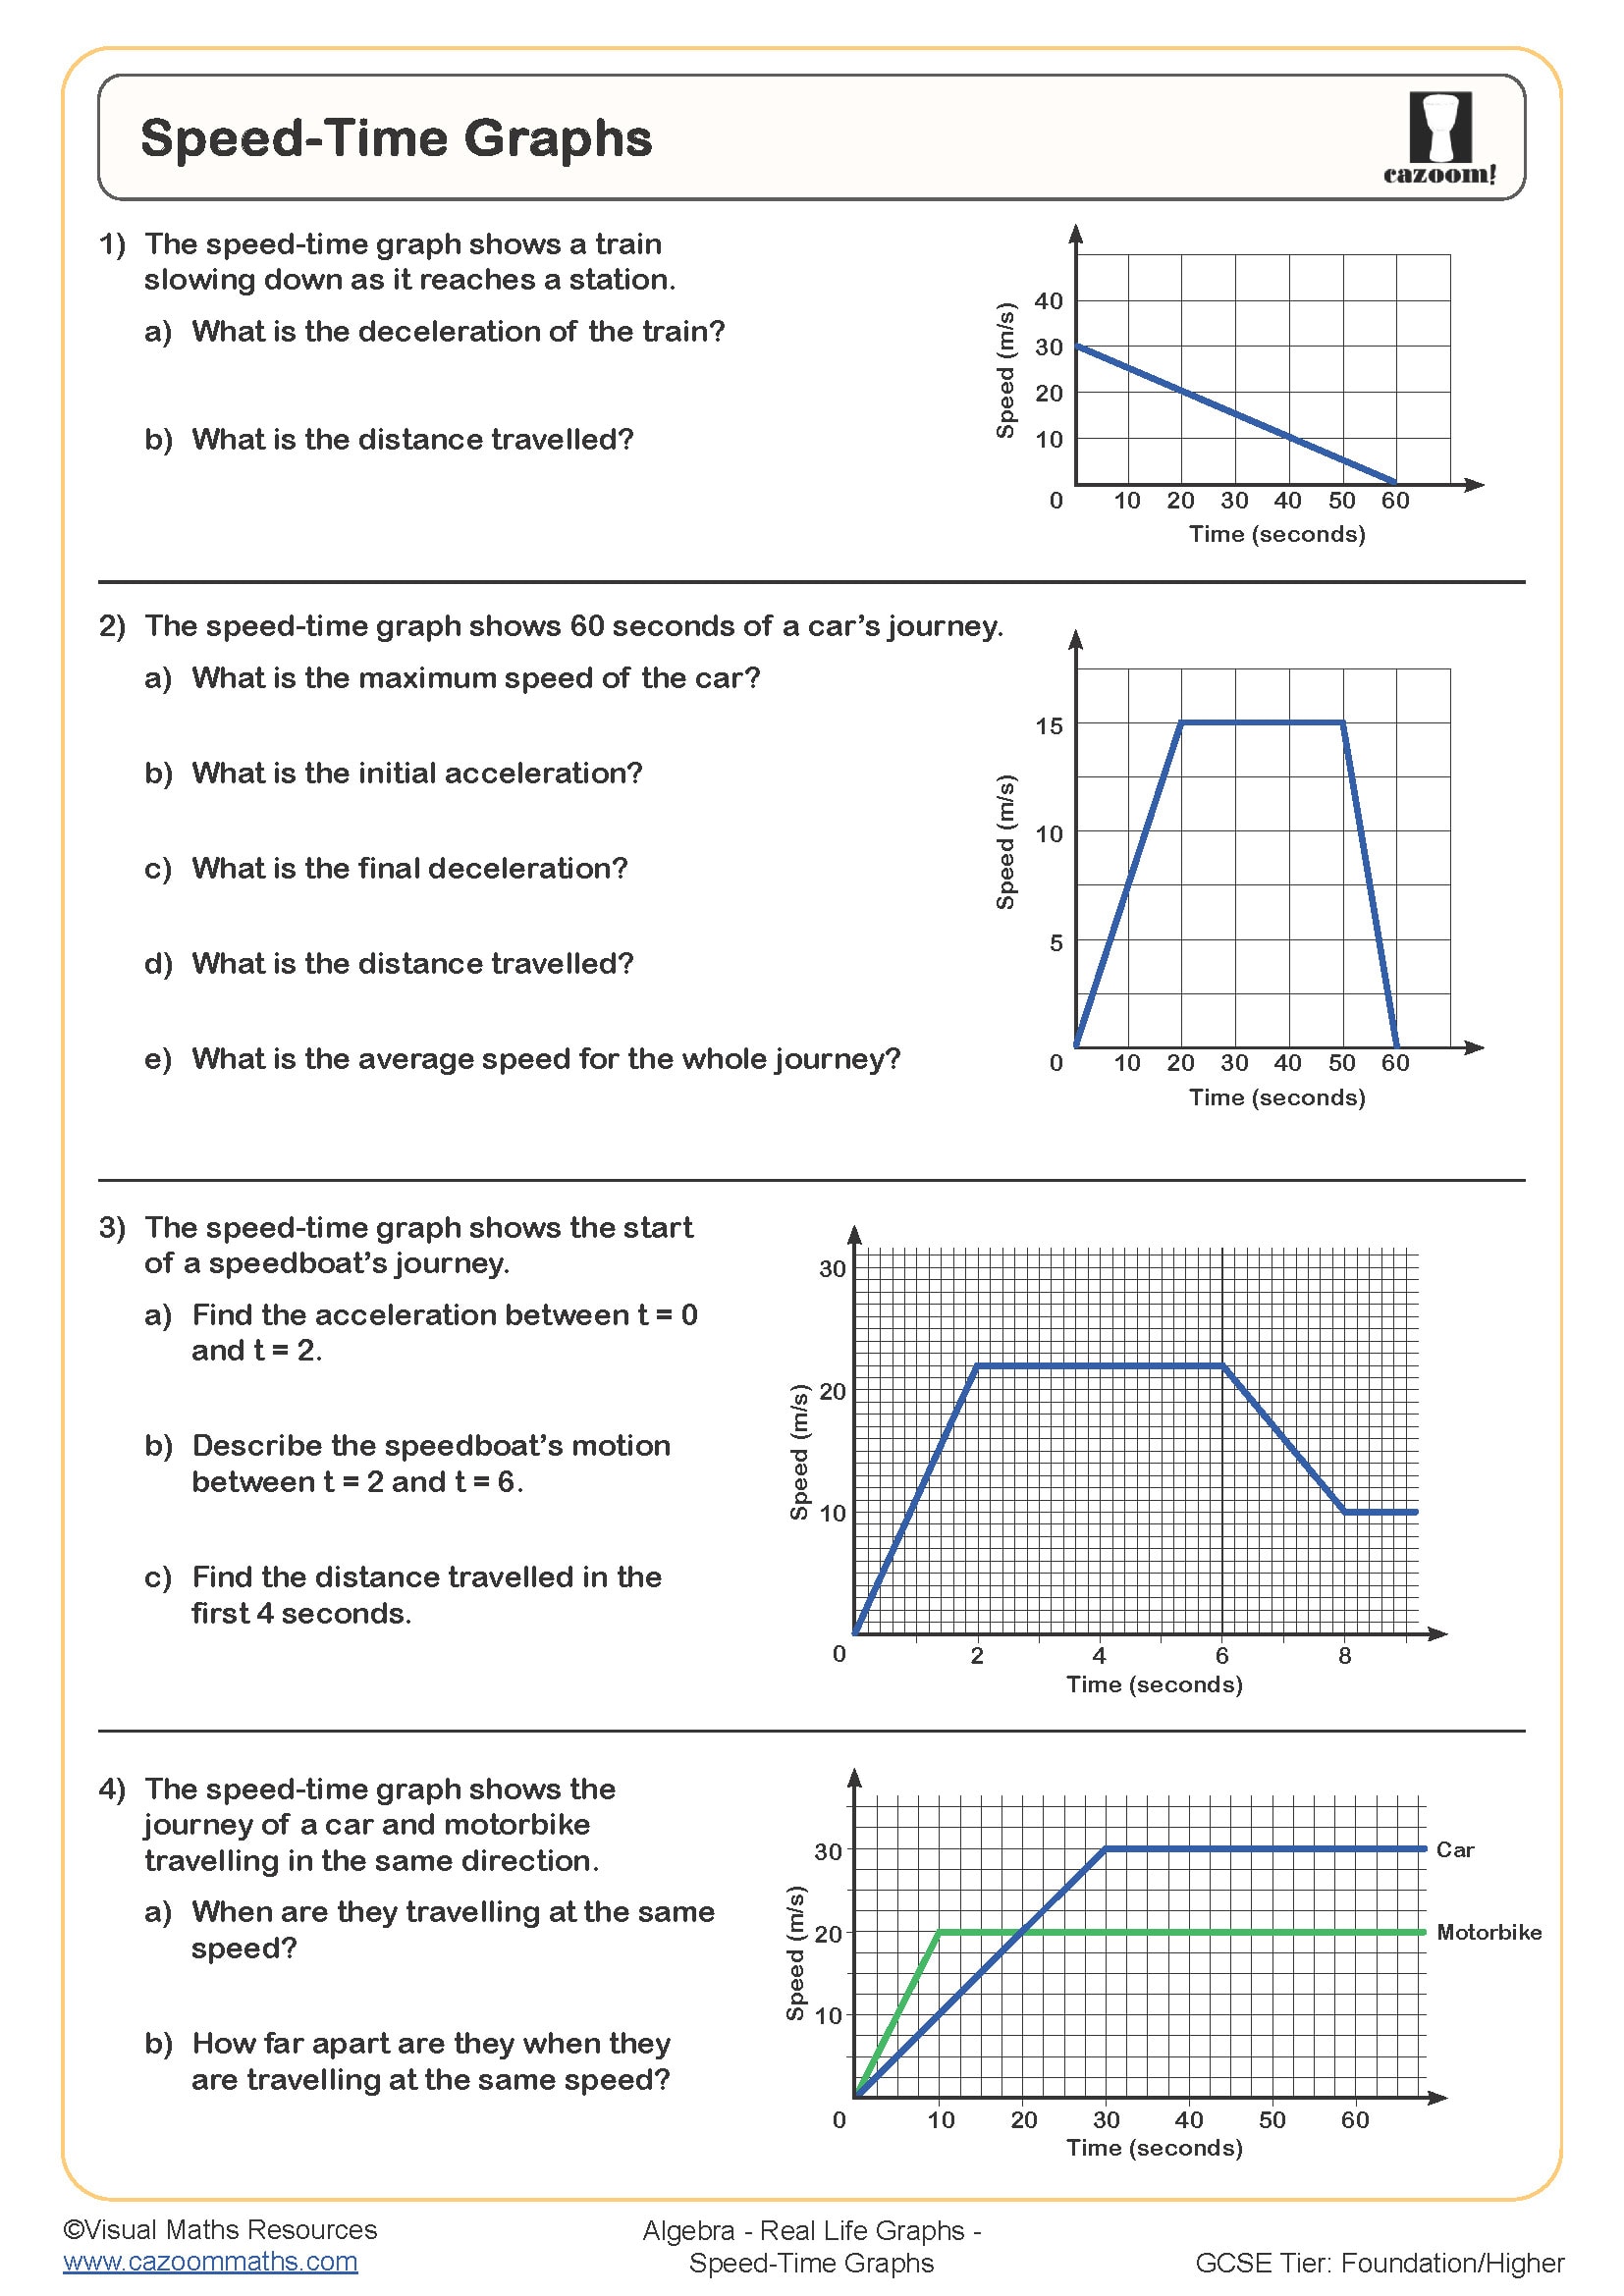
How do distance-time graphs challenge students differently from other real life graphs?
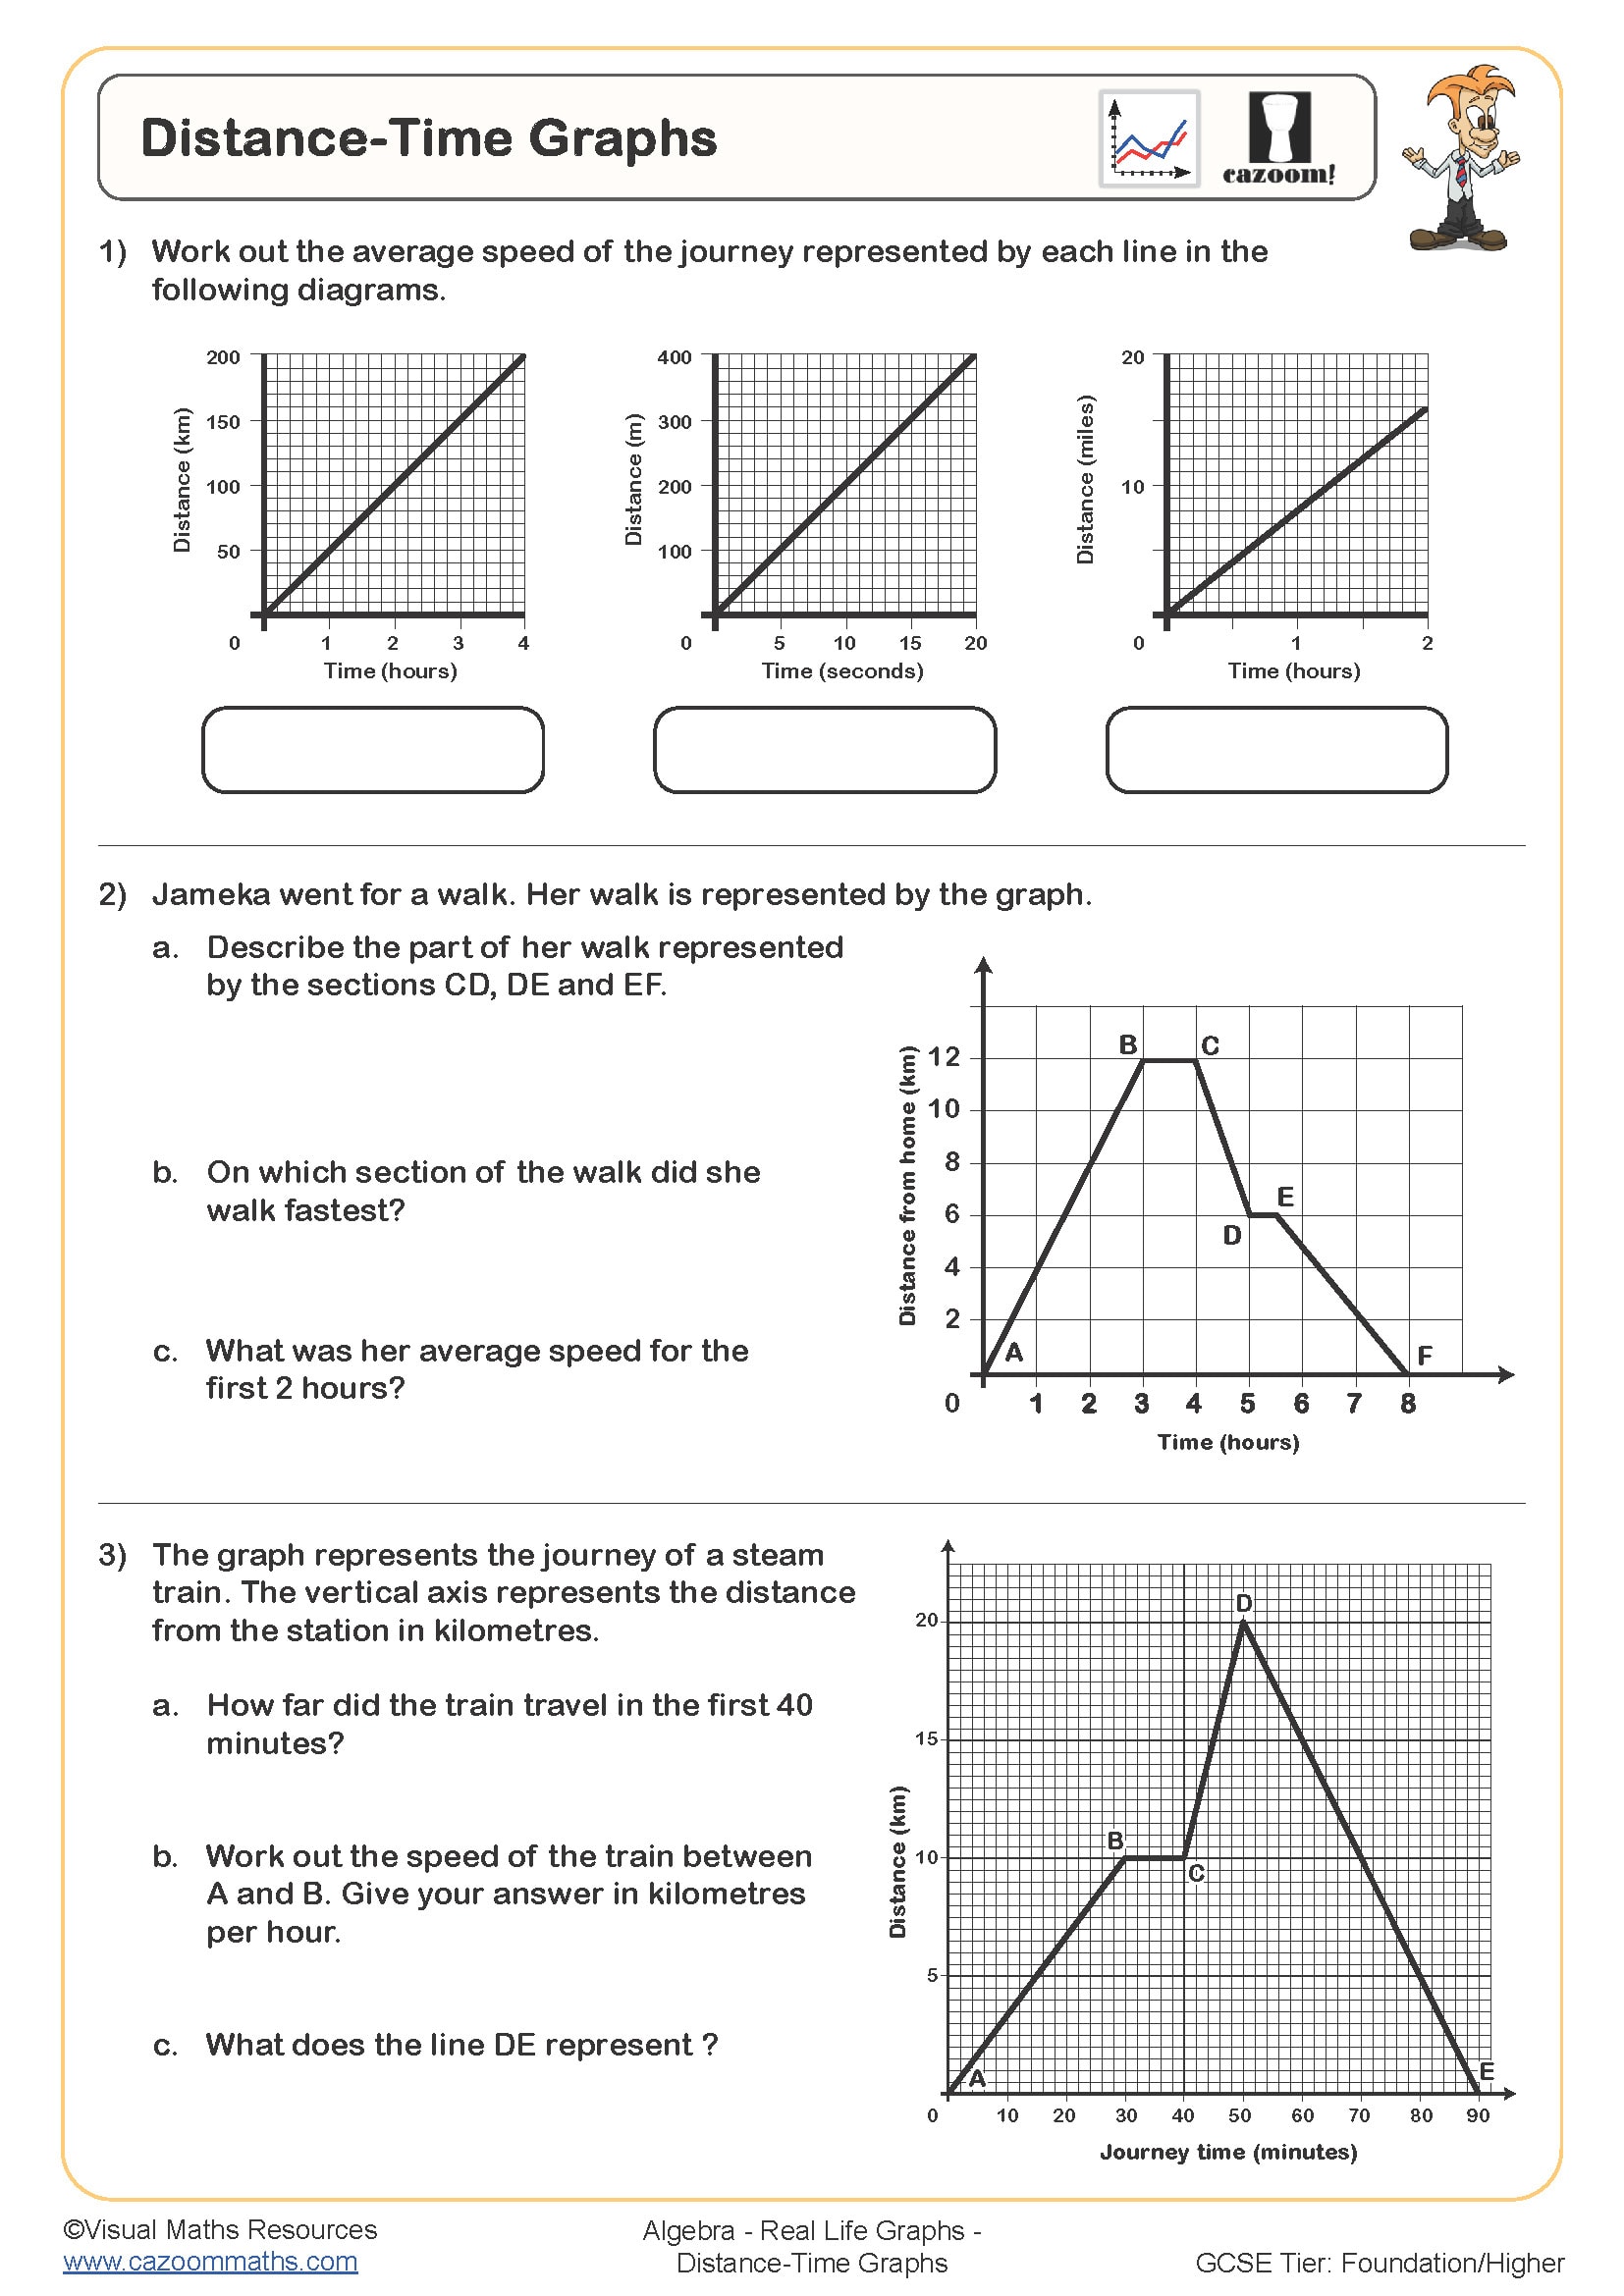
Distance-time graphs present unique challenges because students must interpret horizontal lines as stationary periods and understand that gradient represents speed rather than distance travelled. Many students incorrectly assume that a line going down means moving backwards, when it actually indicates returning towards the starting point.
Teachers frequently observe students struggling with the concept that steeper gradients mean faster speeds, not greater distances. A common error involves misreading graphs where someone travels away from home then returns, with students thinking the person has travelled negative distances. Effective practice includes scenarios like walking to shops and back, where the physical journey helps students understand why the graph shows distance from home rather than total distance travelled.
How can teachers use these worksheets to address common misconceptions?
Teachers find success by having students describe what's happening in each section of a graph before attempting calculations. This approach helps identify whether students understand the context before they engage with the mathematical content. Starting lessons with a simple scenario and building the graph together often prevents misunderstandings about axis labels and scales.
Many teachers use a 'story first' approach where students hear about a journey or situation, then predict what the graph might look like before seeing the actual graph. This method helps students connect the physical reality with the mathematical representation. The answer sheets become particularly valuable for peer assessment activities, allowing students to discuss different interpretations and correct misconceptions through collaborative learning.