GCSE Foundation Real Life Graphs Revision Worksheets
All worksheets are created by the team of experienced teachers at Cazoom Maths.
What Real Life Graphs questions appear on the GCSE Foundation paper?
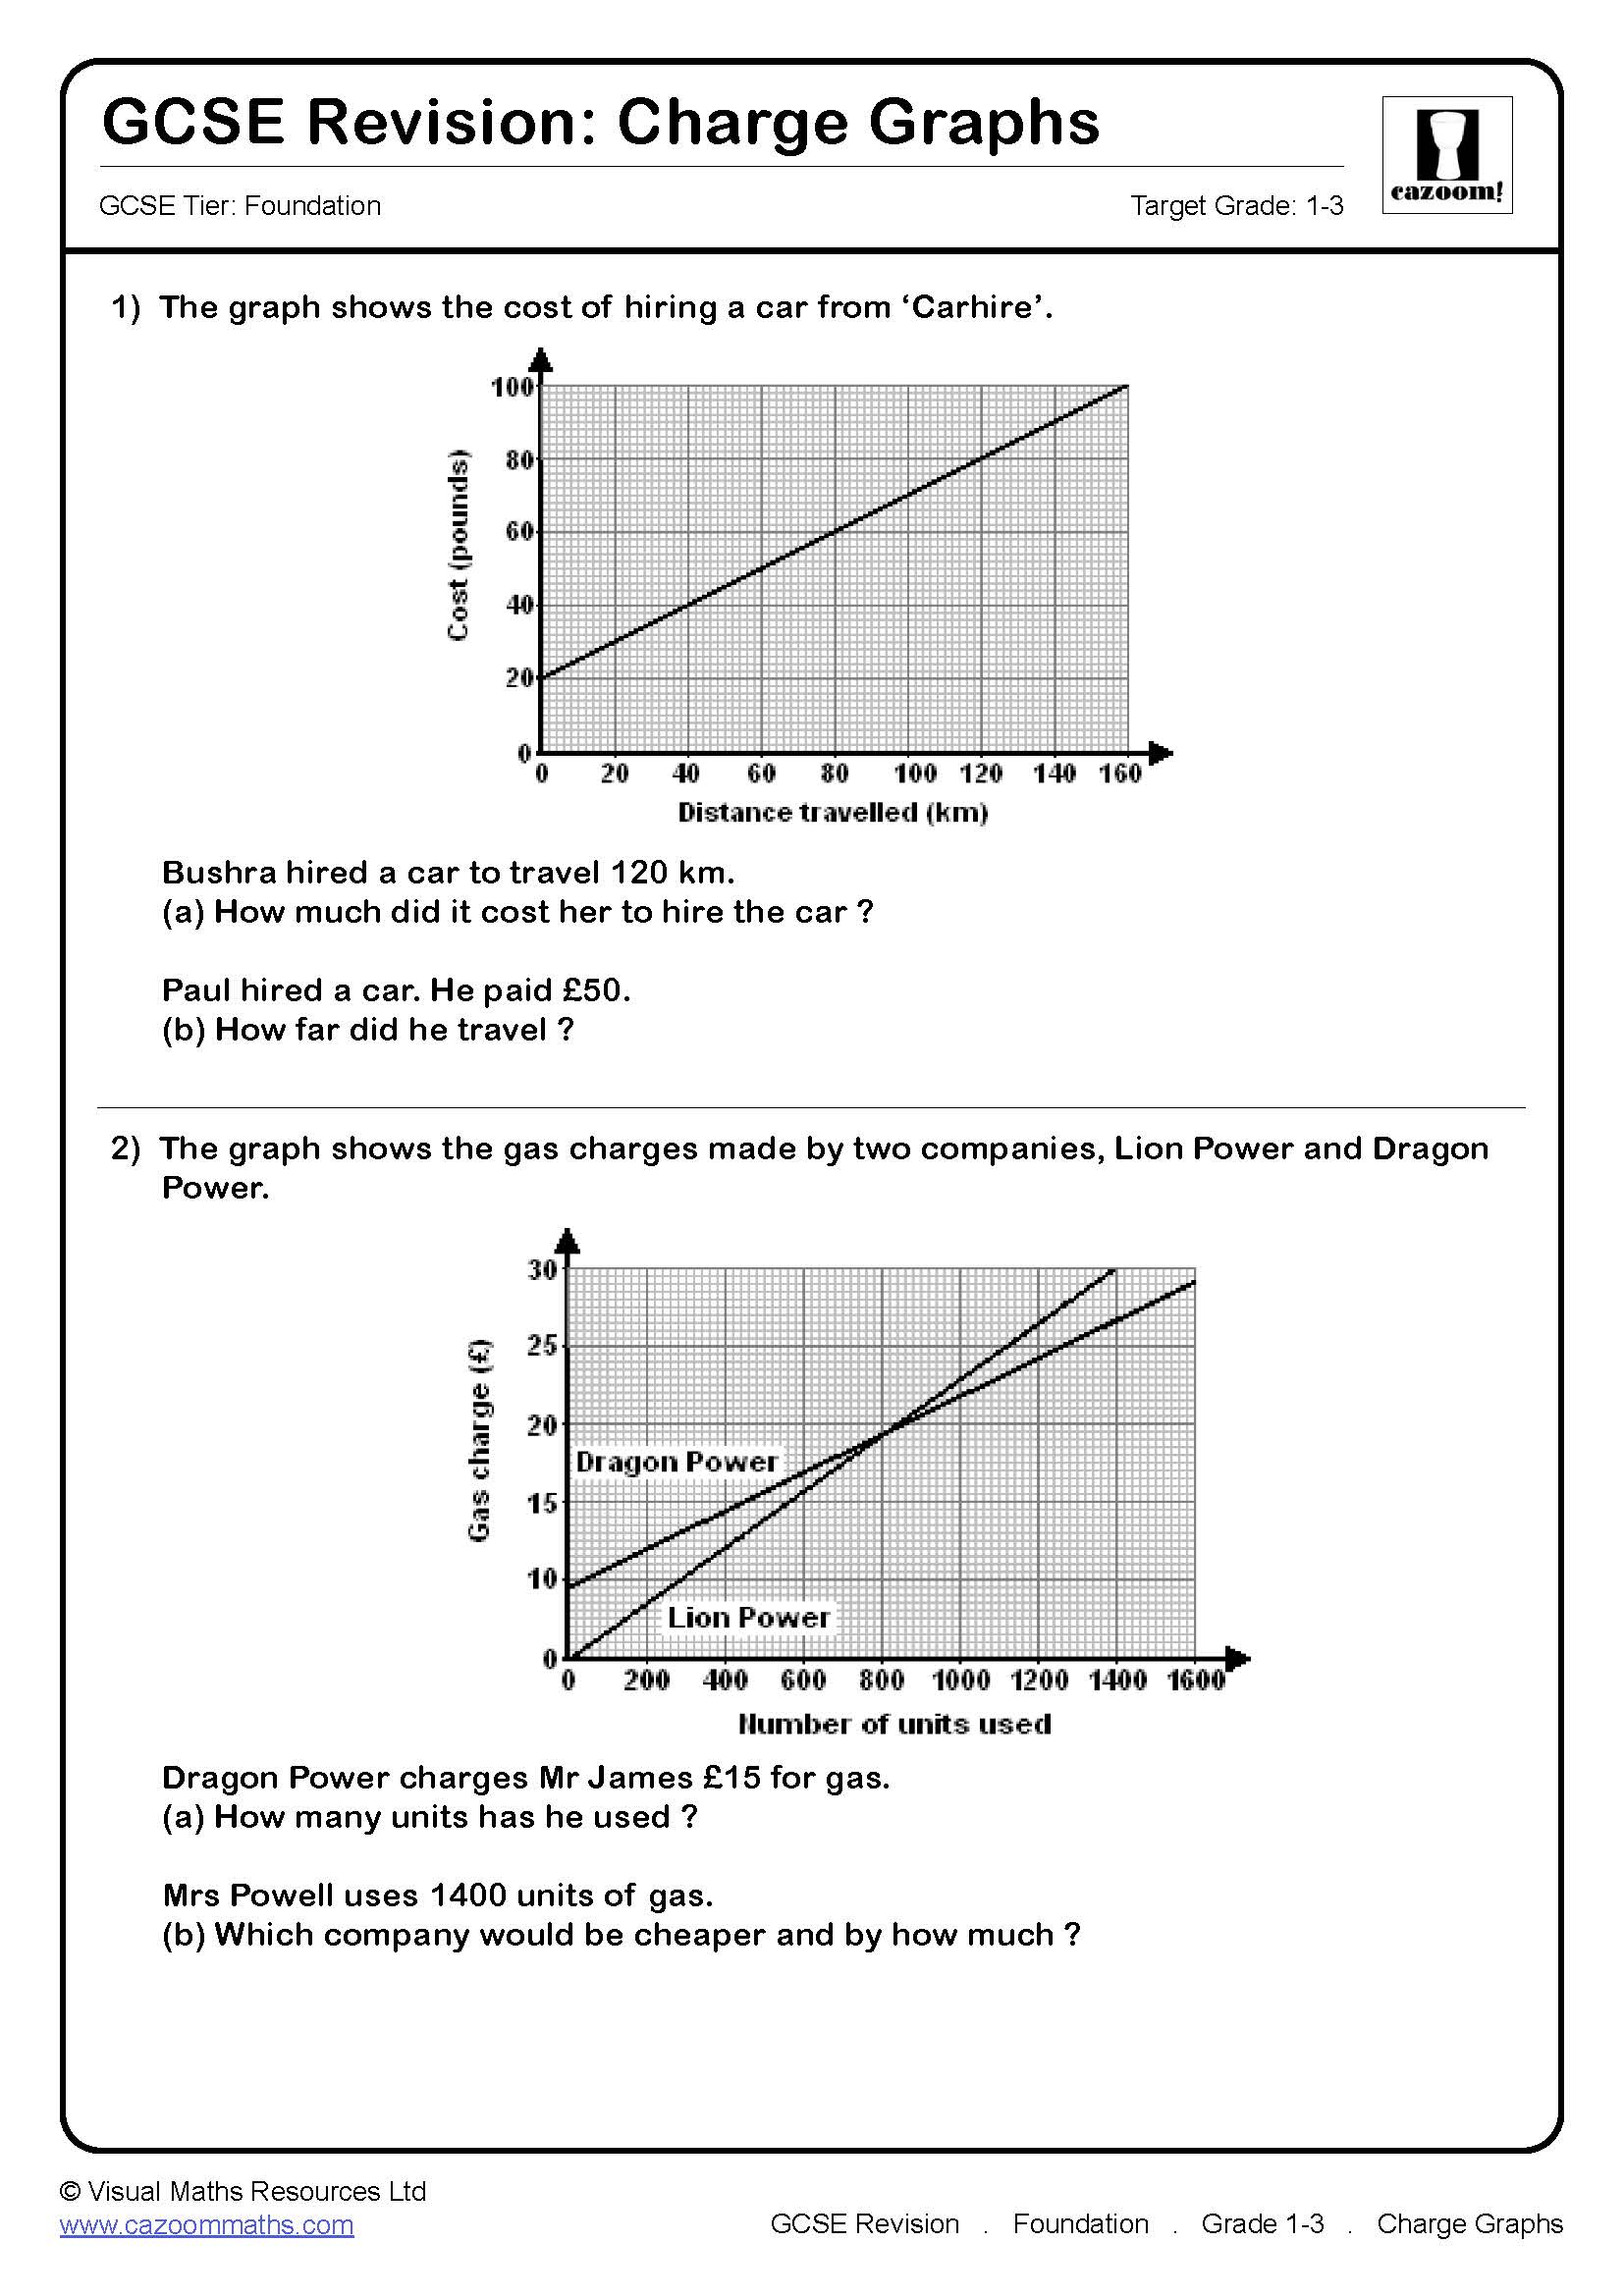
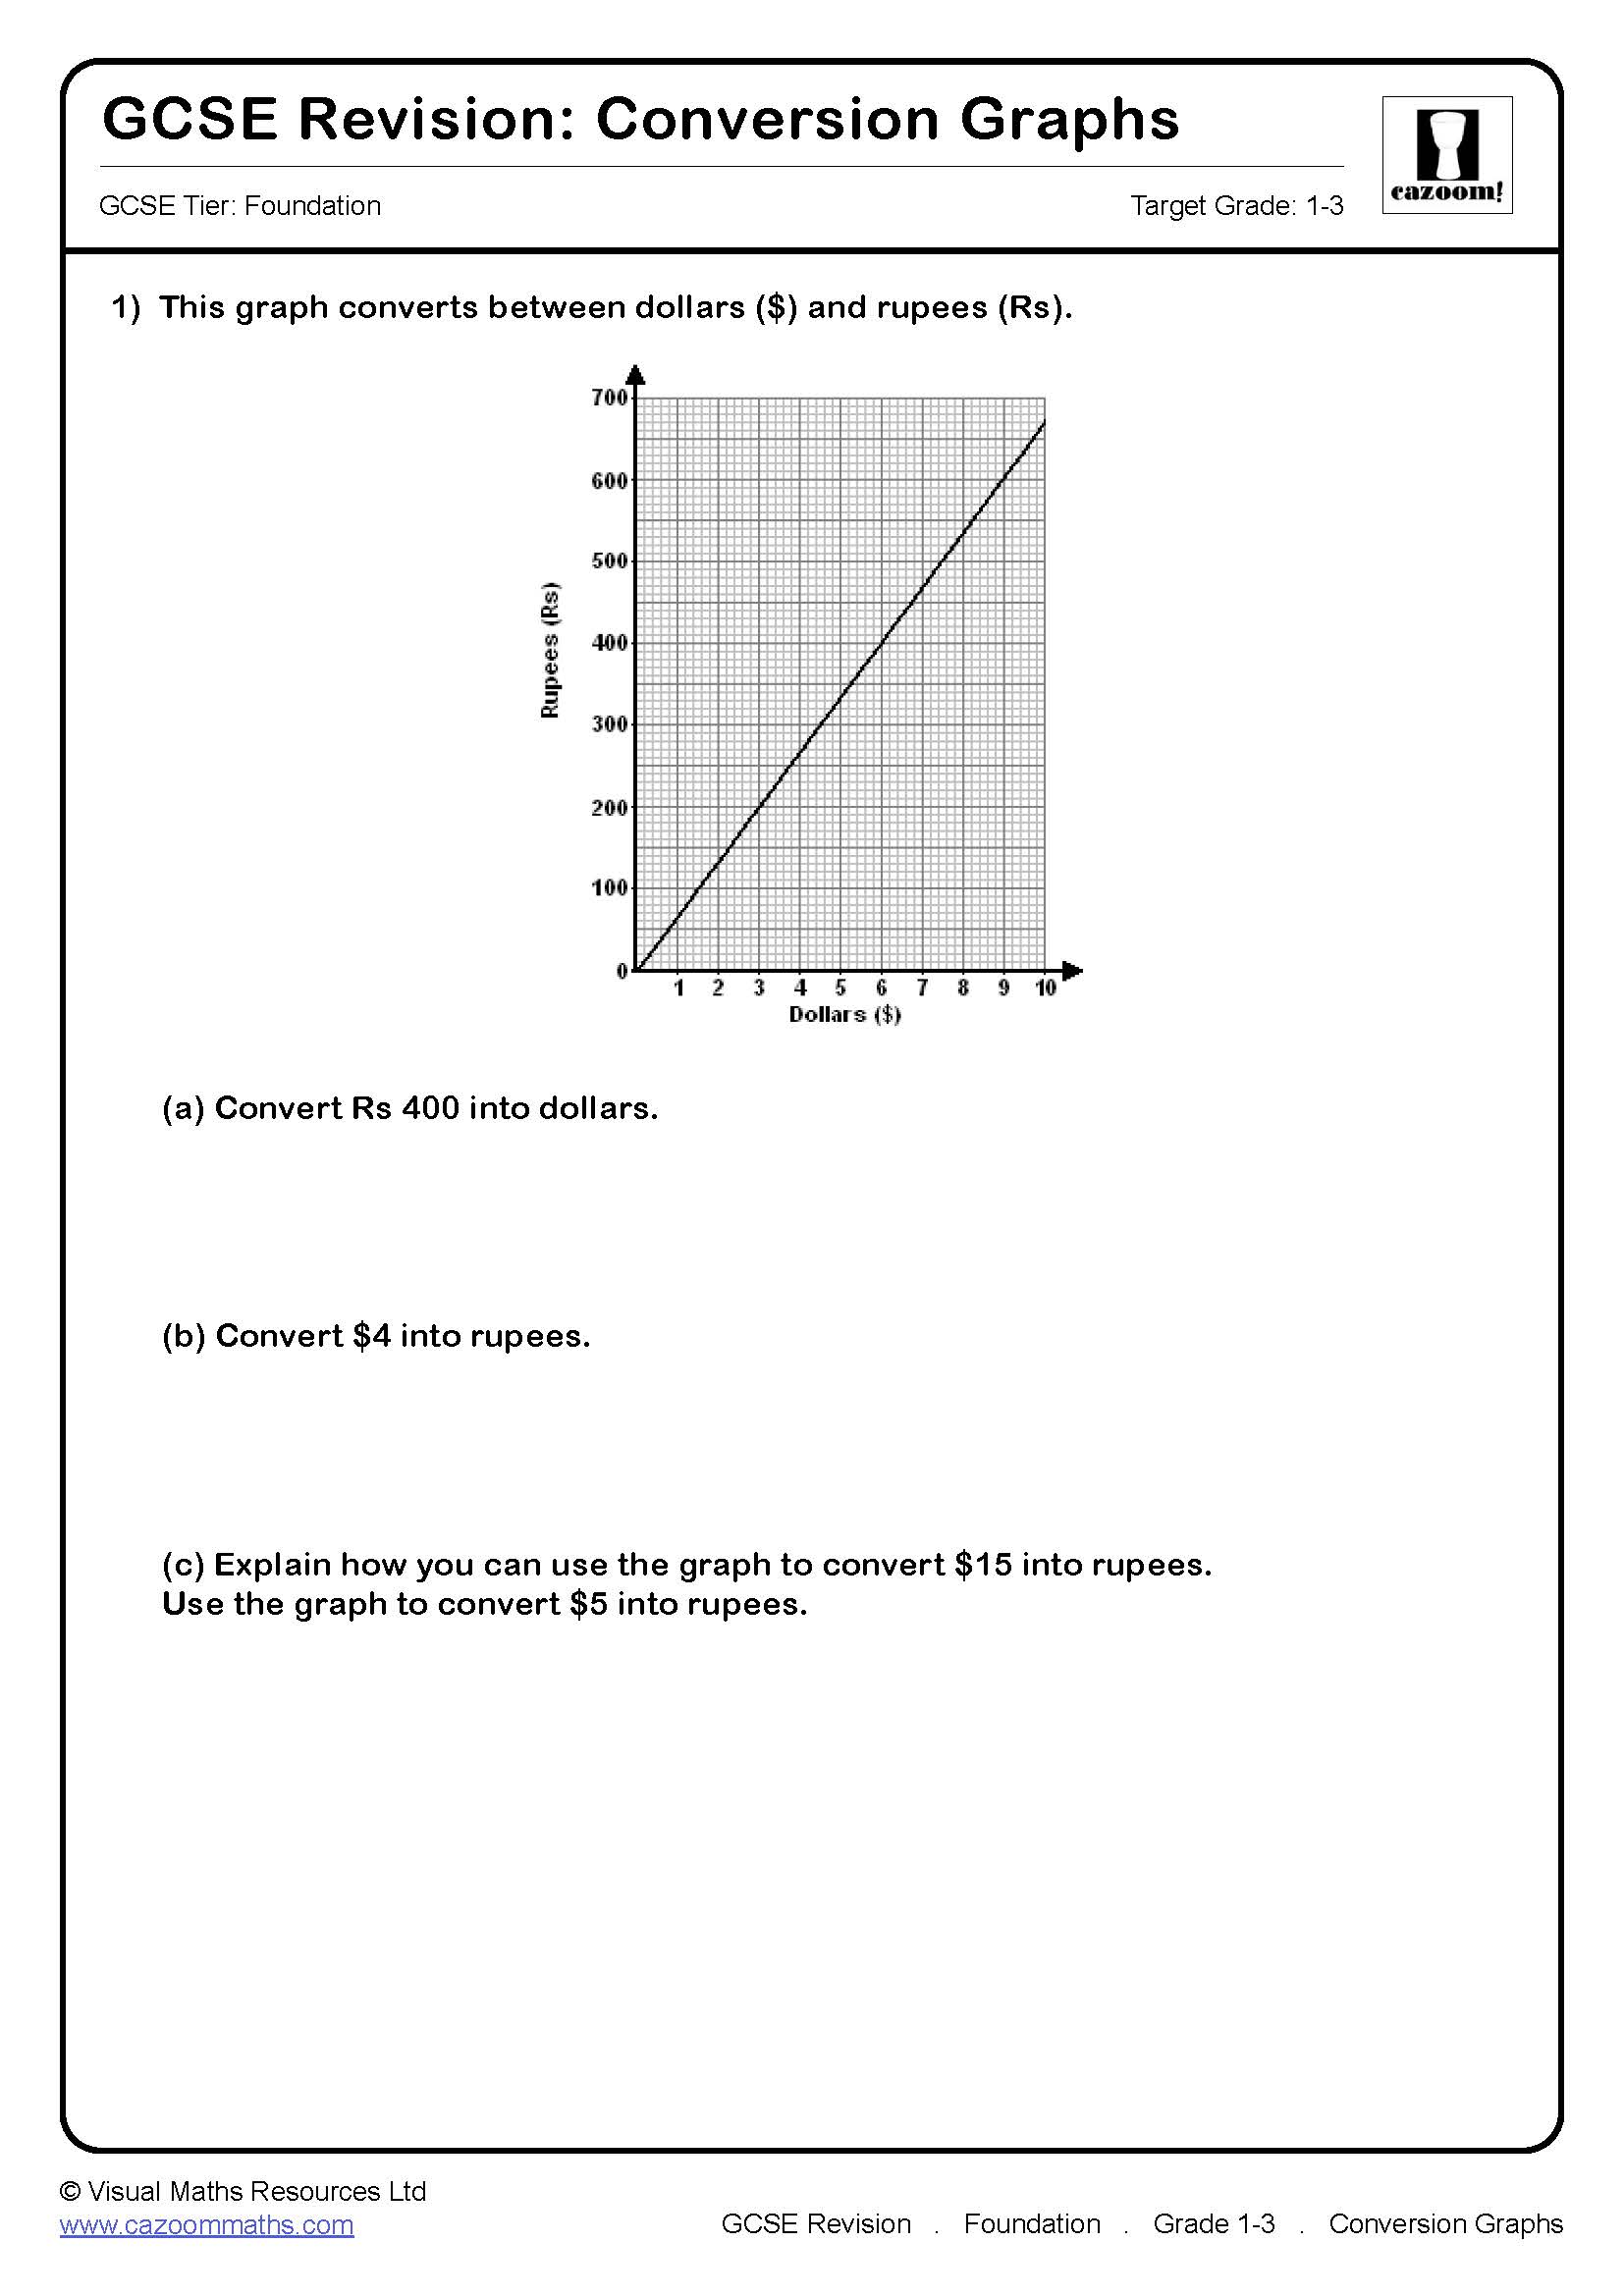
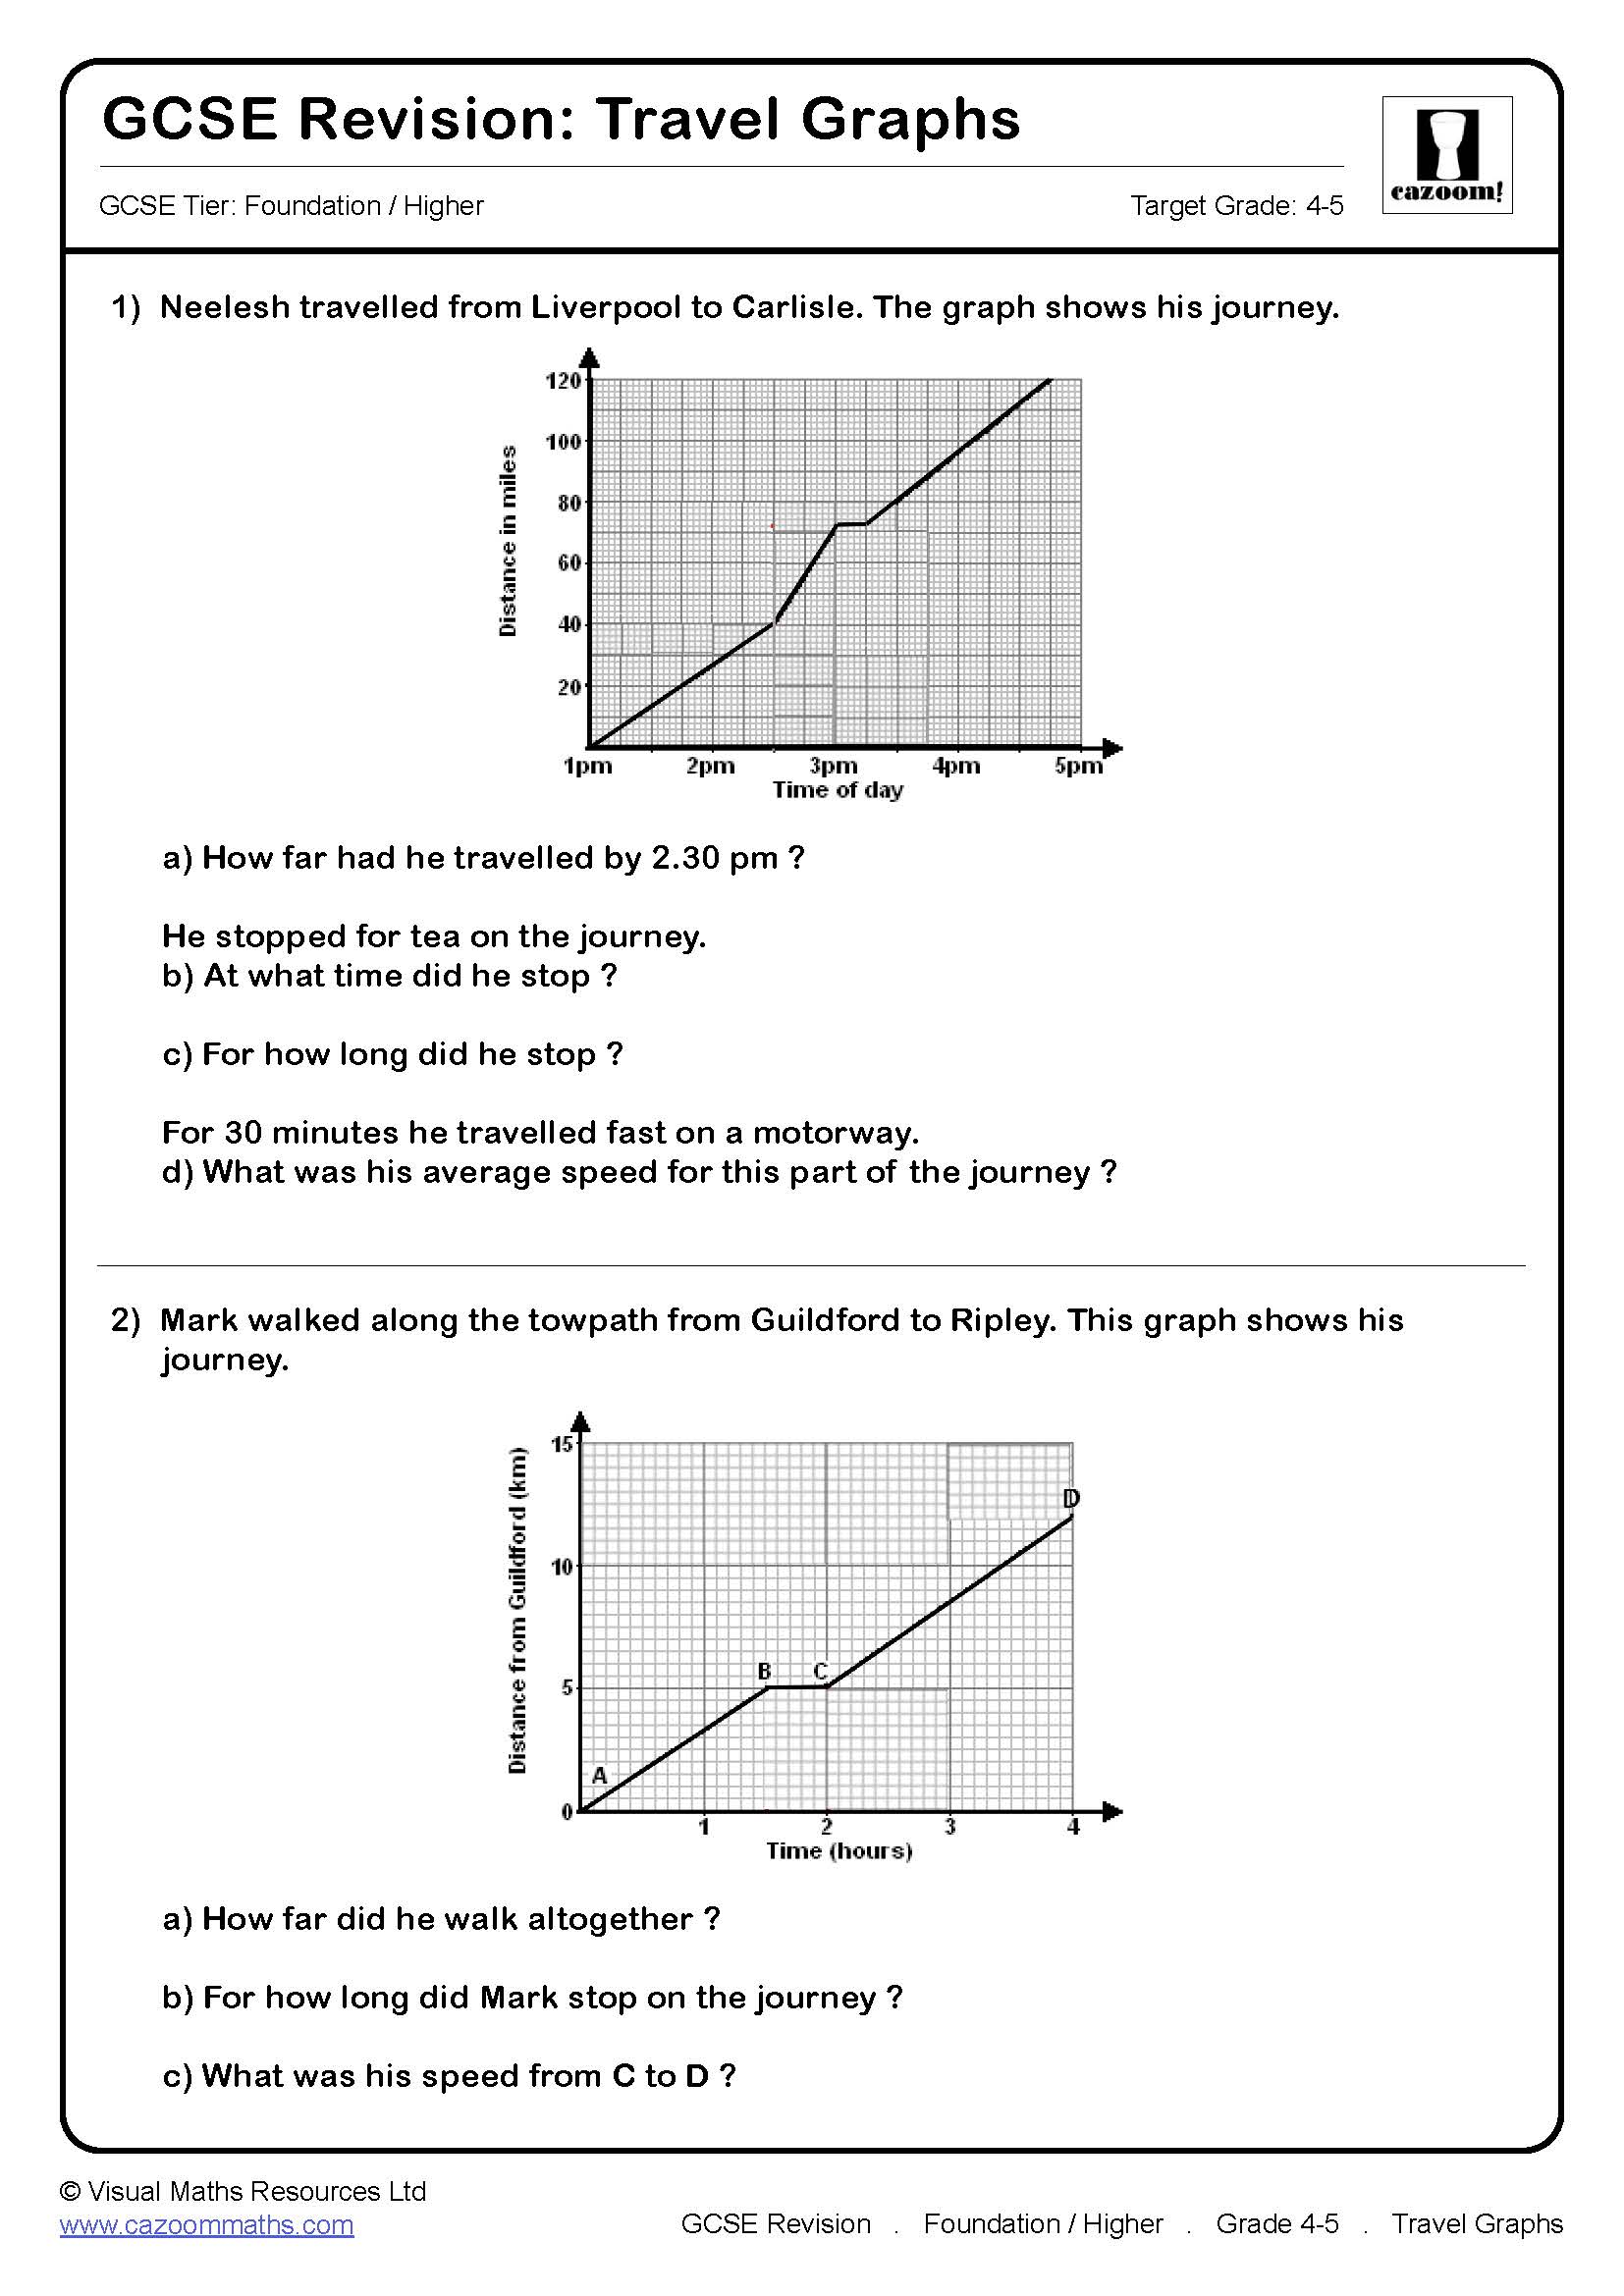
Foundation papers include distance-time graphs showing journeys with multiple stages, conversion graphs for currencies or units, and step graphs for tariffs or postage costs. Questions worth 1-2 marks ask students to read values from axes or identify when someone stopped moving. Higher-value questions at 3-4 marks require calculating speed from gradient, comparing two journeys, or working out costs from step graphs. These appear across both Foundation papers, typically totalling 8-12 marks combined.
Students frequently lose marks by calculating speed incorrectly, using distance divided by speed instead of distance divided by time. Another common error involves misreading scales where each square represents 2 or 5 units rather than 1. Exam mark schemes expect clear workings for speed calculations, so showing the formula explicitly secures method marks even when final answers contain arithmetic slips.
What grade are Real Life Graphs questions on Foundation GCSE maths?
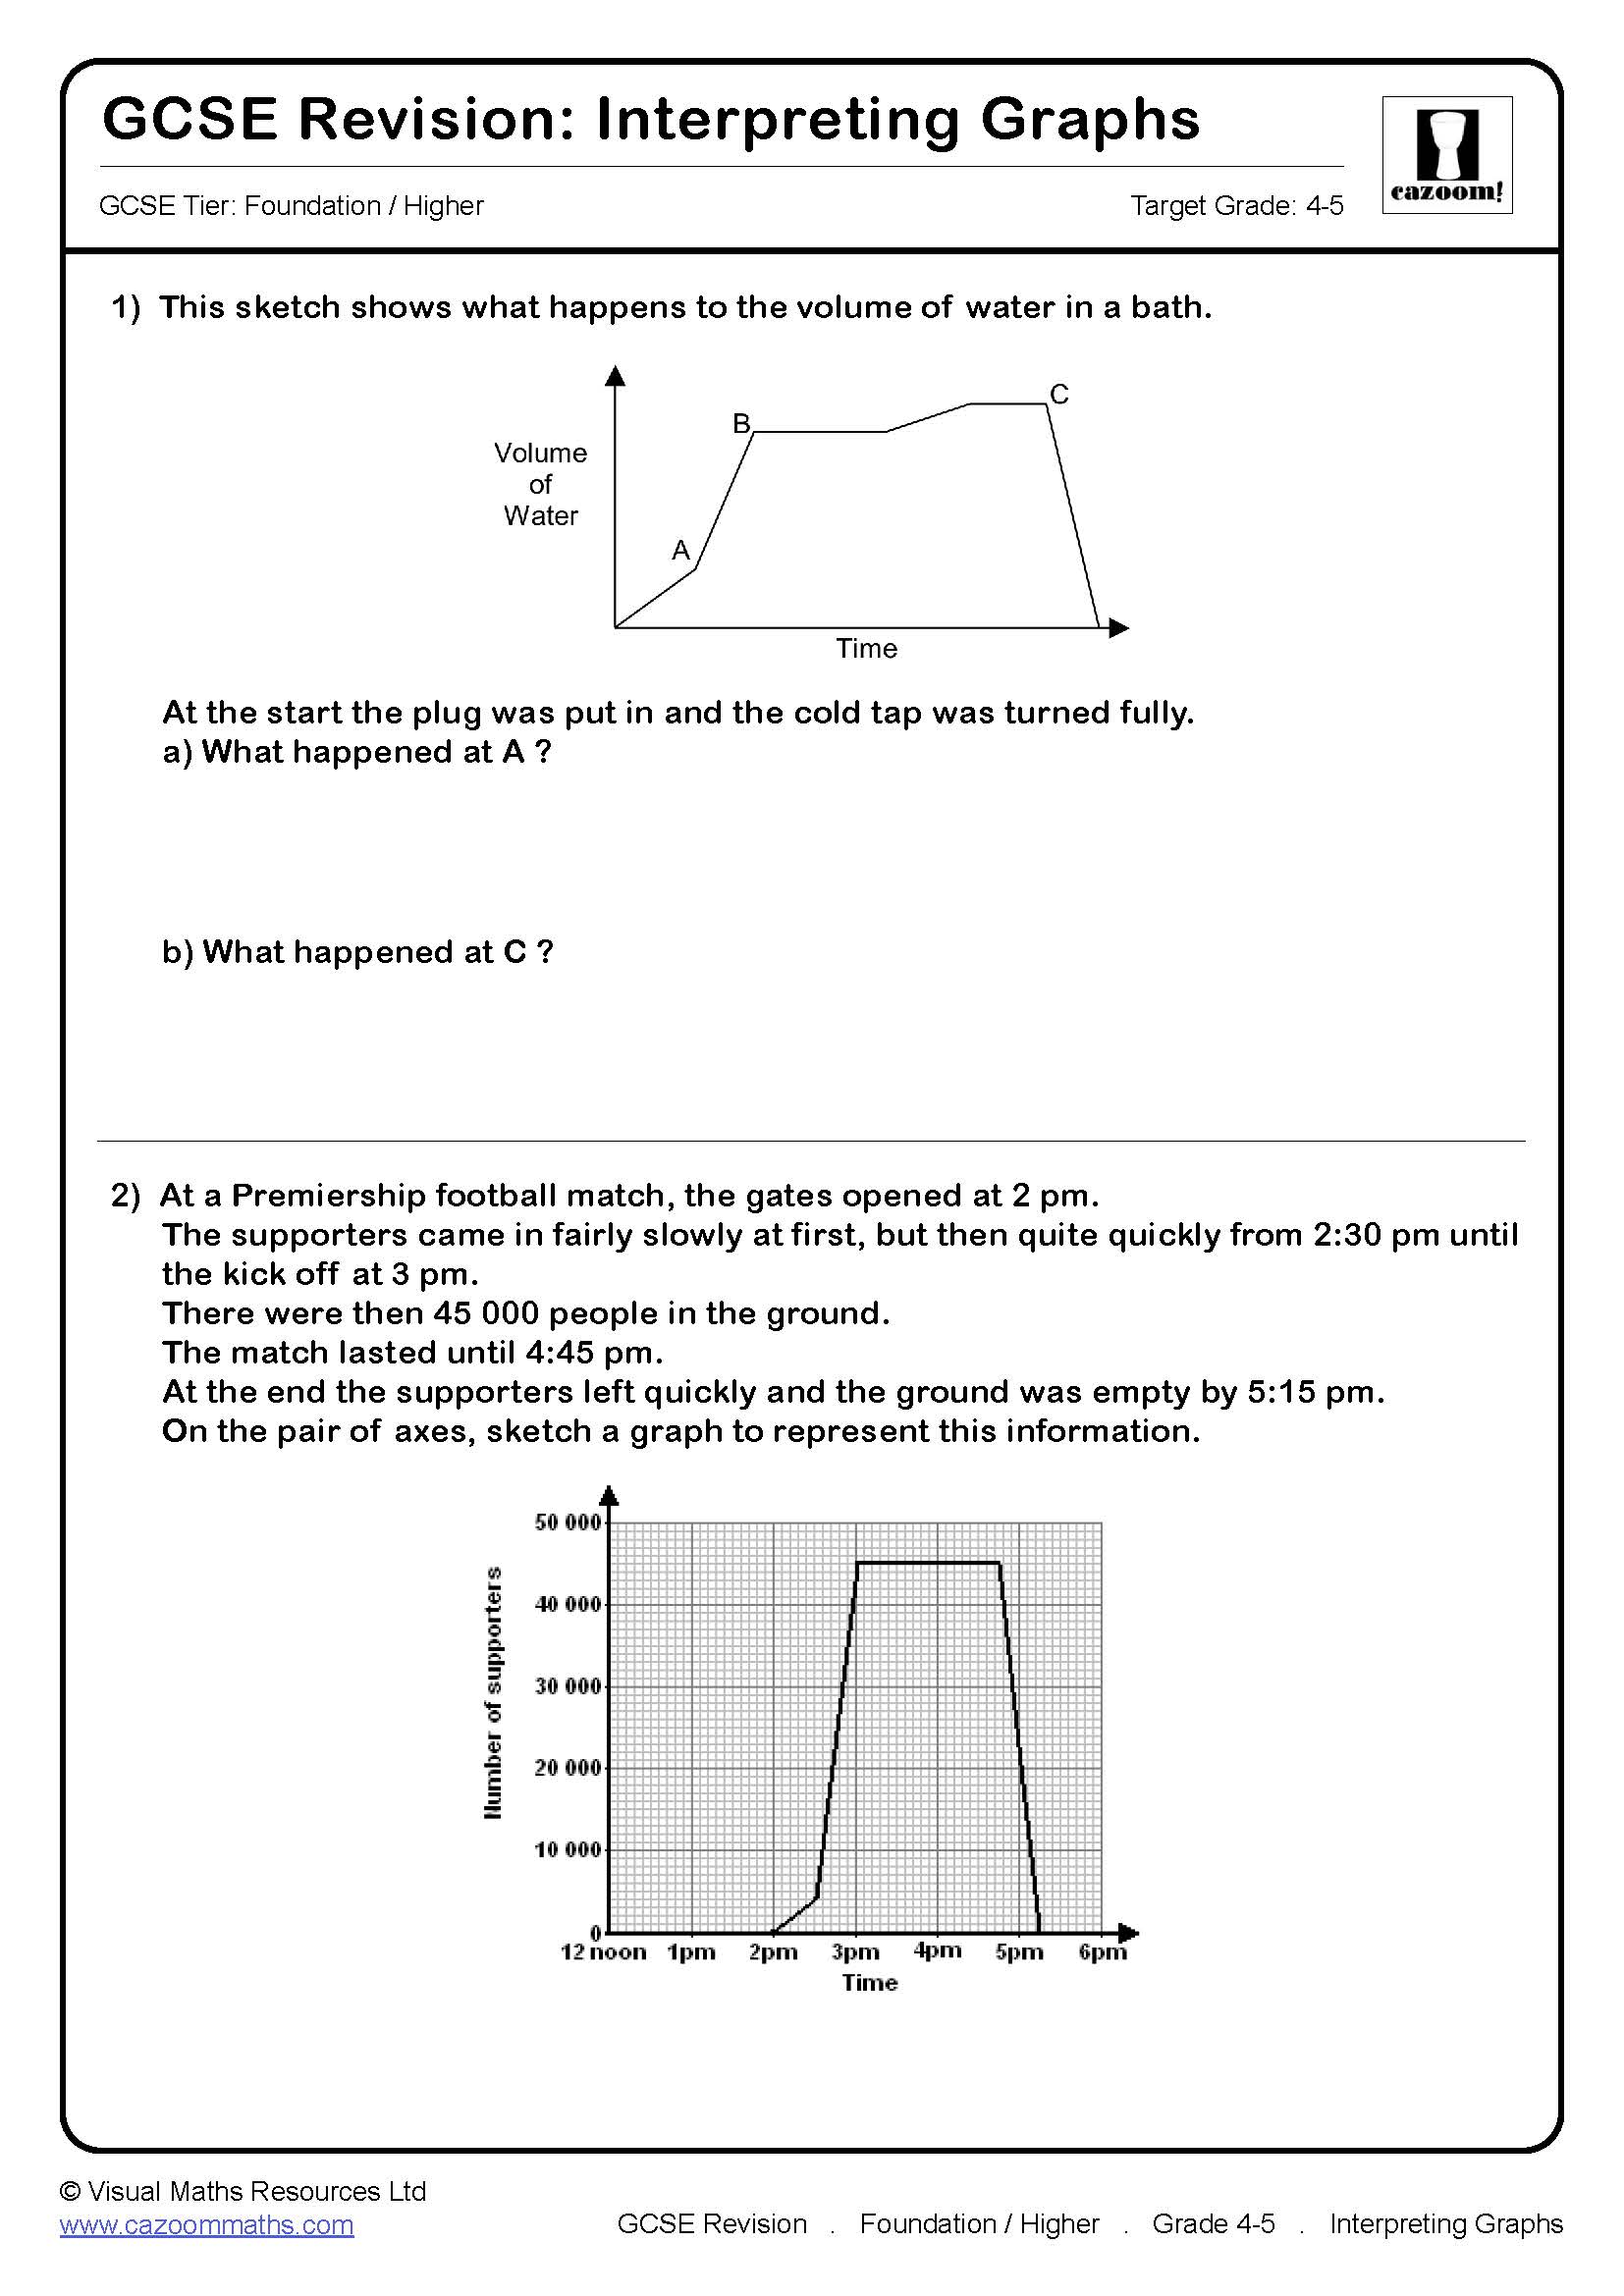
Real life graphs span grades 2-5 on Foundation papers. Grades 2-3 questions focus on reading coordinates from graphs, identifying maximum or minimum values, and recognising simple patterns like constant speed shown by straight diagonal lines. Grades 4-5 questions require calculating gradients to find speed, interpreting what horizontal or steeper sections mean, working backwards from graphs to find missing information, and comparing rates from different graph sections.
Students aiming for grade 4 should prioritise mastering speed calculations and understanding graph features before attempting multi-step reasoning questions. Teachers often suggest consolidating grade 3 skills first, ensuring students reliably read scales and describe journeys, then progressing to gradient calculations once foundational interpretation feels secure. This builds confidence systematically rather than jumping between difficulty levels.
How is Real Life Graphs tested differently on Foundation compared to Higher?
Foundation papers focus on interpretation and straightforward calculations from clearly labelled graphs, whilst Higher tier introduces velocity-time graphs with acceleration, area under graphs representing distance, and graphs requiring algebraic reasoning. Foundation students work with distance-time and simple conversion graphs, calculating speed as gradient without needing calculus concepts. Questions provide helpful scaffolding, often giving the speed formula or breaking multi-step problems into parts.
This Foundation approach matters because students need confidence reading graphical information before tackling abstract velocity-time concepts. Mastering what horizontal lines, steep gradients, and returning sections mean on distance-time graphs builds essential visual literacy. Foundation students who secure these core interpretation skills develop reasoning that transfers across graph types, preparing them for functional maths contexts beyond GCSE where reading charts accurately matters practically.
How should students revise Real Life Graphs for Foundation GCSE maths?
Students should work through worksheets in grade order, starting with reading values and describing journeys before attempting speed calculations. Practising with answer sheets immediately after attempting questions helps identify whether errors stem from misreading scales, formula confusion, or arithmetic mistakes. Timed practice replicating exam conditions builds familiarity with typical question structures, whilst annotating graphs with what each section represents reinforces interpretation skills.
Teachers can use these worksheets for retrieval practice starters, setting different grade bands for targeted intervention groups, or as homework following lessons on gradient and rate. Mixed difficulty practice helps students recognise which techniques different questions require. Checking answers together allows discussion of common misunderstandings, particularly around why horizontal means stopped rather than slow, and how steeper gradients represent faster speeds.