GCSE Higher Cumulative Frequency and Box Plots Revision Worksheets
All worksheets are created by the team of experienced teachers at Cazoom Maths.
What Cumulative Frequency and Box Plots questions appear on the GCSE Higher paper?
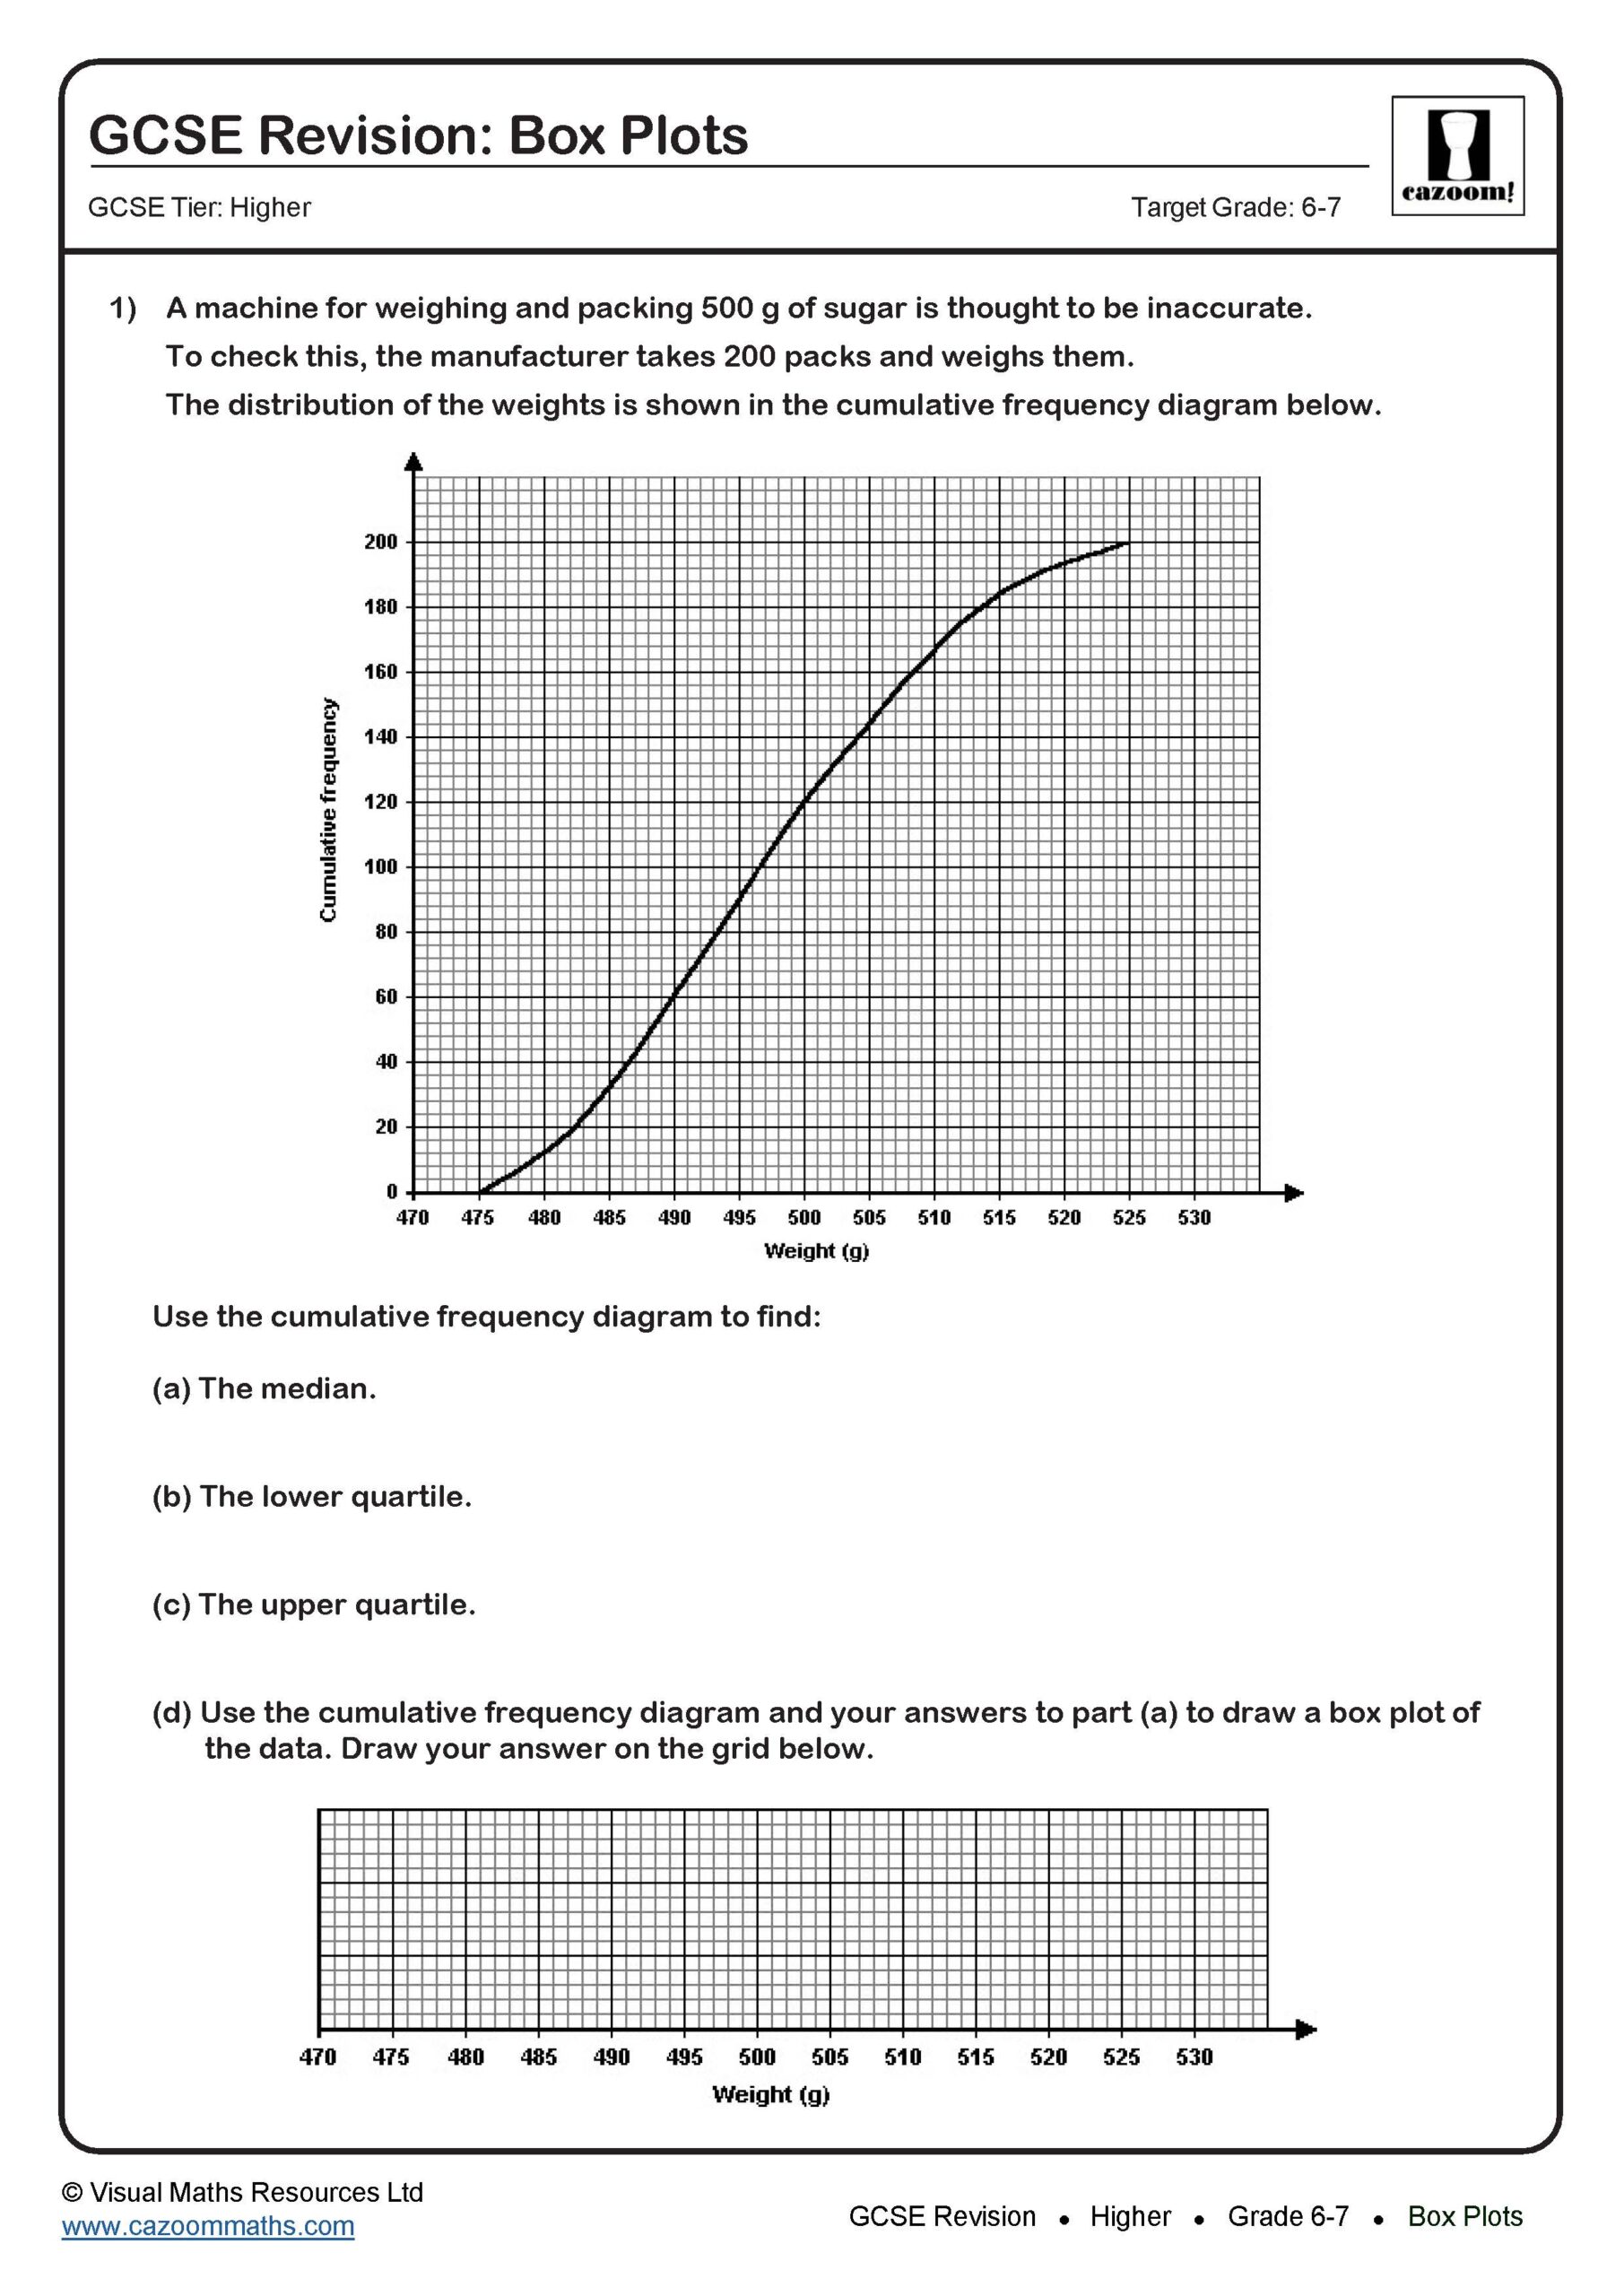
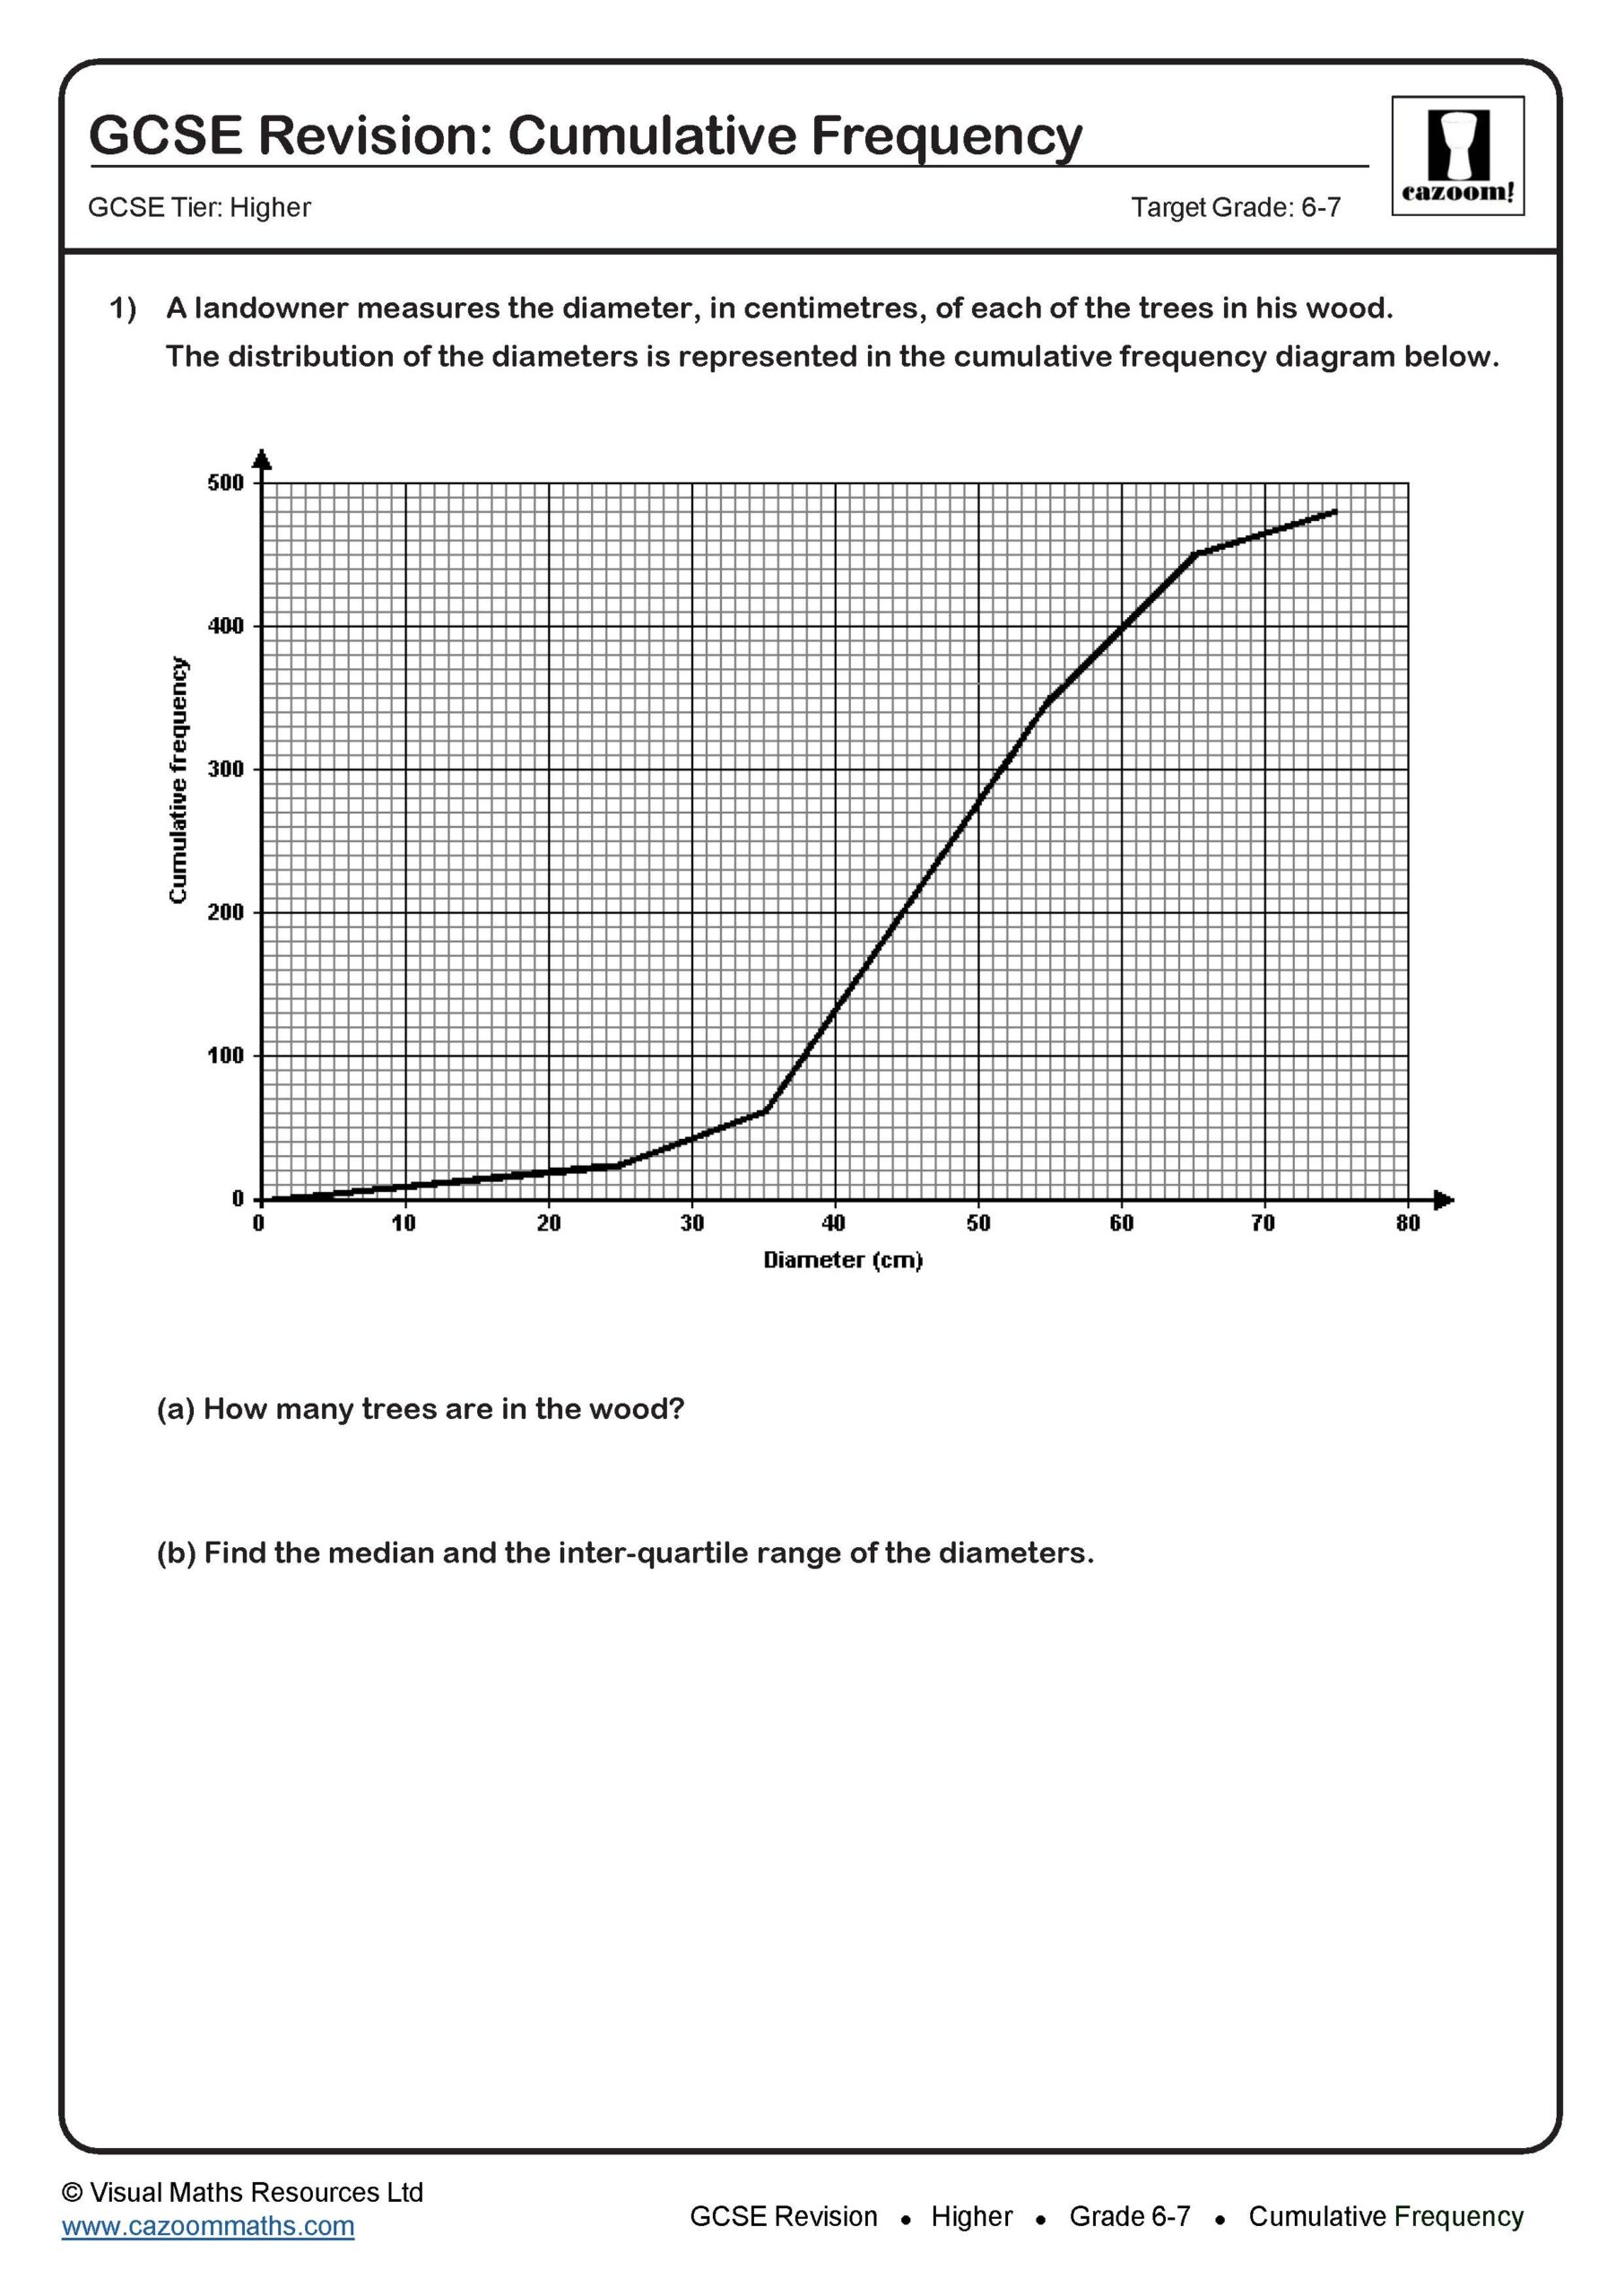
Higher papers typically include one substantial cumulative frequency question worth 4-6 marks, often paired with a box plot comparison. Students must construct cumulative frequency curves from grouped frequency tables, draw accurate box plots using calculated quartiles, and interpret these representations to compare distributions. Questions frequently ask for the interquartile range, estimates for median or specific percentiles, and comparative statements about spread or skewness between two datasets.
Exam mark schemes penalise students heavily for inaccurate plotting or failure to use a ruler for the cumulative frequency curve. Teachers observe that students often calculate quartiles correctly but plot them at group boundaries rather than reading from the curve. The outlier calculation using 1.5 × IQR appears regularly at grades 7-9, catching out students who haven't practised this specific technique.
What grade are Cumulative Frequency and Box Plots questions on Higher GCSE maths?
Basic cumulative frequency construction and median estimation sit at grades 4-5, accessible to students crossing from Foundation. Grade 6 questions introduce quartile calculations and interquartile range, whilst grades 7-8 demand box plot comparisons with justified statements about distribution shape. The outlier detection using the 1.5 × IQR rule, combined with interpreting what this means for the data, consistently appears at grade 8-9 and separates top-tier students from those securing grade 7.
Students should identify their target grade and work systematically through questions at that boundary. Teachers notice that focusing on accurate graph construction at grades 4-6 before tackling comparative analysis prevents students from losing easy marks through careless plotting whilst building confidence for higher-grade interpretation questions.
How is Cumulative Frequency and Box Plots tested differently on Higher compared to Foundation?
Foundation tier introduces cumulative frequency with simpler grouped data and focuses on reading values from given curves rather than construction. Higher tier expects students to construct curves from scratch, often with unequal class widths or larger datasets requiring careful scaling. Box plots on Foundation typically involve interpreting given diagrams, whilst Higher demands construction from raw quartile calculations and comparative analysis between multiple distributions.
The critical Higher skill is justifying statistical statements using calculated values. Students must explain why one distribution shows greater spread or identify skewness from box plot shape. Teachers observe that students comfortable with Foundation-level reading struggle when asked to construct and then analyse, particularly when outlier rules or comparing interquartile ranges against specific claims. This deeper analytical demand defines Higher tier statistical reasoning.
How should students revise Cumulative Frequency and Box Plots for Higher GCSE maths?
Students should practise constructing cumulative frequency curves under timed conditions, focusing on accurate plotting and smooth curve-drawing with a ruler for straight sections. Working through worksheets by grade band allows targeted revision: master median and quartile reading at grades 4-5 before tackling outlier calculations at grades 7-9. Checking answer sheets helps students identify whether errors stem from calculation mistakes or misreading scales, a common distinction teachers notice between grade 6 and grade 8 performance.
Teachers can set these worksheets as homework following initial teaching, using the answer sheets for peer-marking sessions where students compare their curves and discuss plotting accuracy. In lessons, projecting worked solutions helps demonstrate the precise technique examiners expect for reading quartiles from curves, addressing the frequent mark loss from approximate values when exact answers are required.