GCSE Higher Frequency Polygons and Histograms Revision Worksheets
All worksheets are created by the team of experienced teachers at Cazoom Maths.
What Frequency Polygons and Histograms questions appear on the GCSE Higher paper?
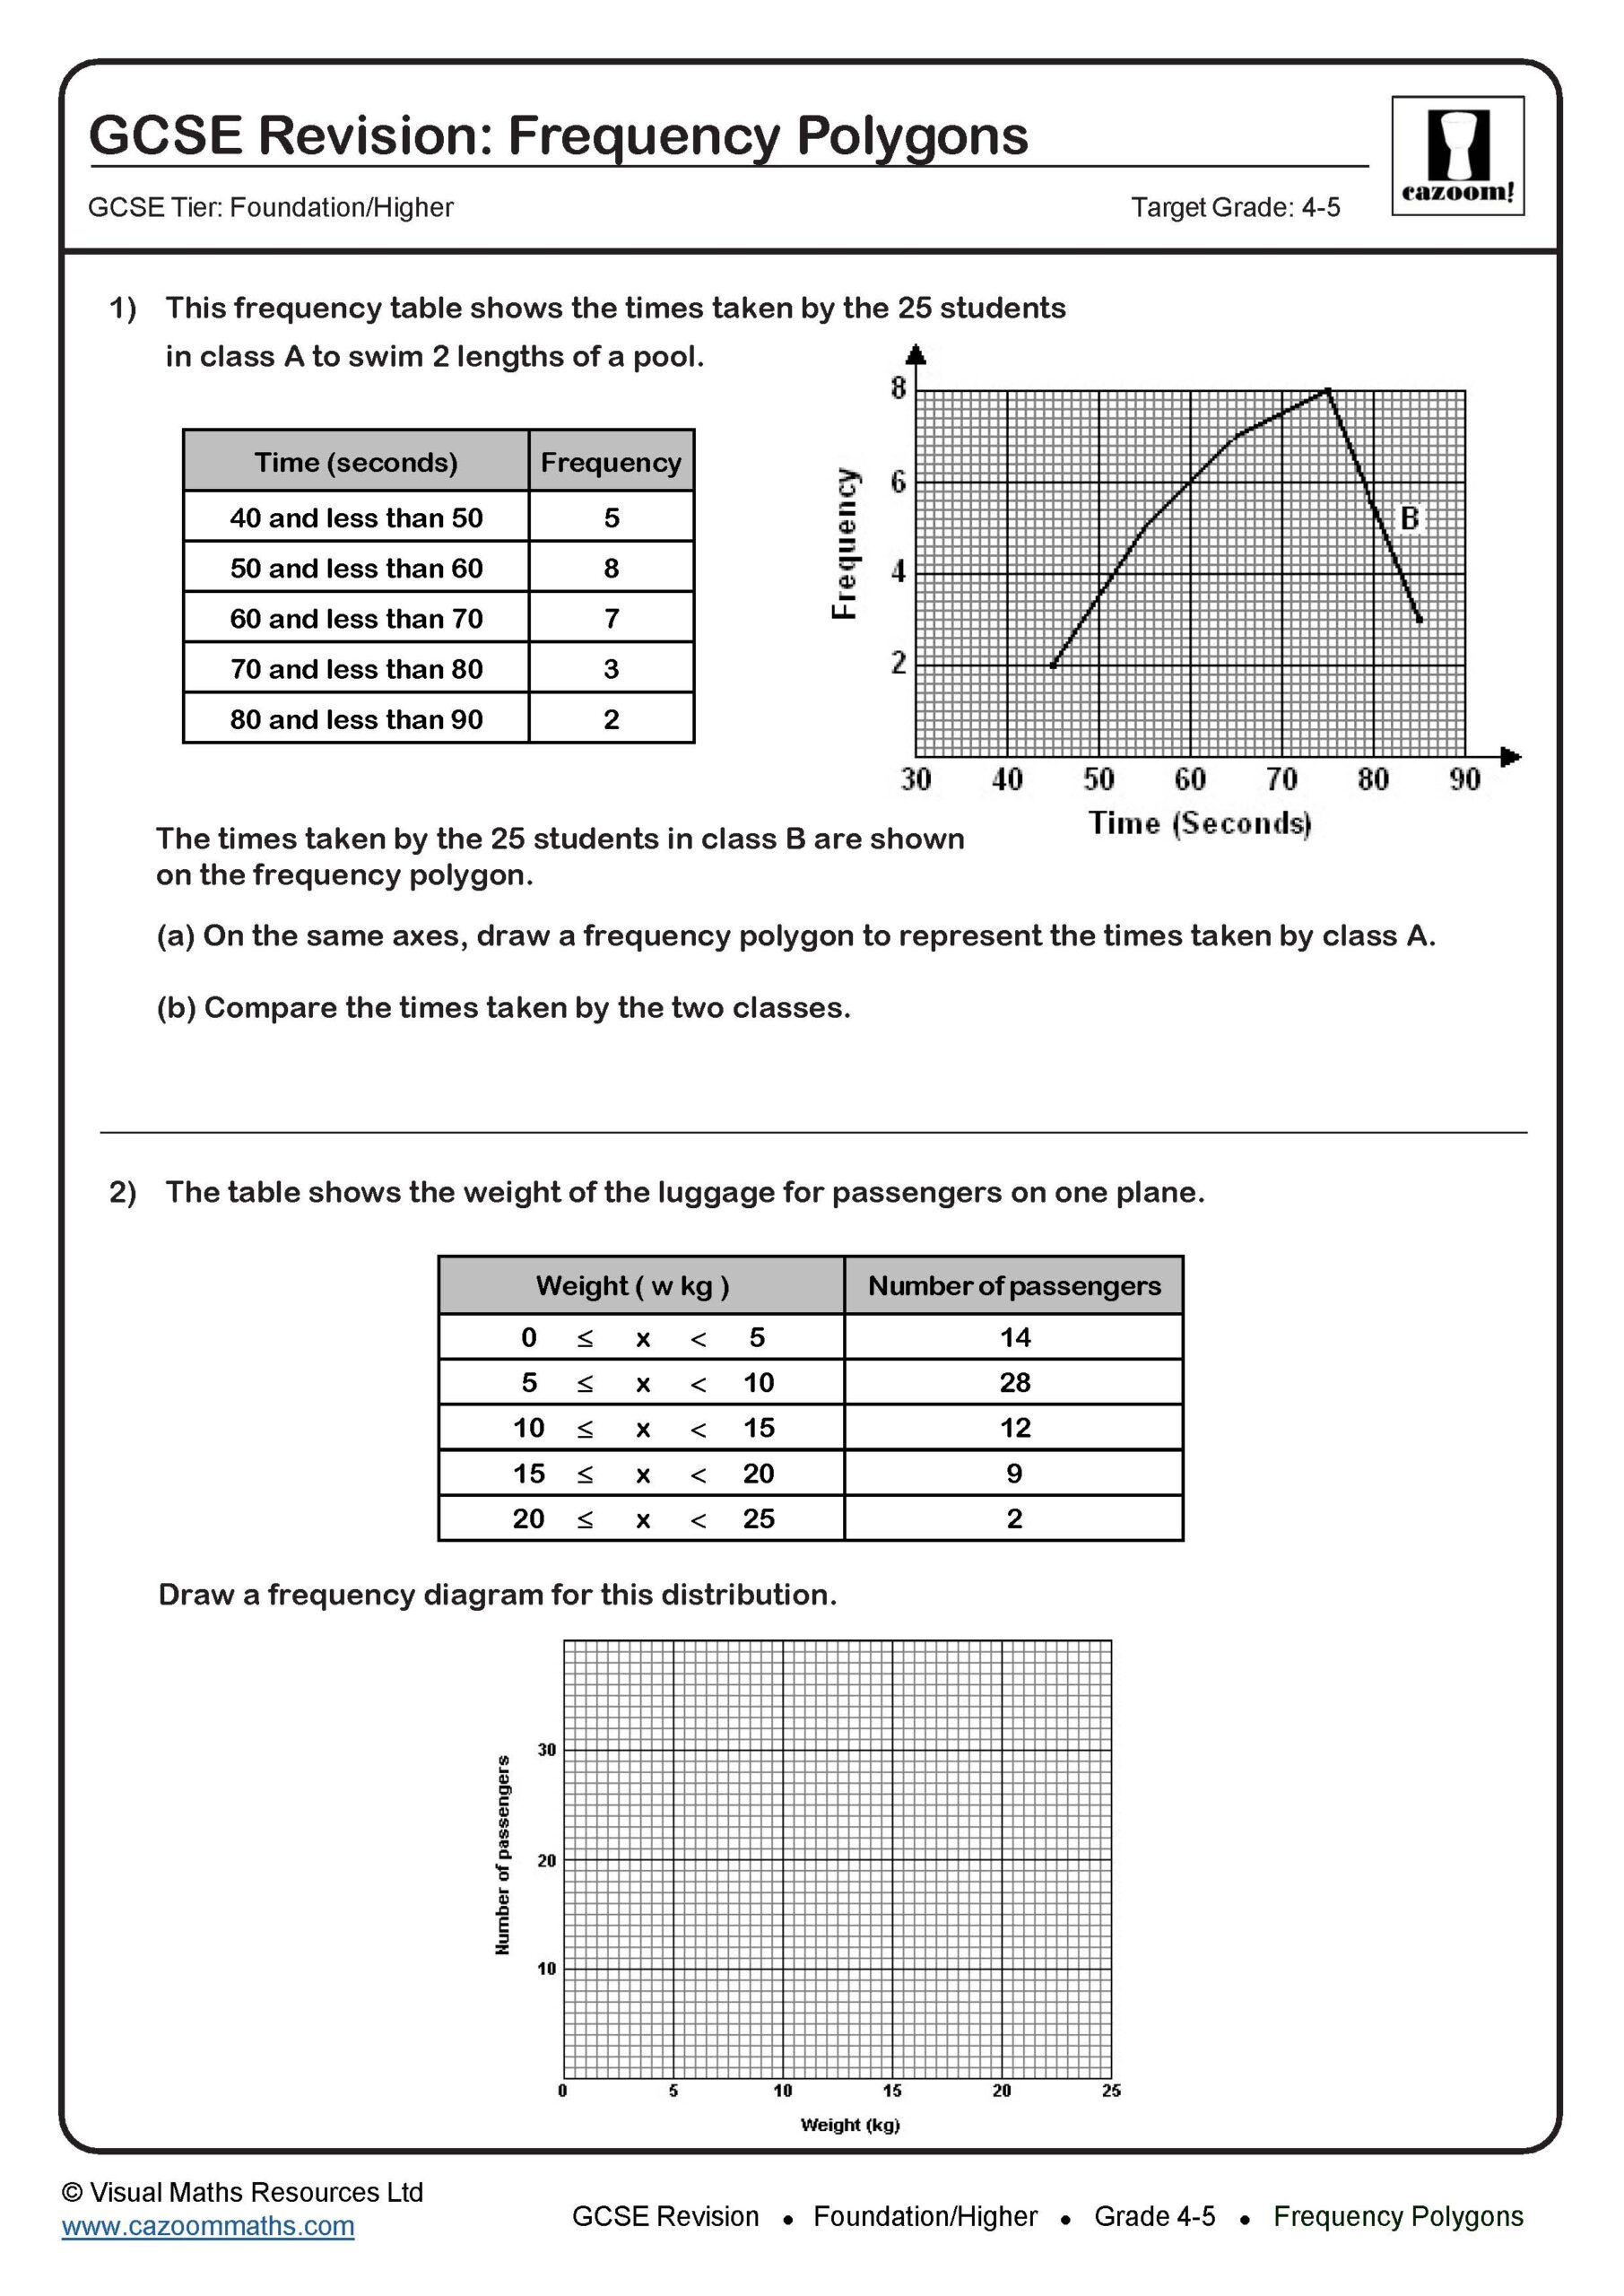
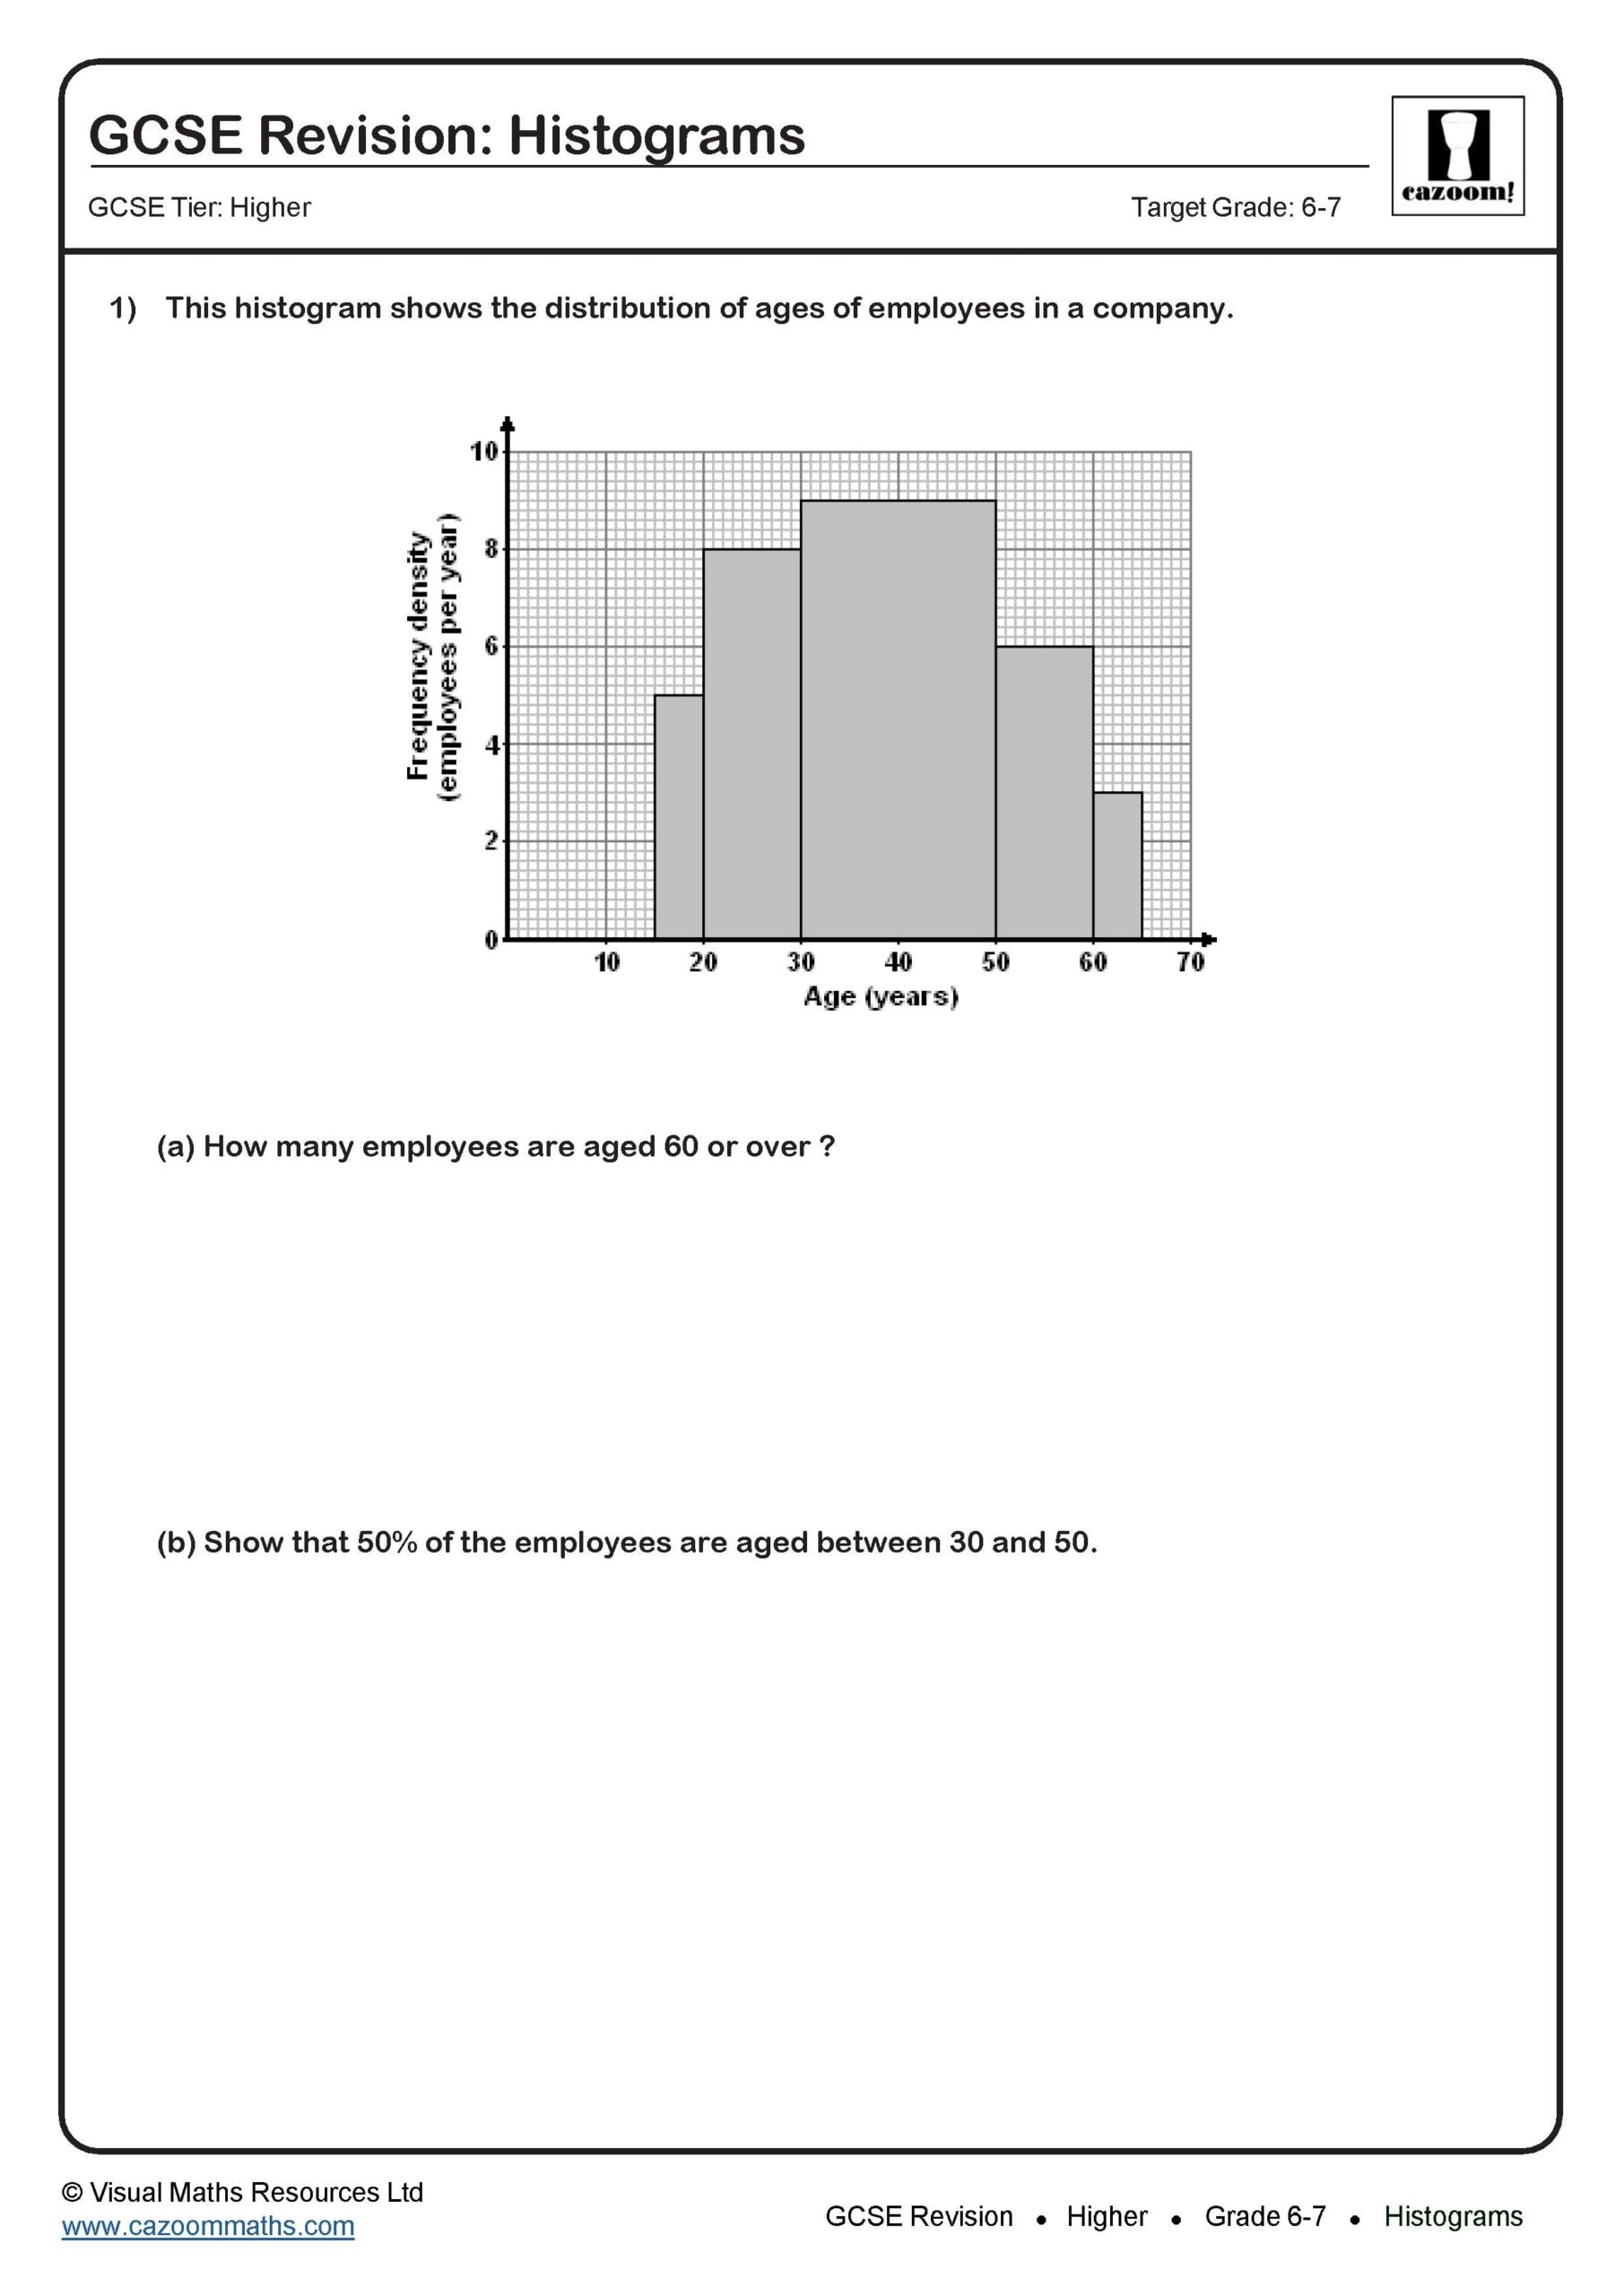
Higher tier papers include constructing histograms with unequal class widths (typically 4-5 marks), drawing frequency polygons from grouped data tables, comparing two distributions using frequency polygons overlaid on the same axes, and estimating statistical measures like the median or interquartile range from histograms. Questions may combine histogram interpretation with cumulative frequency or box plots, pushing towards grade 8-9 territory. Some questions provide partially completed histograms requiring students to complete missing bars using given totals or frequency densities.
Students lose marks by plotting frequency instead of frequency density, a mistake that persists even after instruction. Exam mark schemes penalise incorrect axis labels heavily. Teachers notice breakthroughs when students routinely write "frequency ÷ class width" before touching graph paper, making this calculation automatic rather than an afterthought when bars look wrong.
What grade are Frequency Polygons and Histograms questions on Higher GCSE maths?
Basic histogram interpretation with equal class widths sits at grade 4-5, accessible on both tiers but straightforward on Higher papers. Constructing histograms with unequal class widths typically targets grade 6, whilst questions combining histogram construction with median estimation or comparing distributions reach grade 7-8. Multi-step problems requiring reverse working (finding missing frequencies when given partial histogram and total) push toward grade 9, demanding algebraic manipulation alongside statistical understanding.
Students aiming for grade 7 or above should prioritise unequal class width questions, as these differentiate performance most clearly. Teachers often suggest mastering frequency density calculations at grade 6 standard before attempting estimation questions, since computational errors compound when statistical reasoning follows. Focusing on weaker grade bands builds confidence before tackling stretch content requiring proof or justification of distribution comparisons.
How is Frequency Polygons and Histograms tested differently on Higher compared to Foundation?
Foundation papers typically present histograms with equal class widths where frequency equals bar height, making construction and interpretation mechanical. Higher tier assumes unequal class widths from the outset, requiring frequency density calculations every time. Foundation might ask students to read values directly from completed histograms; Higher expects construction from raw grouped data, estimation of medians using interpolation, and justification of which distribution shows greater spread or higher mean based on shape analysis.
This difference matters because Higher students must view histograms as area representations, not height charts. Questions deliberately include unequal intervals to test whether students apply frequency density automatically. Teachers notice that students recently moved to Higher tier often revert to Foundation methods under exam pressure, plotting frequencies as heights and losing all subsequent marks despite correct statistical reasoning afterwards.
How should students revise Frequency Polygons and Histograms for Higher GCSE maths?
Students should start with grade 5-6 questions focusing purely on frequency density calculations and histogram construction before attempting interpretation questions. Timed practice helps, as histogram questions often appear late in papers when time pressure increases errors. Working through answers carefully matters more than volume; understanding why frequency density uses area rather than height prevents repeated mistakes. Students benefit from creating their own grouped data tables, swapping with peers, then constructing and comparing histograms to check consistency.
Teachers can set these worksheets as low-stakes homework after teaching the topic, using answer sheets for peer marking that highlights common errors before they embed. Alternatively, use selected questions as starter tasks revisiting frequency density calculations regularly, maintaining fluency between initial teaching and final exams. Targeted practice on median estimation suits students securing grade 7-8 boundaries.