GCSE Higher Real Life Graphs Revision Worksheets
All worksheets are created by the team of experienced teachers at Cazoom Maths.
What Real Life Graphs questions appear on the GCSE Higher paper?
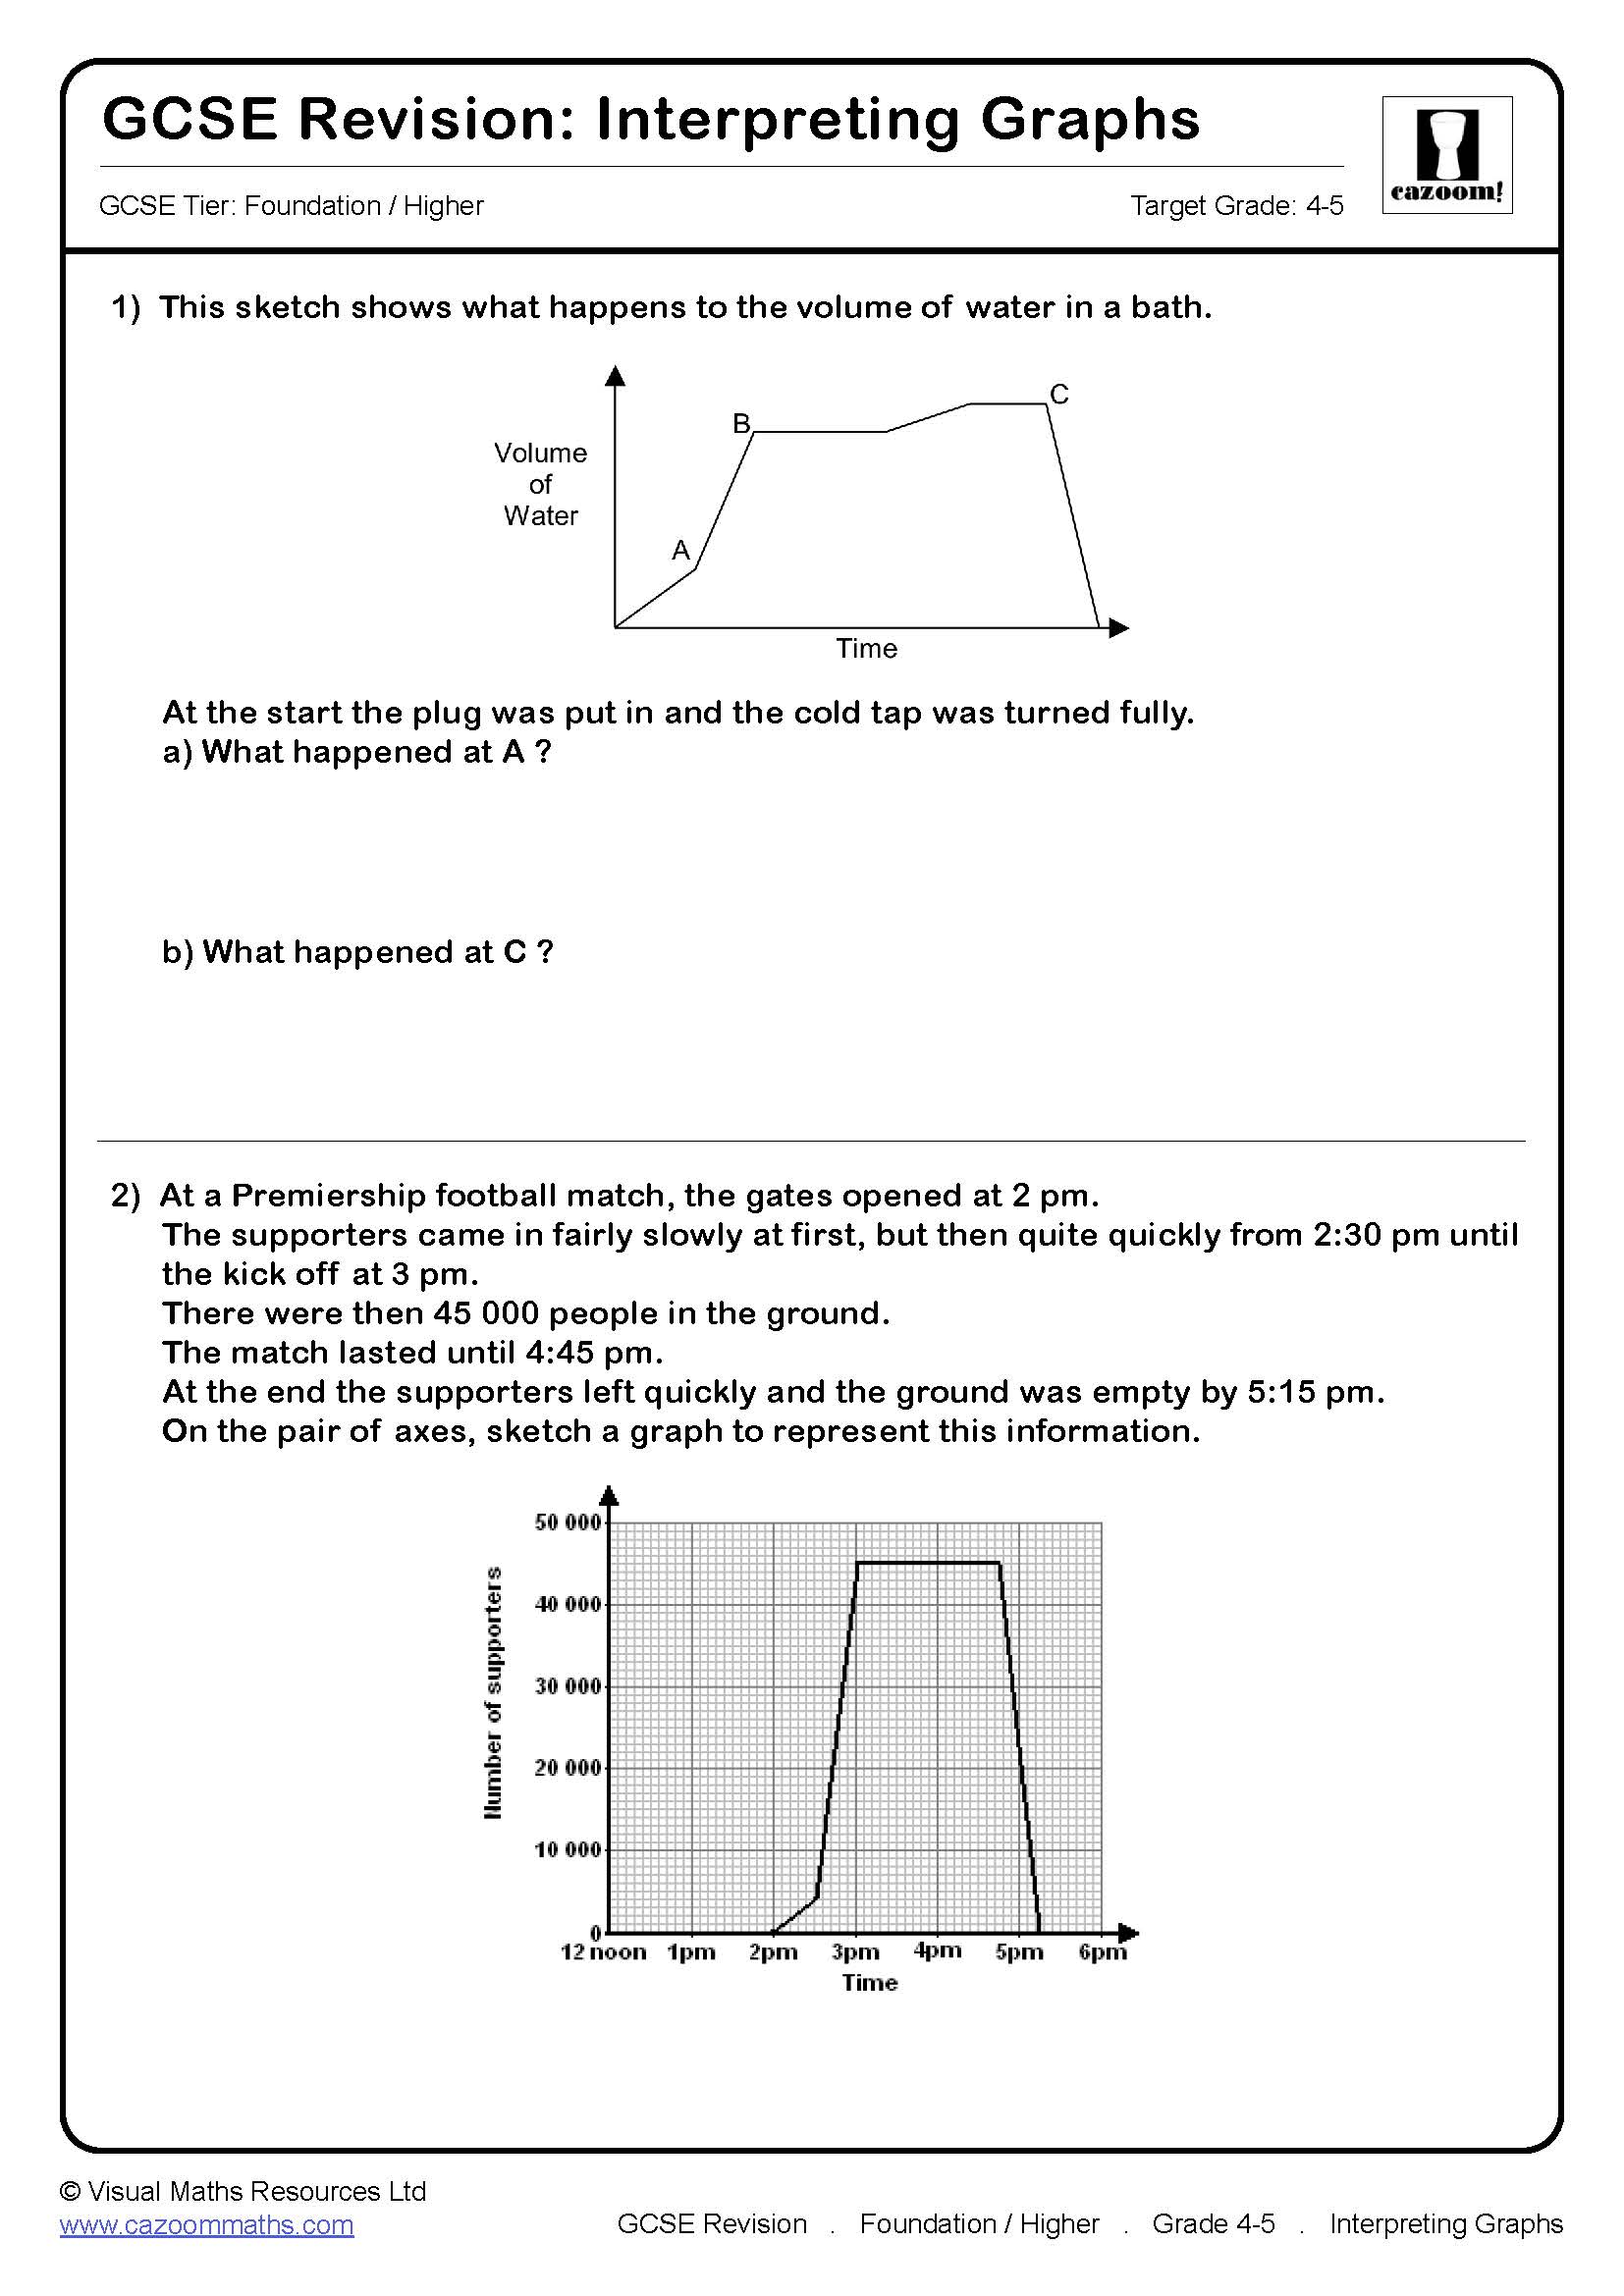
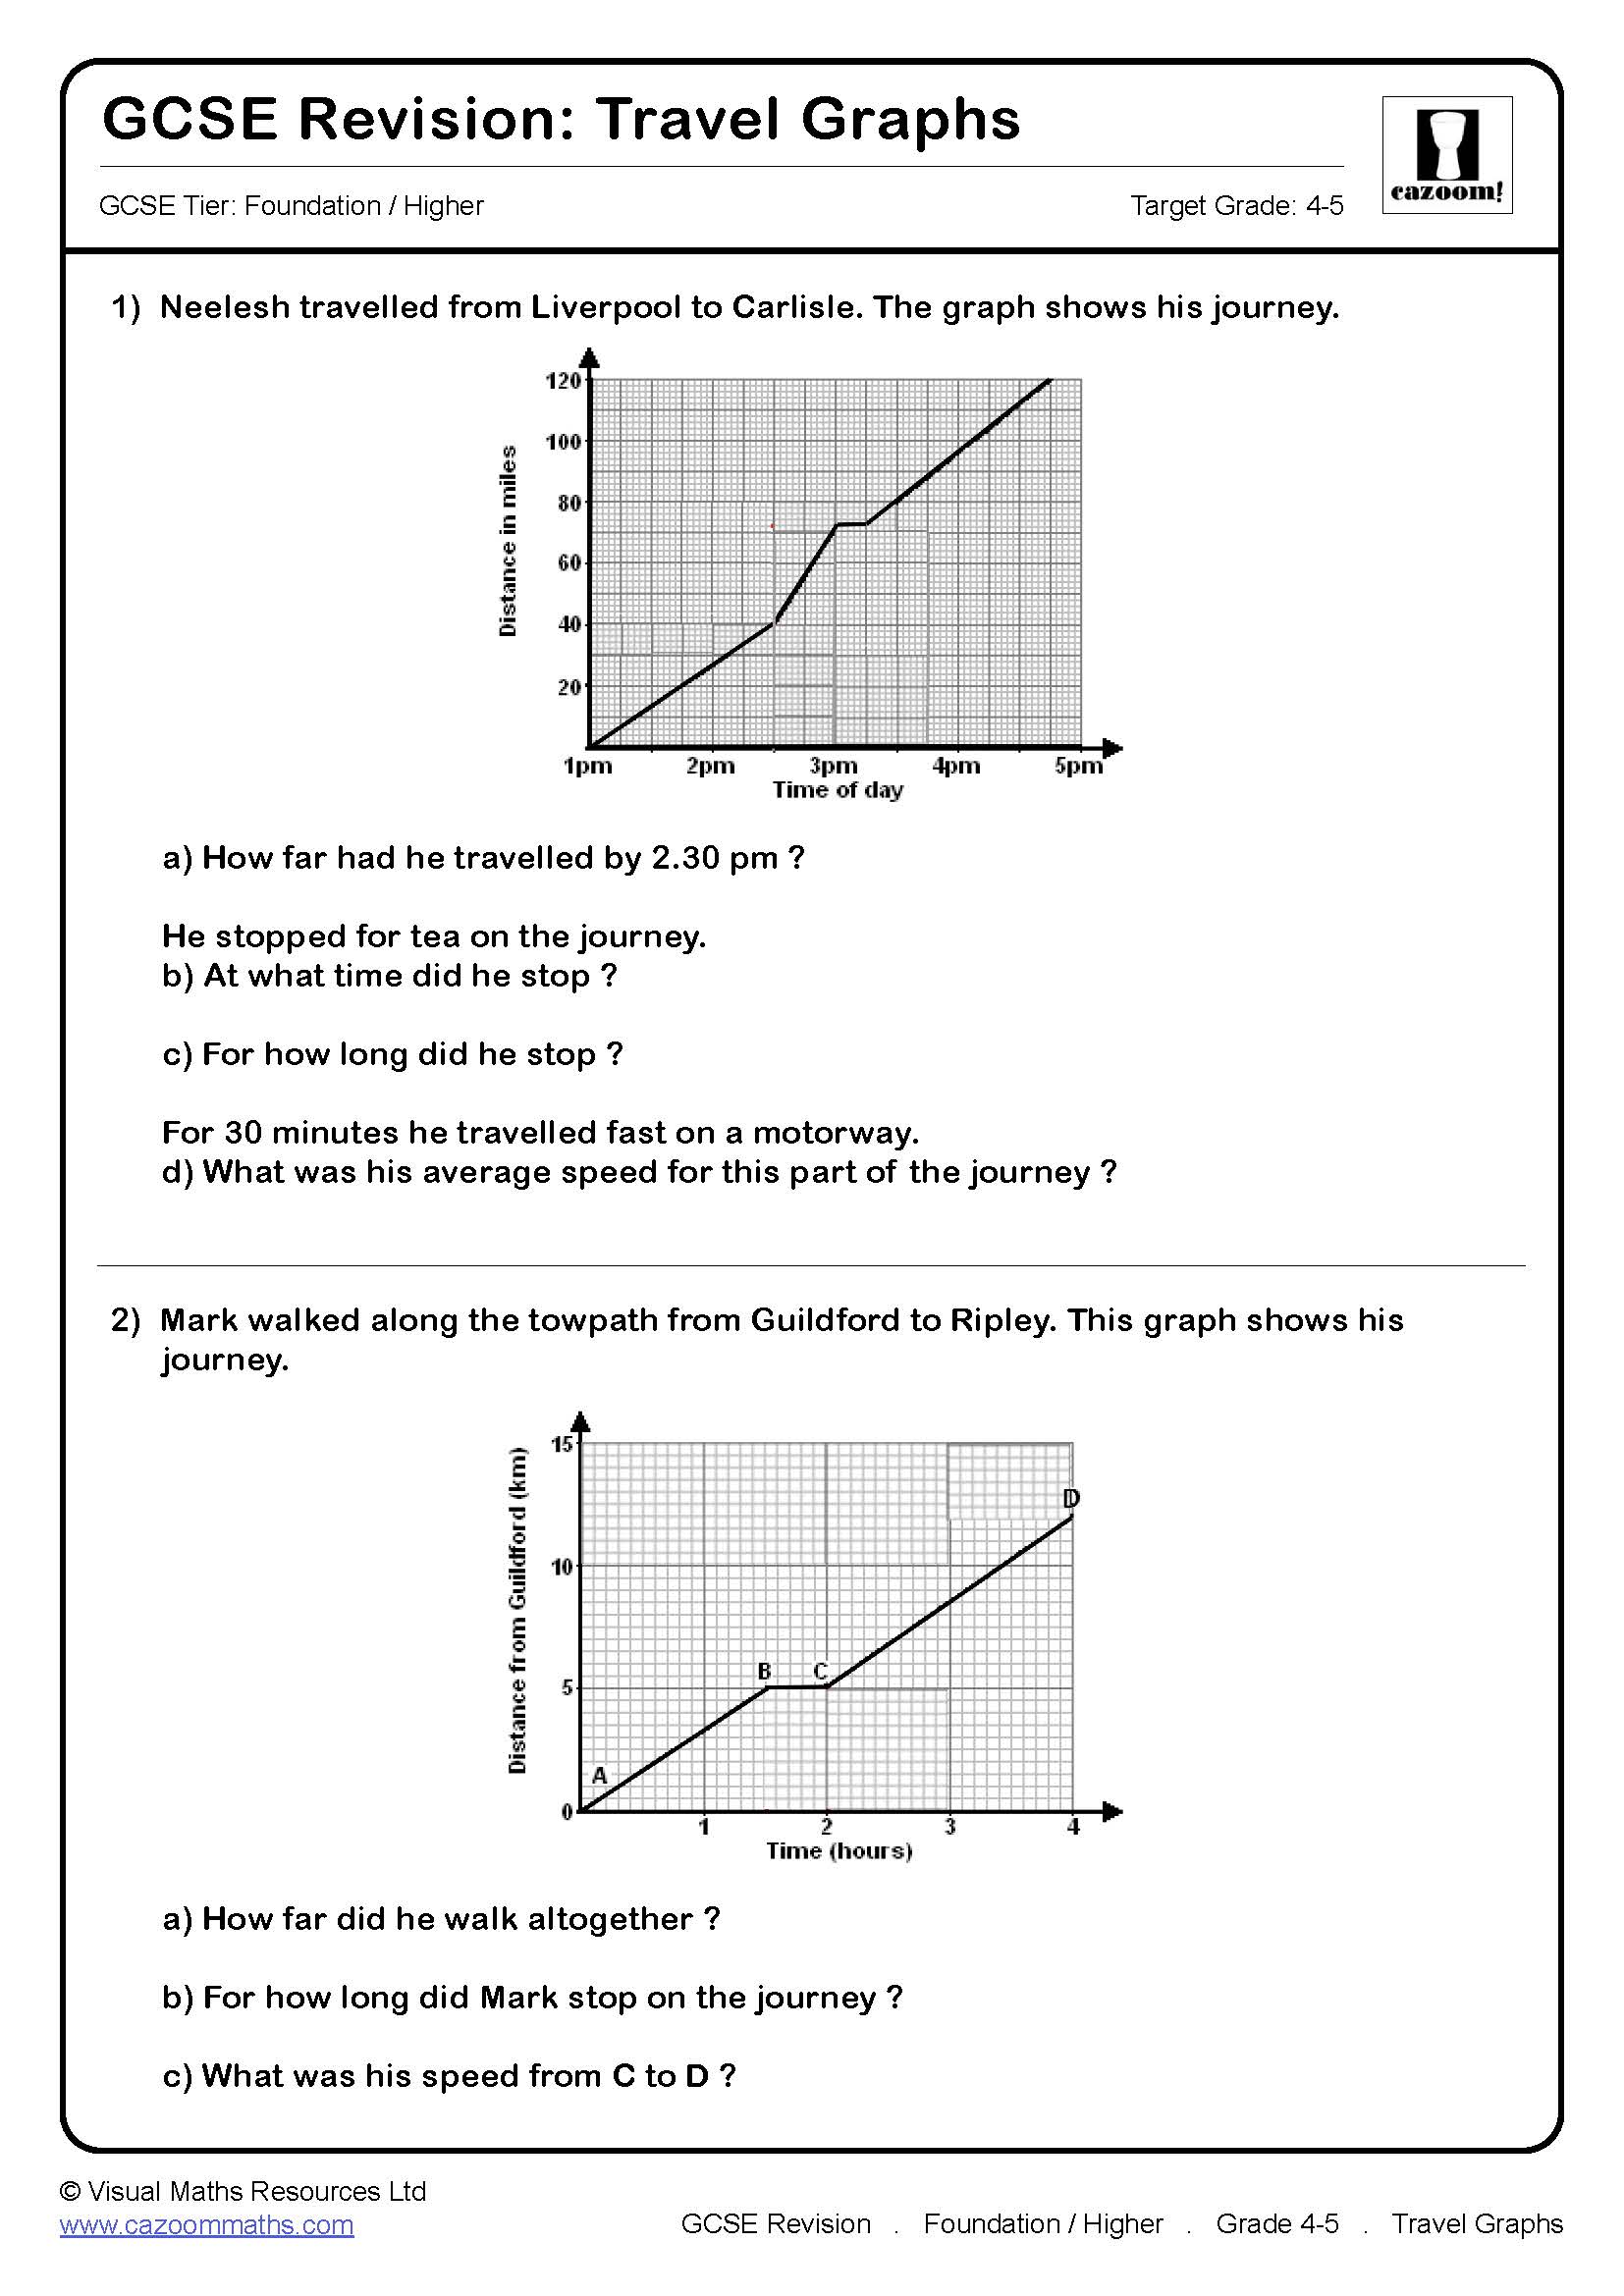
Higher papers typically include two or three real life graphs questions worth between three and six marks each. Students face distance-time graphs requiring gradient calculations to find average speed, velocity-time graphs where they must calculate areas under the graph to find distance travelled, and conversion graphs involving currency, fuel consumption or density. Multi-step questions might combine graph interpretation with algebraic reasoning or require students to sketch graphs from written descriptions showing changing rates.
Exam mark schemes penalise students who read values inaccurately or fail to show working when calculating gradients. Teachers notice that Higher candidates often lose marks by not identifying which variable represents which axis, particularly when graphs show unfamiliar contexts like water depth against time or temperature changes during chemical reactions.
What grade are Real Life Graphs questions on Higher GCSE maths?
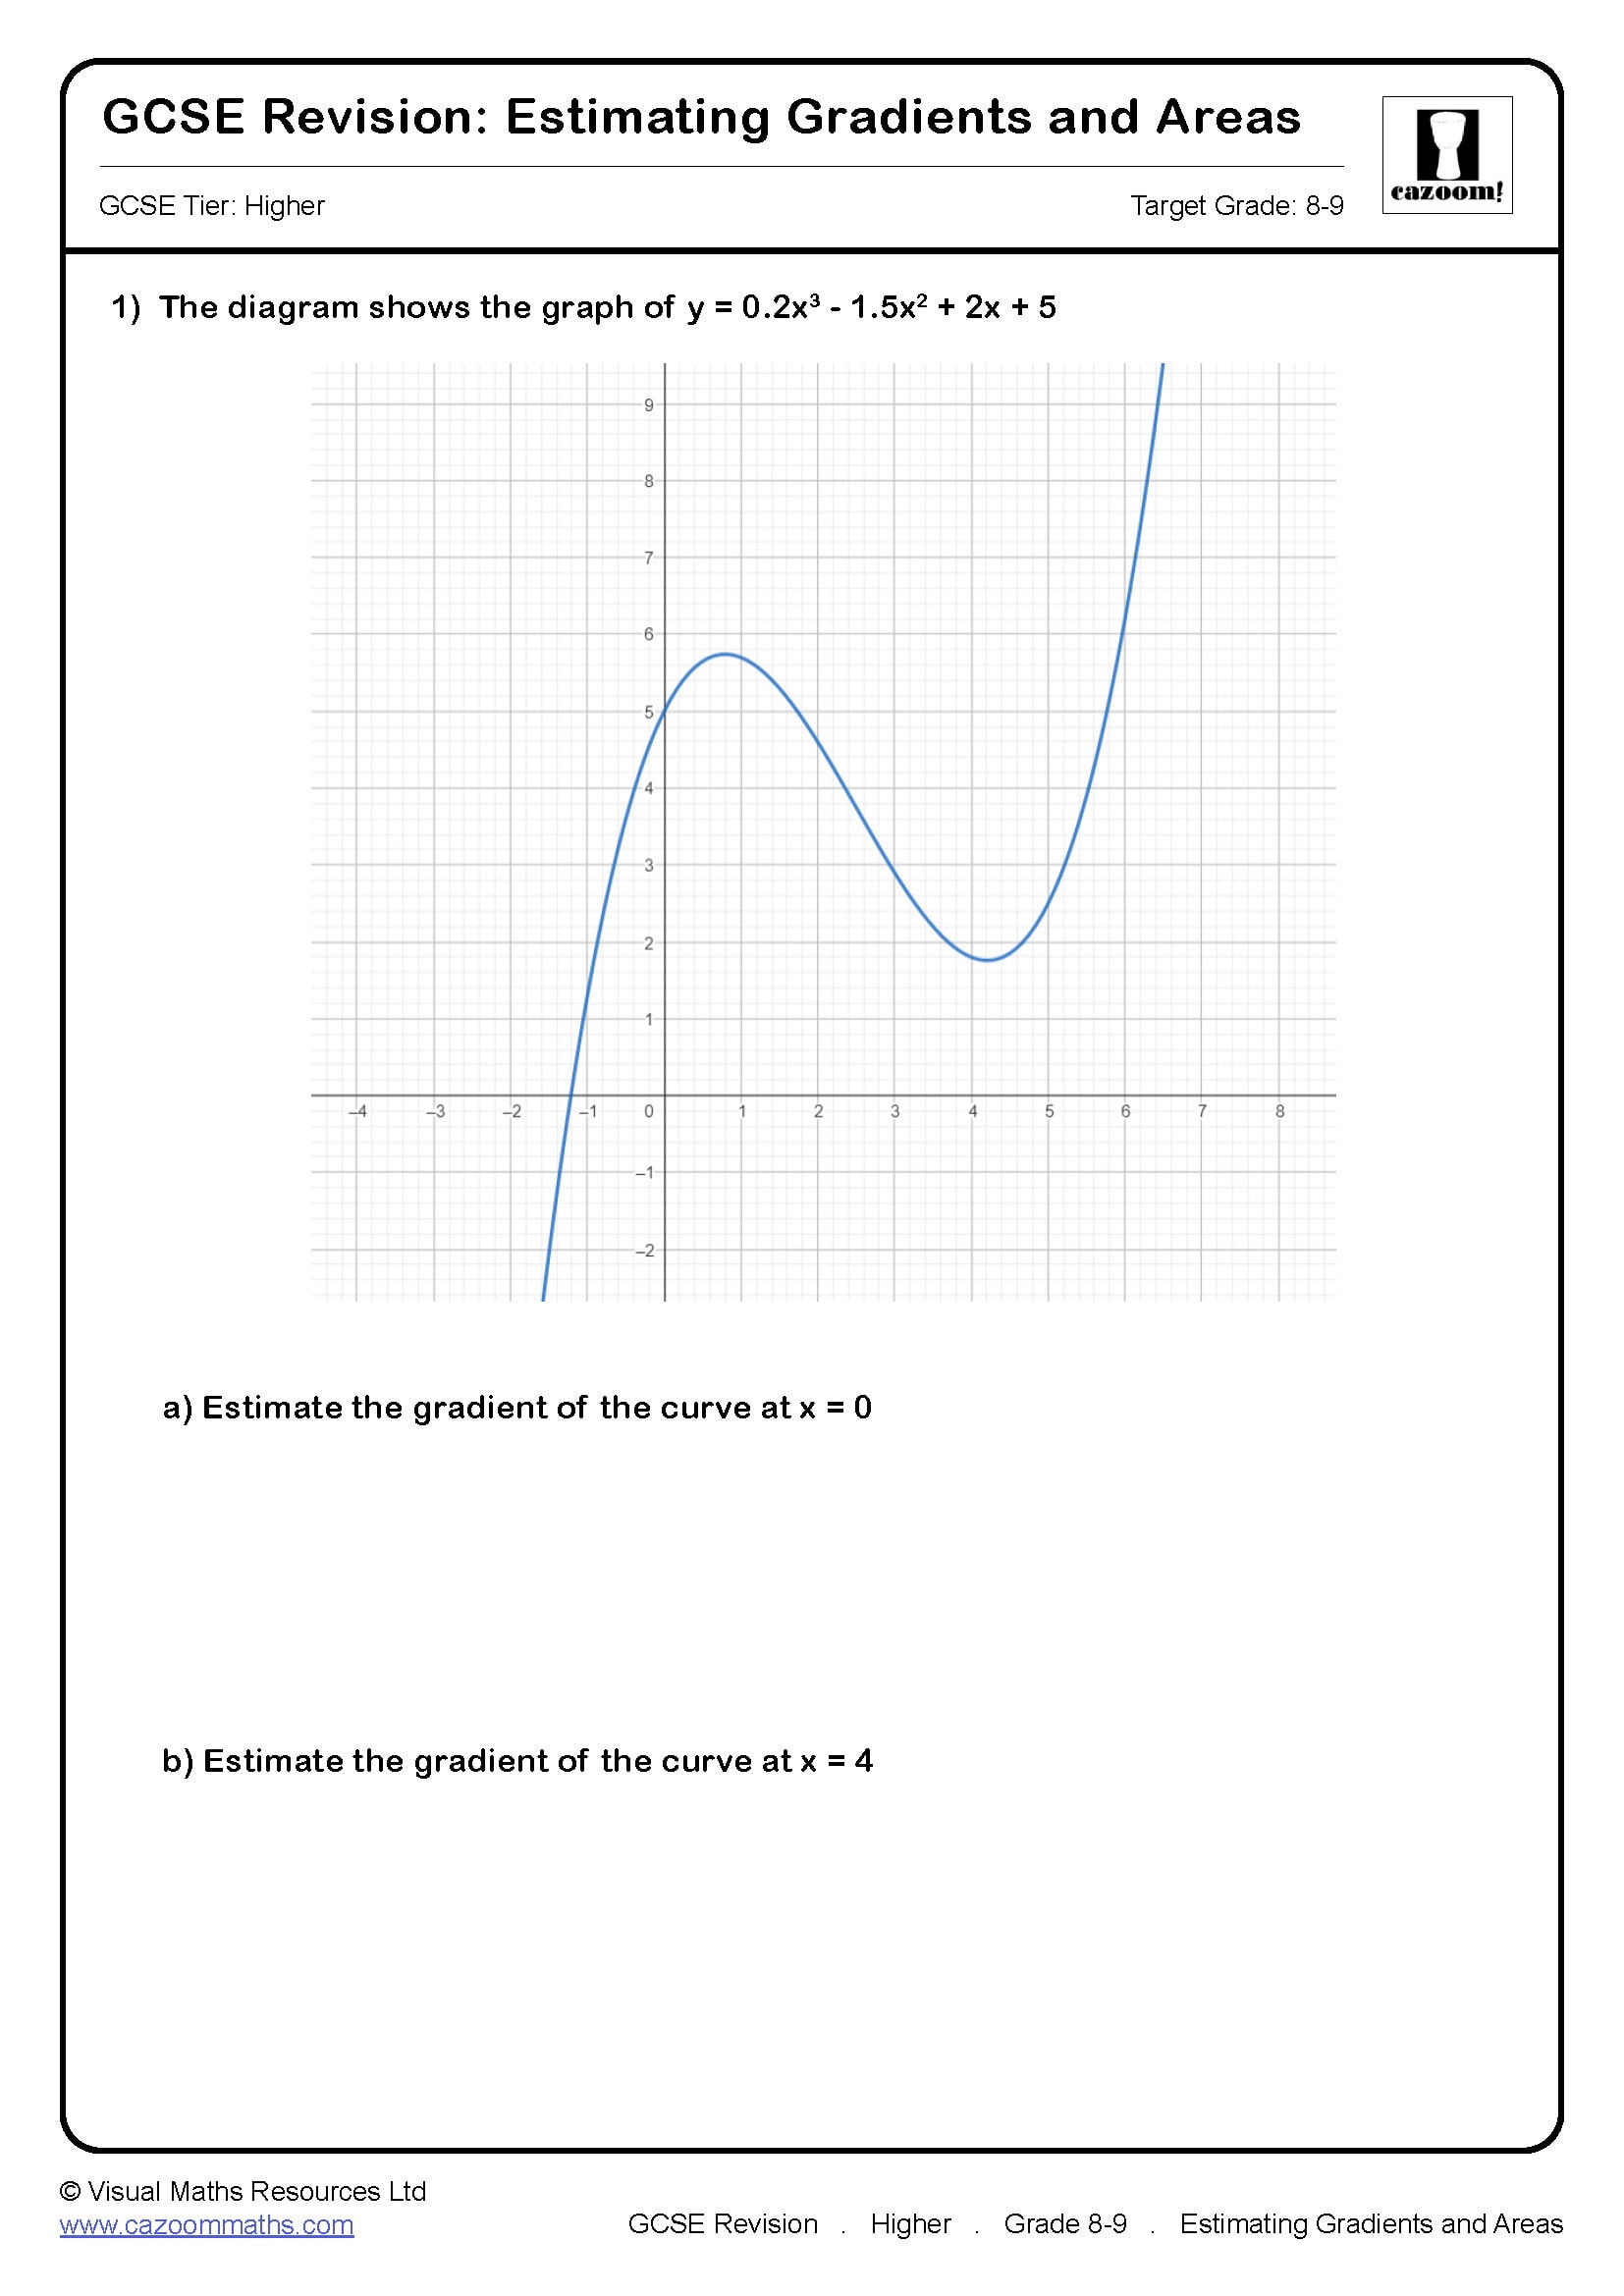
Foundation-style real life graphs questions targeting grades 4-5 appear early on Higher papers, testing straightforward distance-time interpretation and simple gradient calculation. Mid-tier questions at grades 6-7 introduce velocity-time graphs, require students to calculate acceleration from gradients, or involve sketching graphs showing changing rates. Grade 8-9 questions combine multiple graph types, demand precise reasoning about curved sections, or require algebraic manipulation alongside graphical interpretation.
Students should identify their current working grade and target worksheets accordingly. Those securing grade 6 benefit from consolidating distance-time fluency before tackling velocity-time graphs, whilst students targeting grades 8-9 need extended practice interpreting non-linear relationships and justifying observations about gradient changes using contextual understanding.
How is Real Life Graphs tested differently on Higher compared to Foundation?
Foundation papers focus on reading values from distance-time graphs and interpreting what horizontal or steeper sections represent, with basic gradient calculation rarely required. Higher papers assume these skills are secure and instead test velocity-time graphs almost exclusively, expecting fluent gradient calculation to find acceleration and area calculation to find distance. Higher questions involve more complex contexts like fuel consumption graphs, compound measure conversions, or graphs showing exponential growth or decay.
This depth matters because Higher students must work algebraically with gradients, recognising that gradient represents rate of change and connecting this to formulae. Teachers notice that students who struggle with simultaneous equations or rearranging formulae often falter on Higher real life graphs, as questions increasingly blend graphical interpretation with algebraic reasoning.
How should students revise Real Life Graphs for Higher GCSE maths?
Students should work through worksheets in grade order, beginning with distance-time graphs to secure gradient calculation, then progressing to velocity-time graphs and conversion contexts. Timed practice builds exam pace, whilst checking answers immediately after each worksheet identifies persistent errors like sign mistakes when calculating negative gradients. Higher students benefit from annotating graphs during revision, labelling axes carefully and marking key features like maximum points or gradient changes.
Teachers can use these worksheets as low-stakes assessments to identify which students need intervention with unit conversion or gradient interpretation. Setting targeted homework based on individual grade gaps ensures students revise appropriate content. Pairing worksheets with past paper questions consolidates skills, particularly for grade 7-9 students who need varied contexts to develop robust graphical reasoning.