KS3 Real Life Graphs Worksheets
All worksheets are created by the team of experienced teachers at Cazoom Maths.
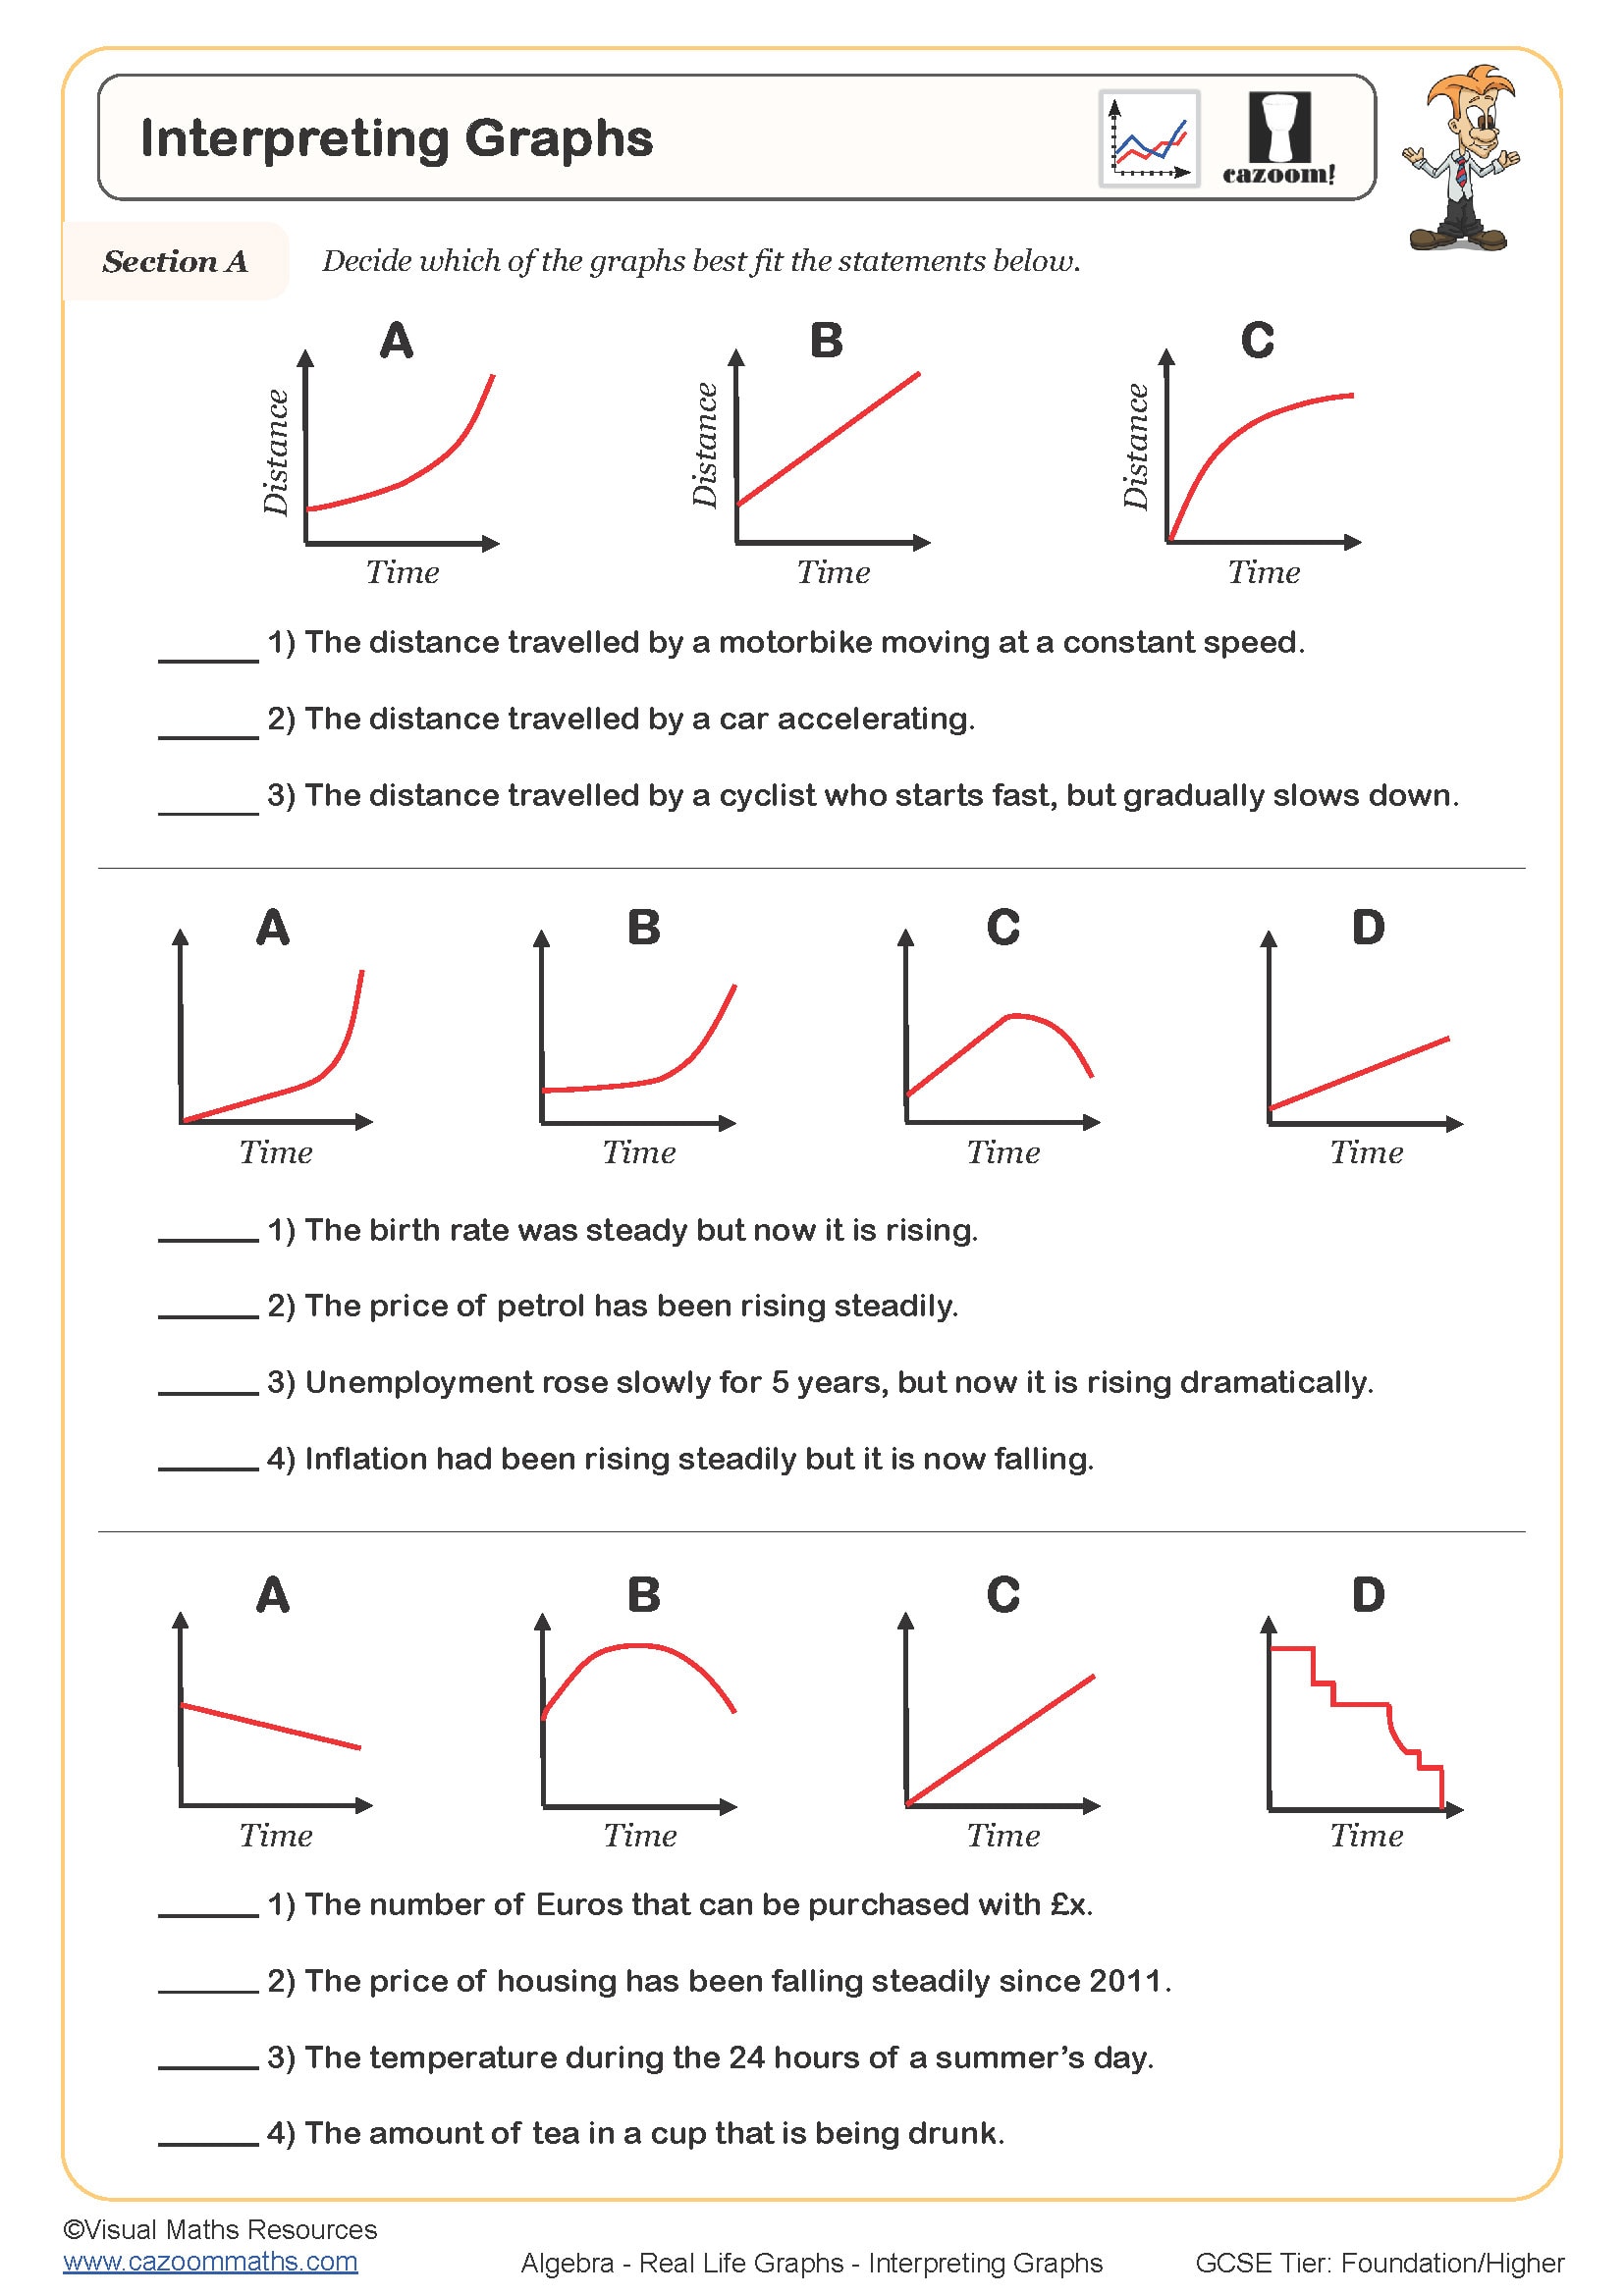
What Are Real Life Graphs in Maths?
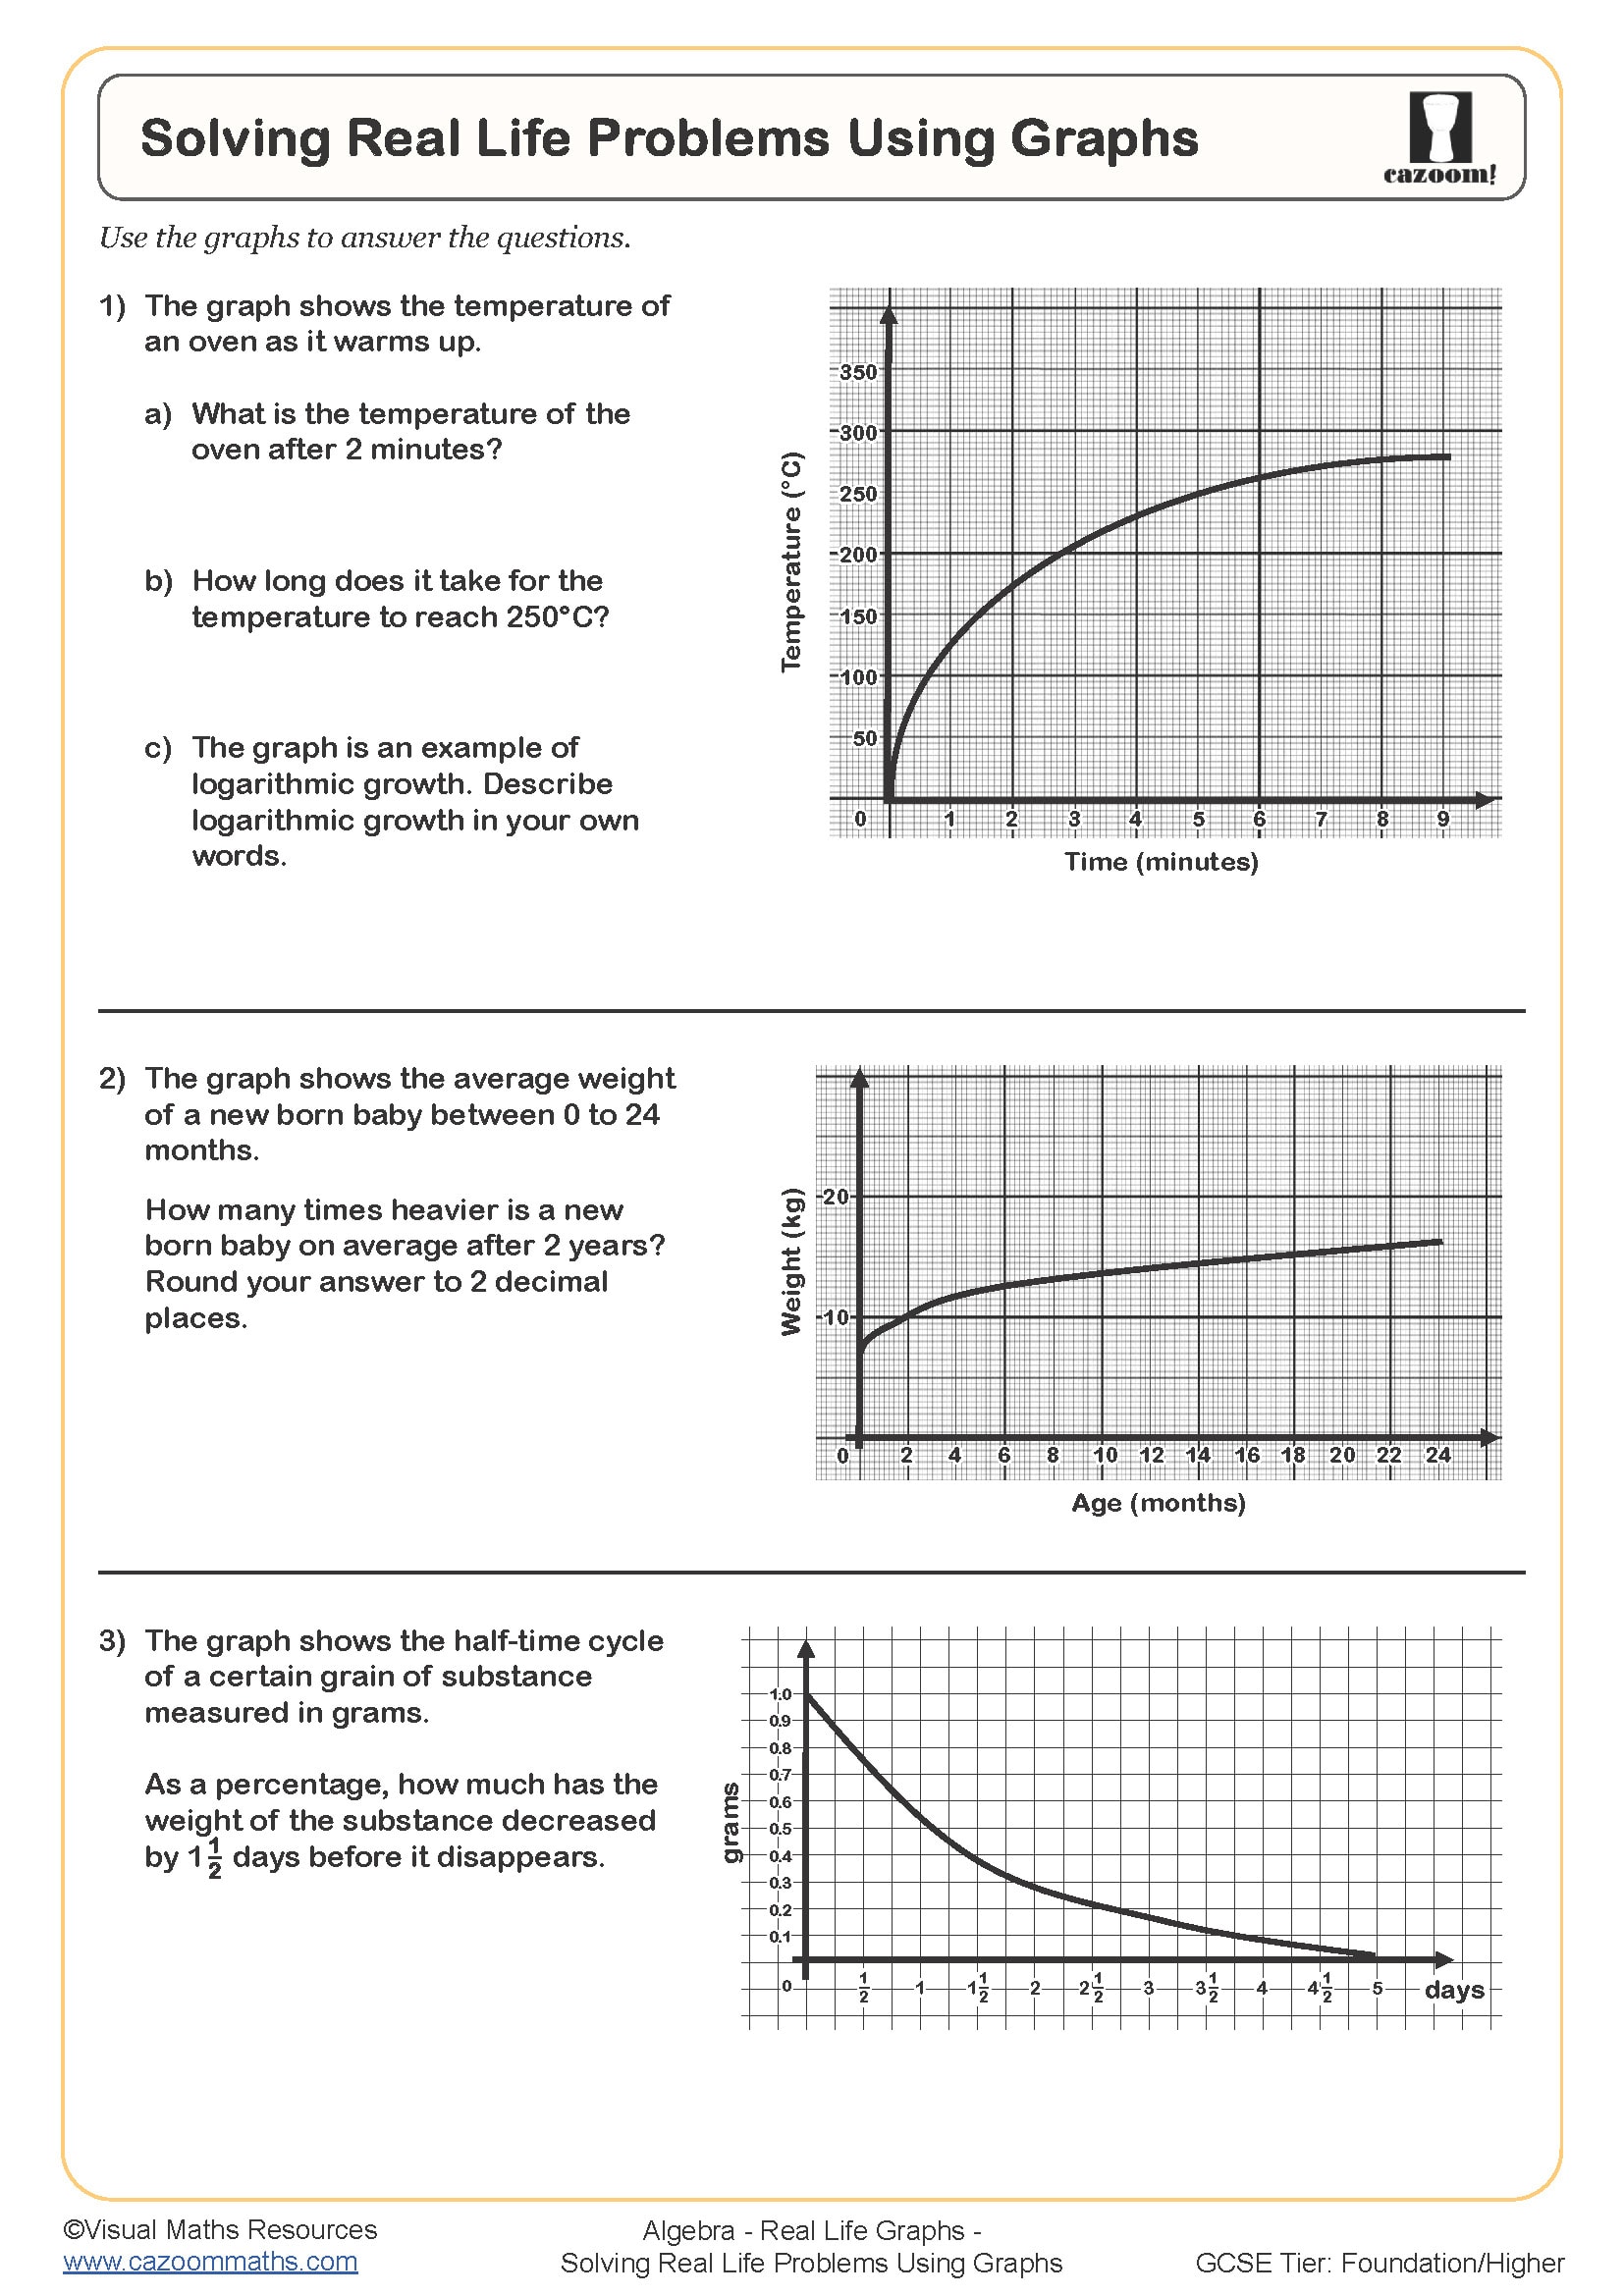
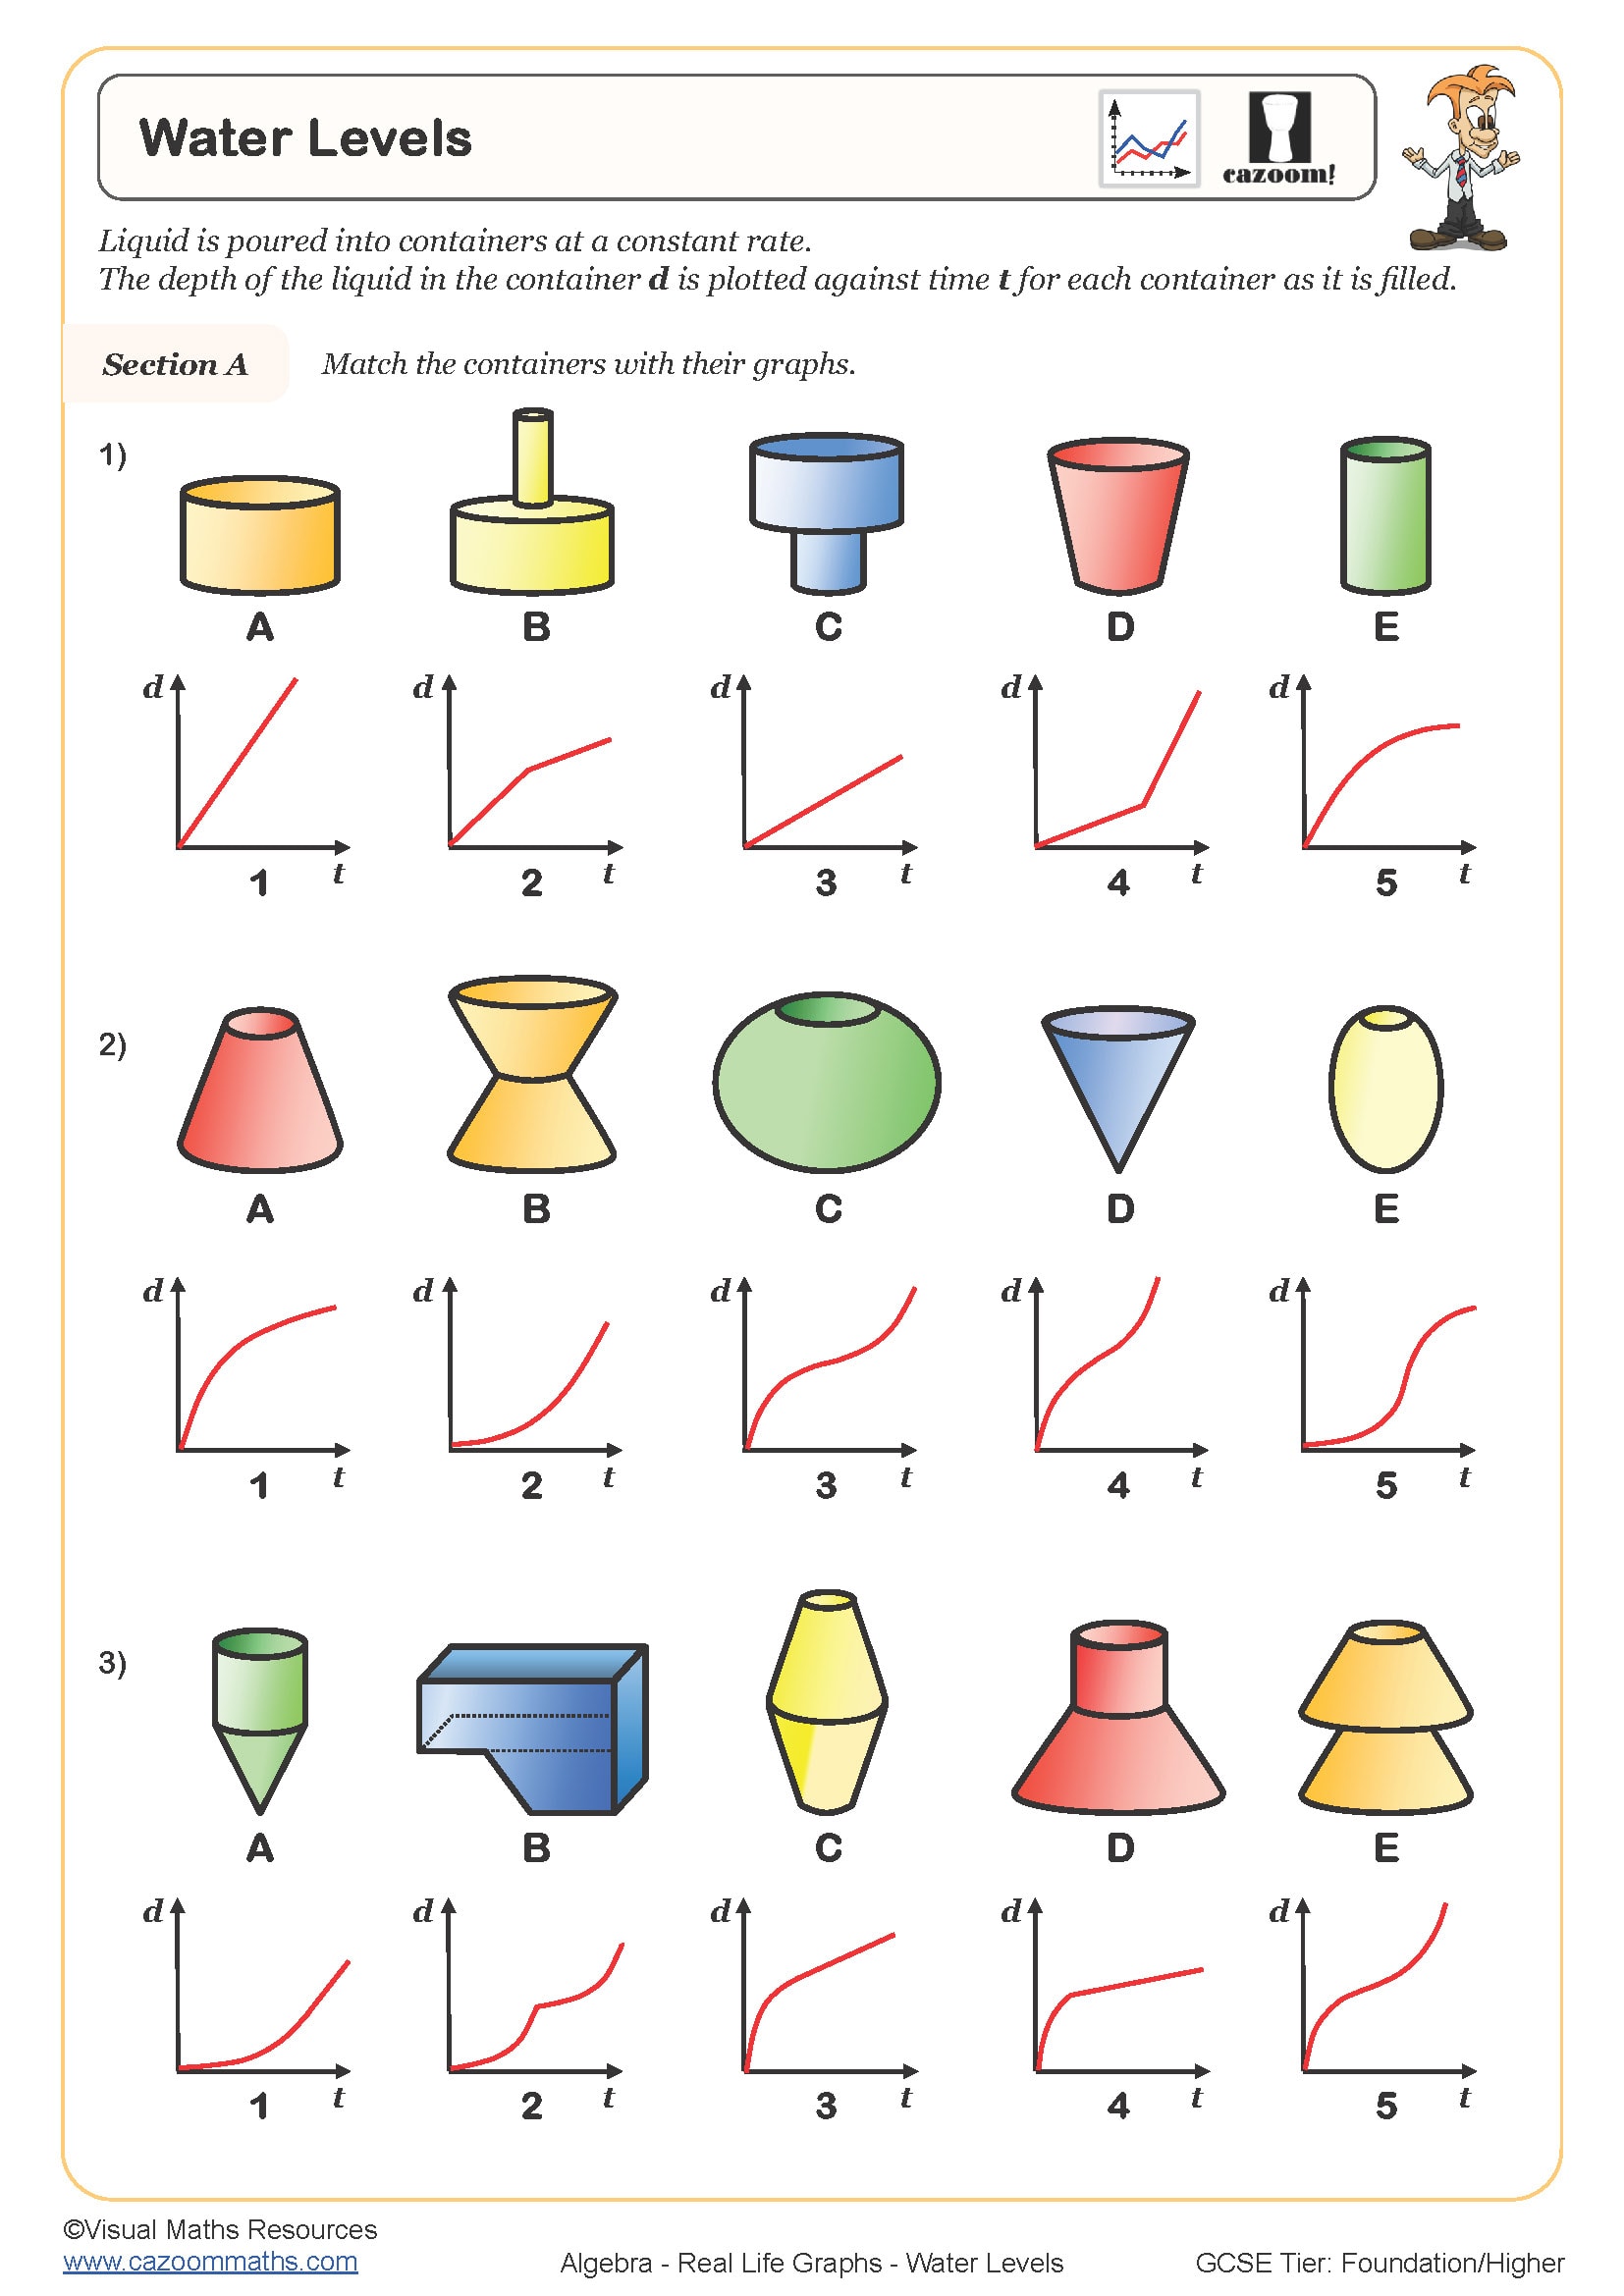
Real life graphs represent practical situations using mathematical relationships, such as how distance changes over time during a journey, how temperature varies throughout a day, or how cost relates to quantity purchased. In the KS3 curriculum, students move from plotting abstract coordinates to reading and drawing graphs that model everyday contexts, requiring them to interpret axes, gradients, and features like peaks or plateaus within a meaningful scenario.
A common error occurs when students treat these graphs like algebra exercises, focusing on calculations without considering whether their answer makes sense in context. For example, when reading a distance-time graph, students might correctly identify a speed of 80 km/h but fail to recognise that a horizontal section means the person has stopped moving. Exam mark schemes consistently expect students to explain graph features using the real-world context, not just state numerical values.
Which Year Groups Study Real Life Graphs?
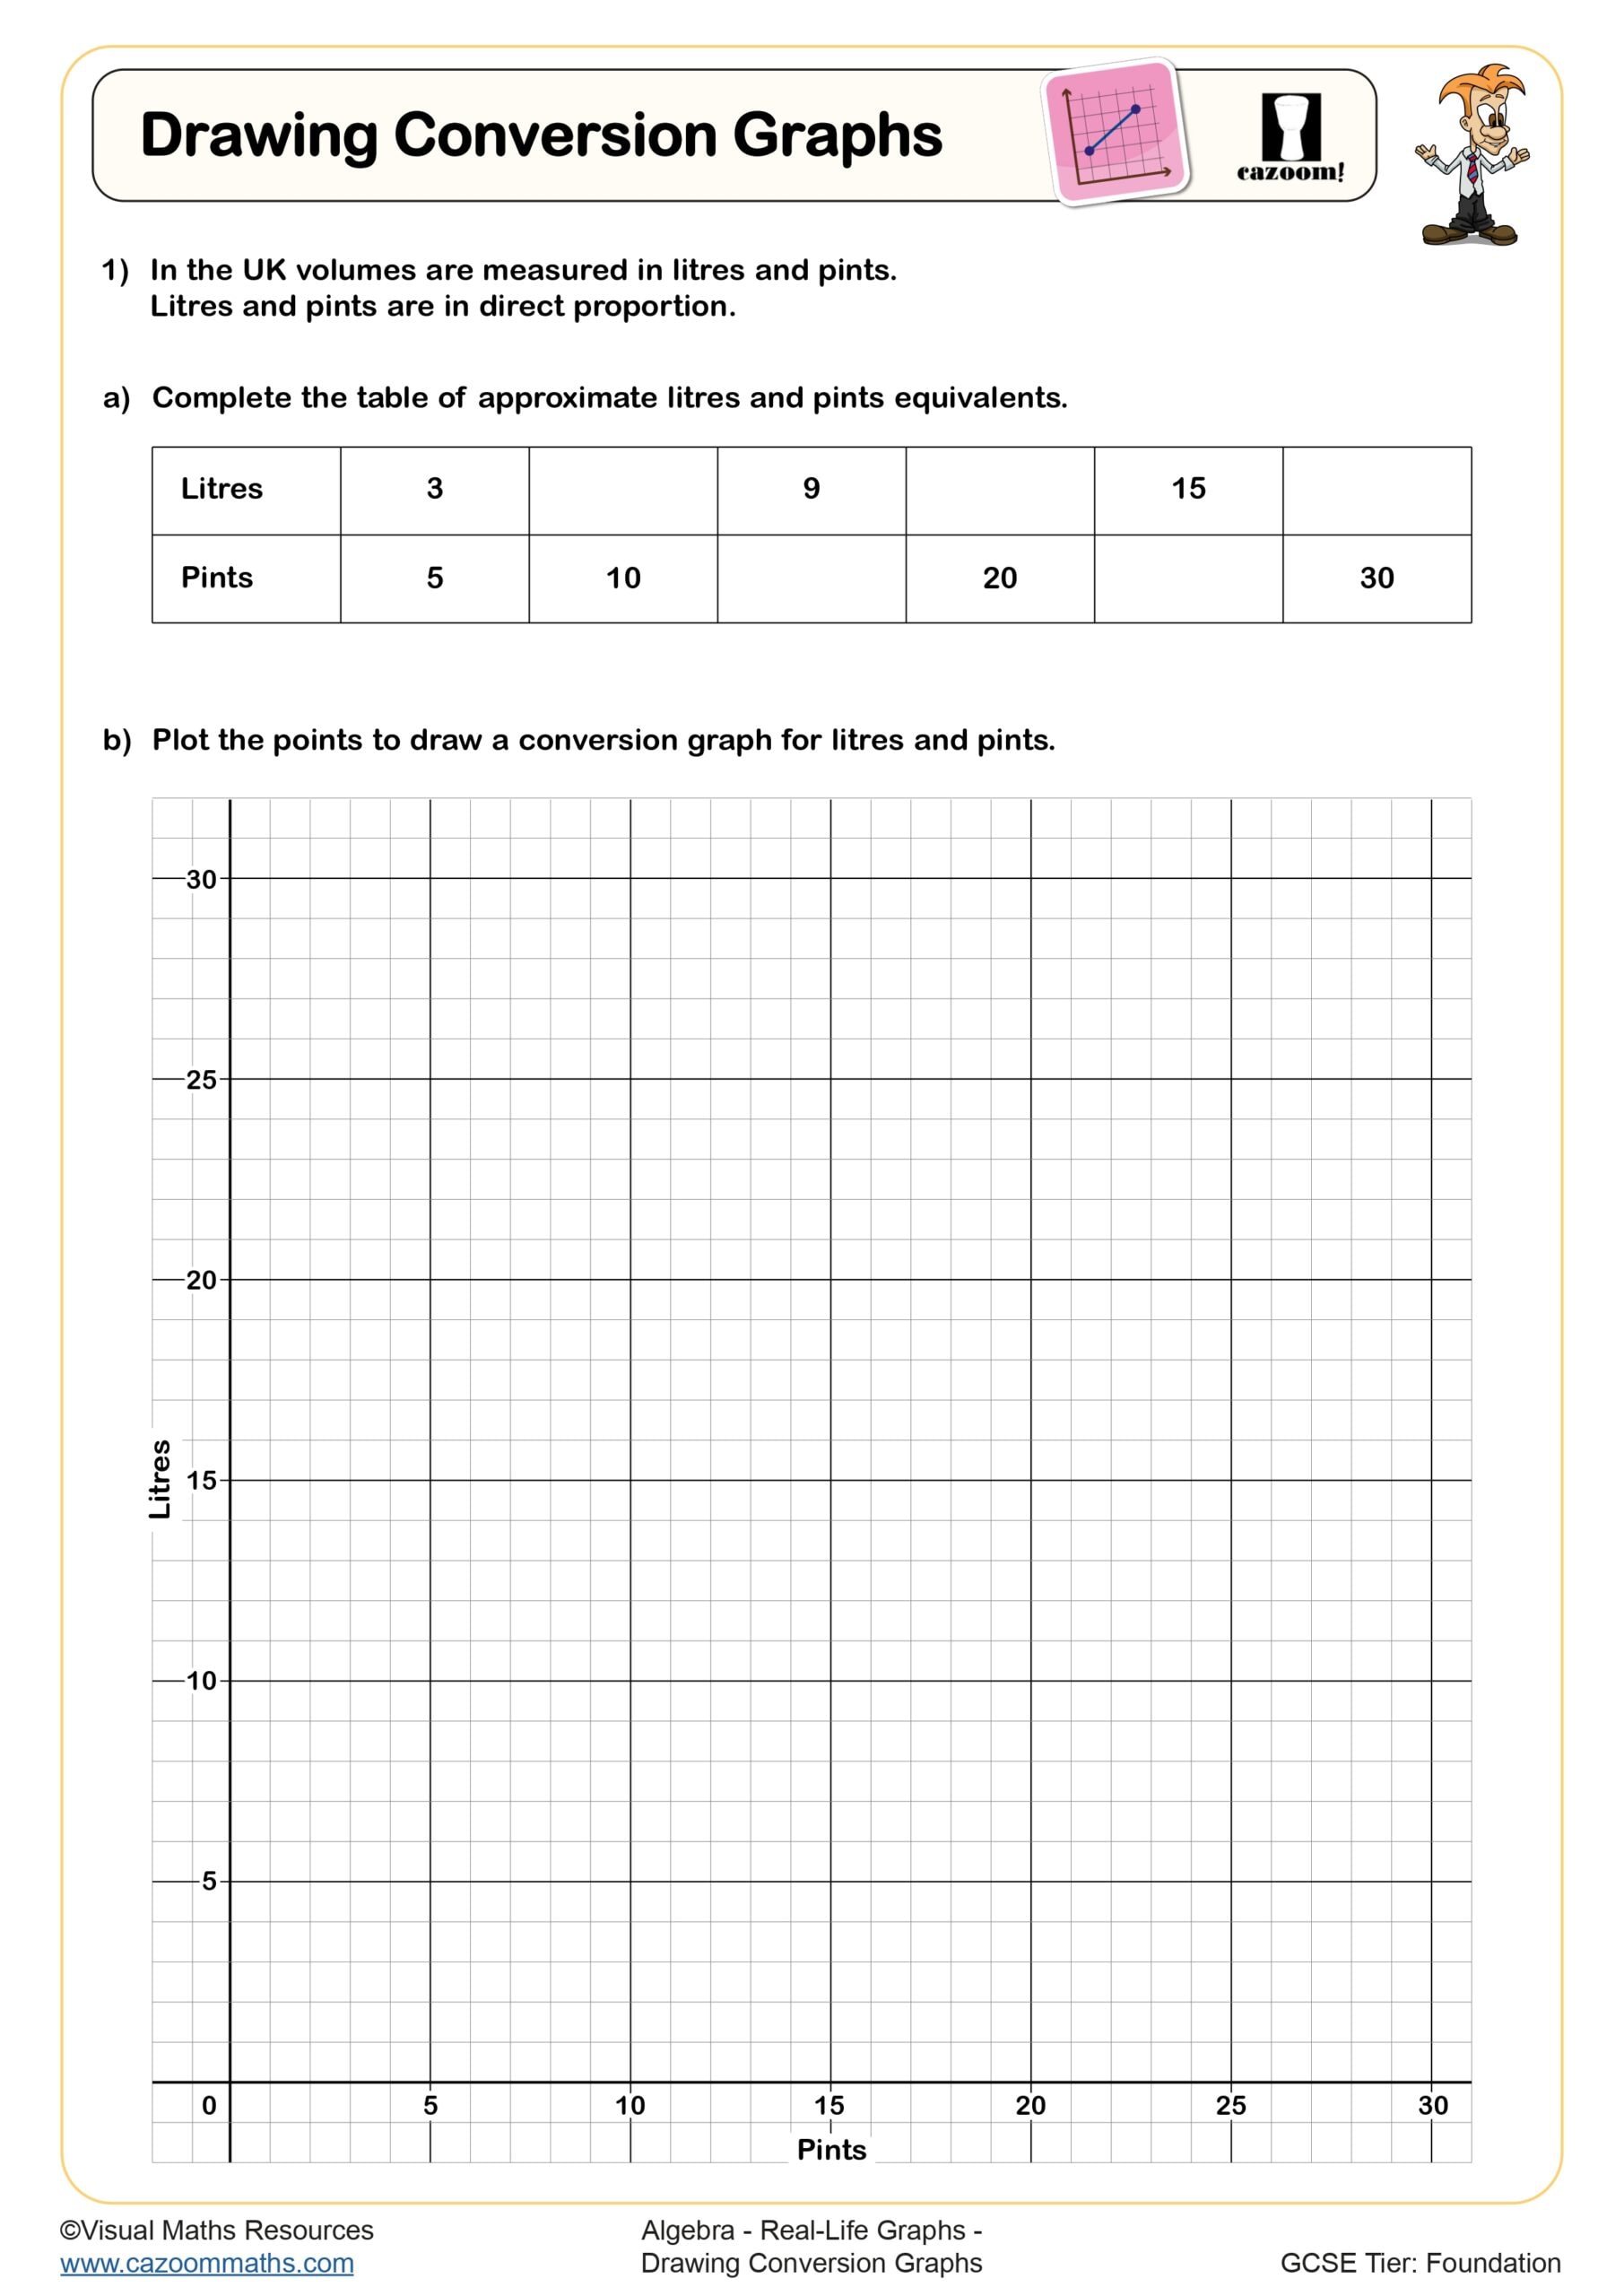
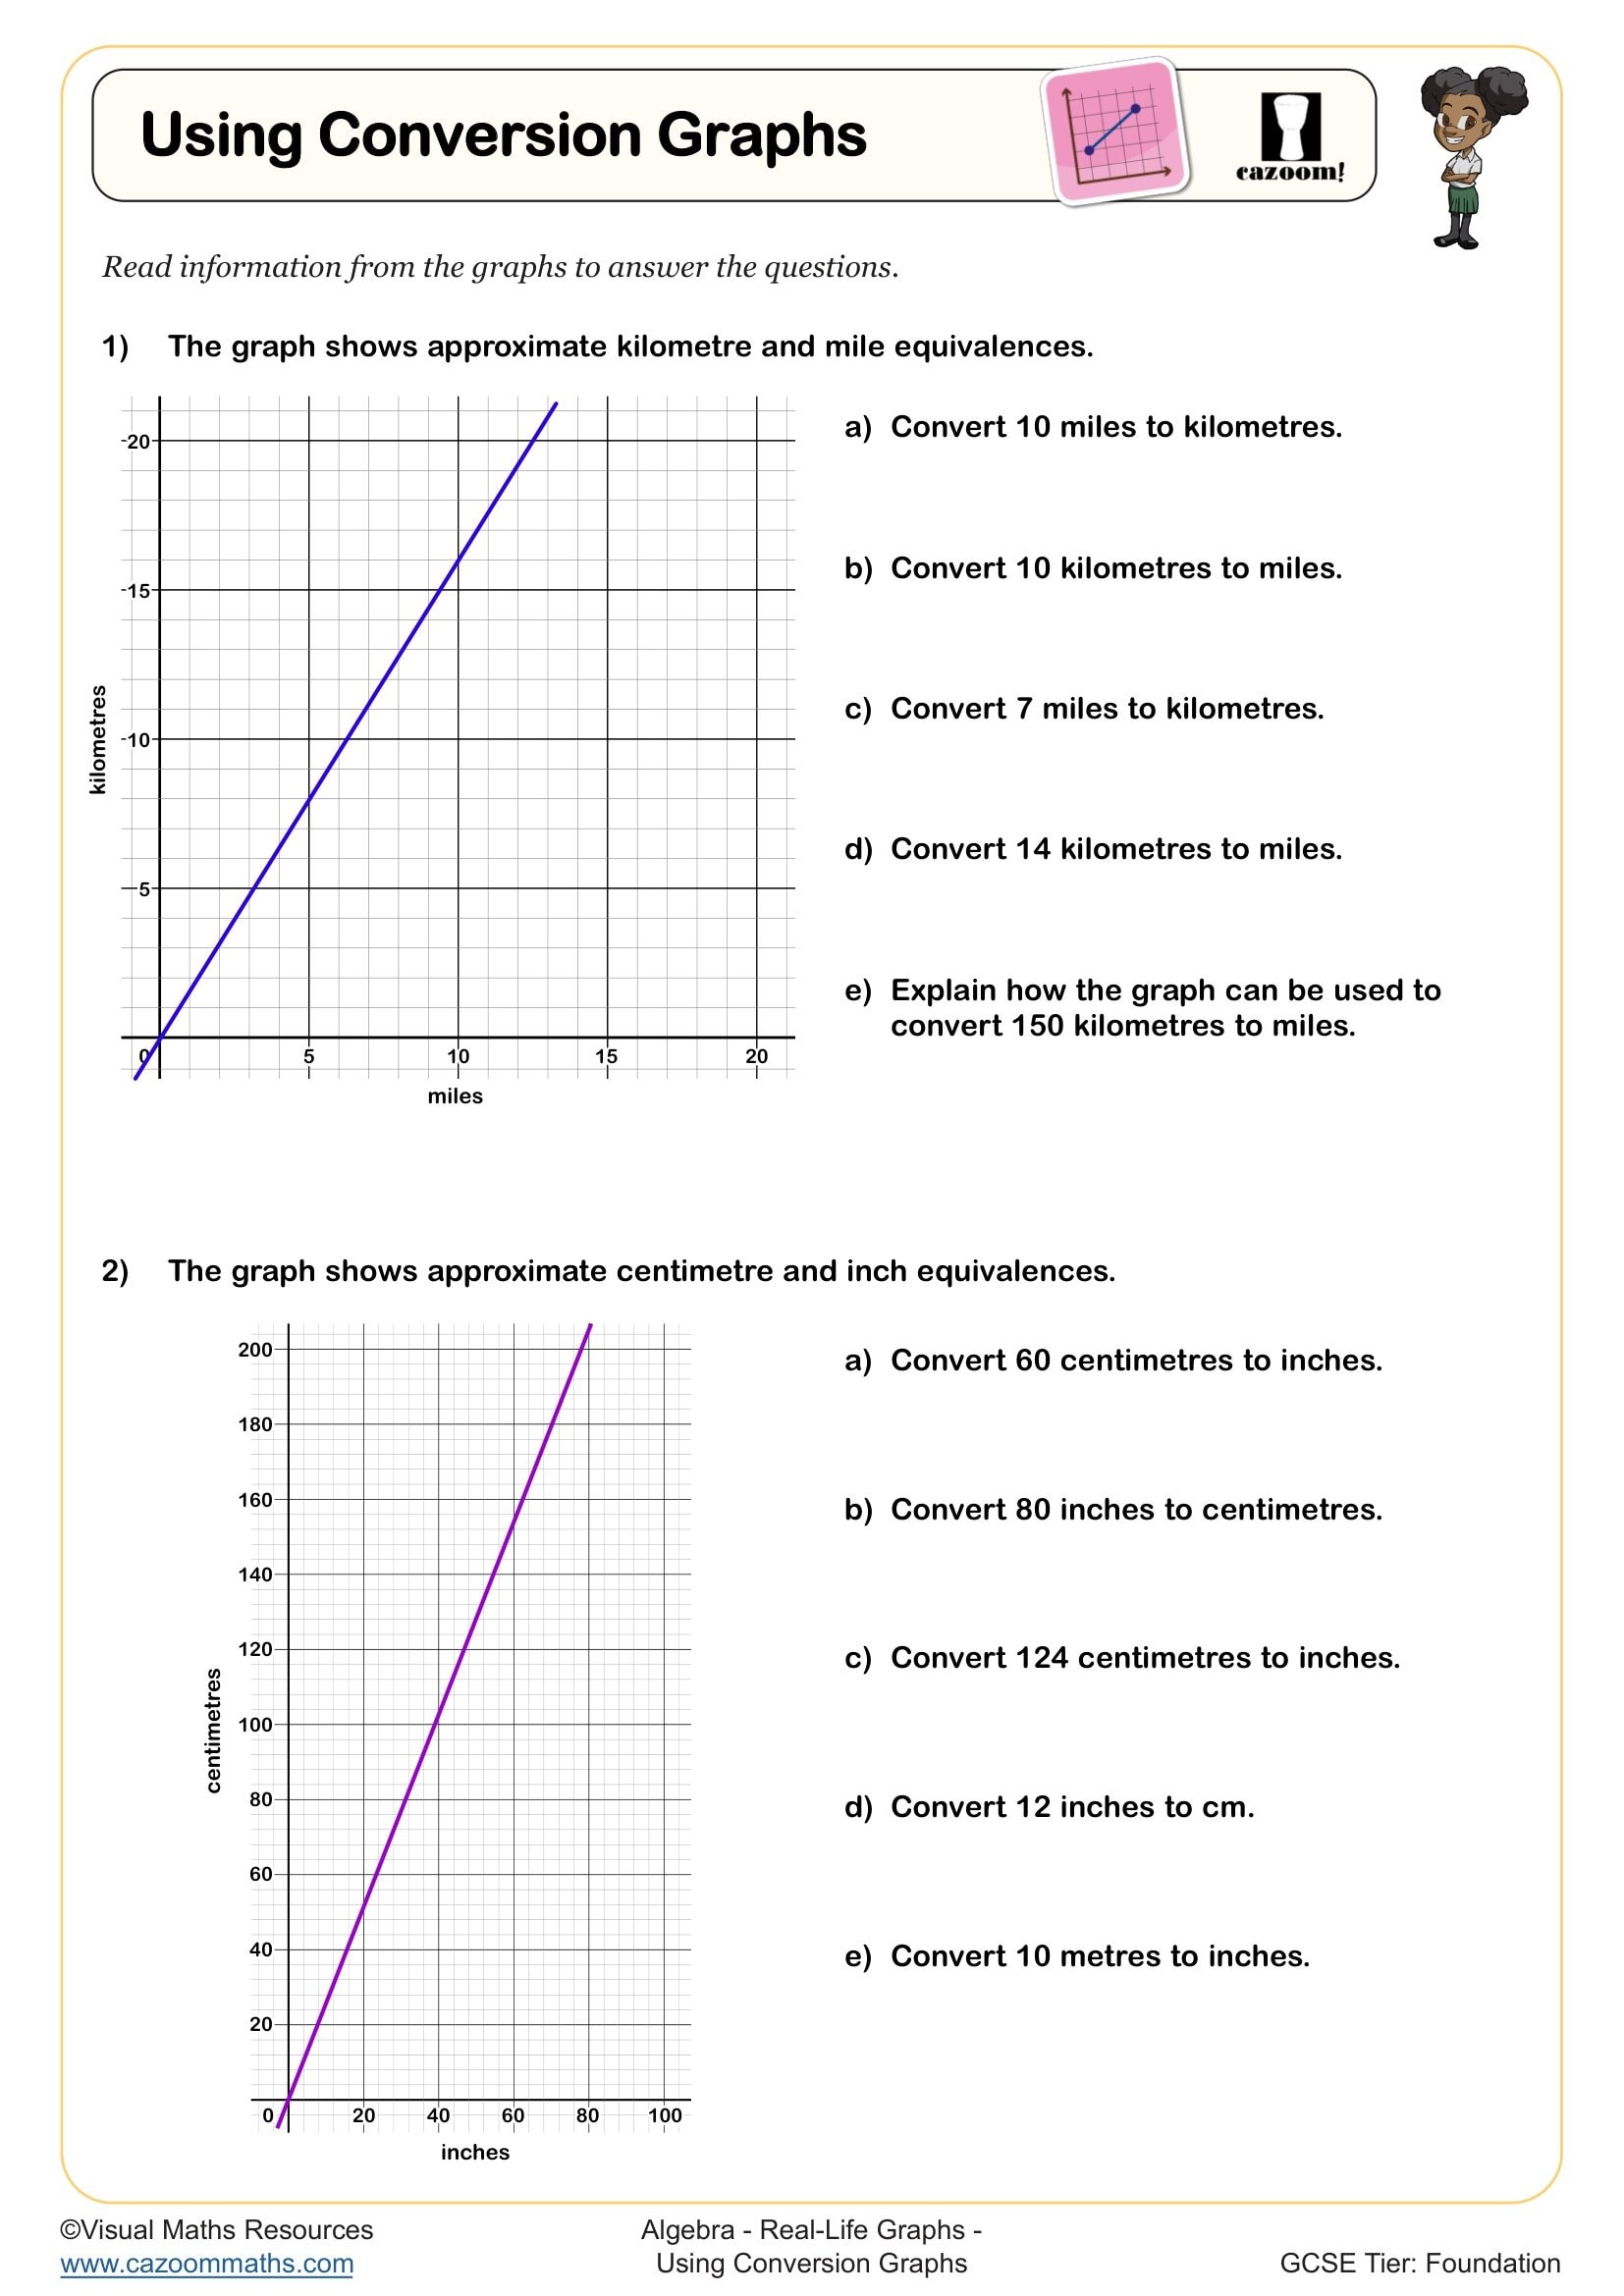
These worksheets cover Year 8 and Year 9 content within Key Stage 3, where real life graphs appear as part of the algebra and ratio strands. Year 8 typically introduces distance-time graphs and simple conversion graphs, whilst Year 9 extends this to more complex scenarios including recognising speed from gradient and comparing multiple journeys on the same axes.
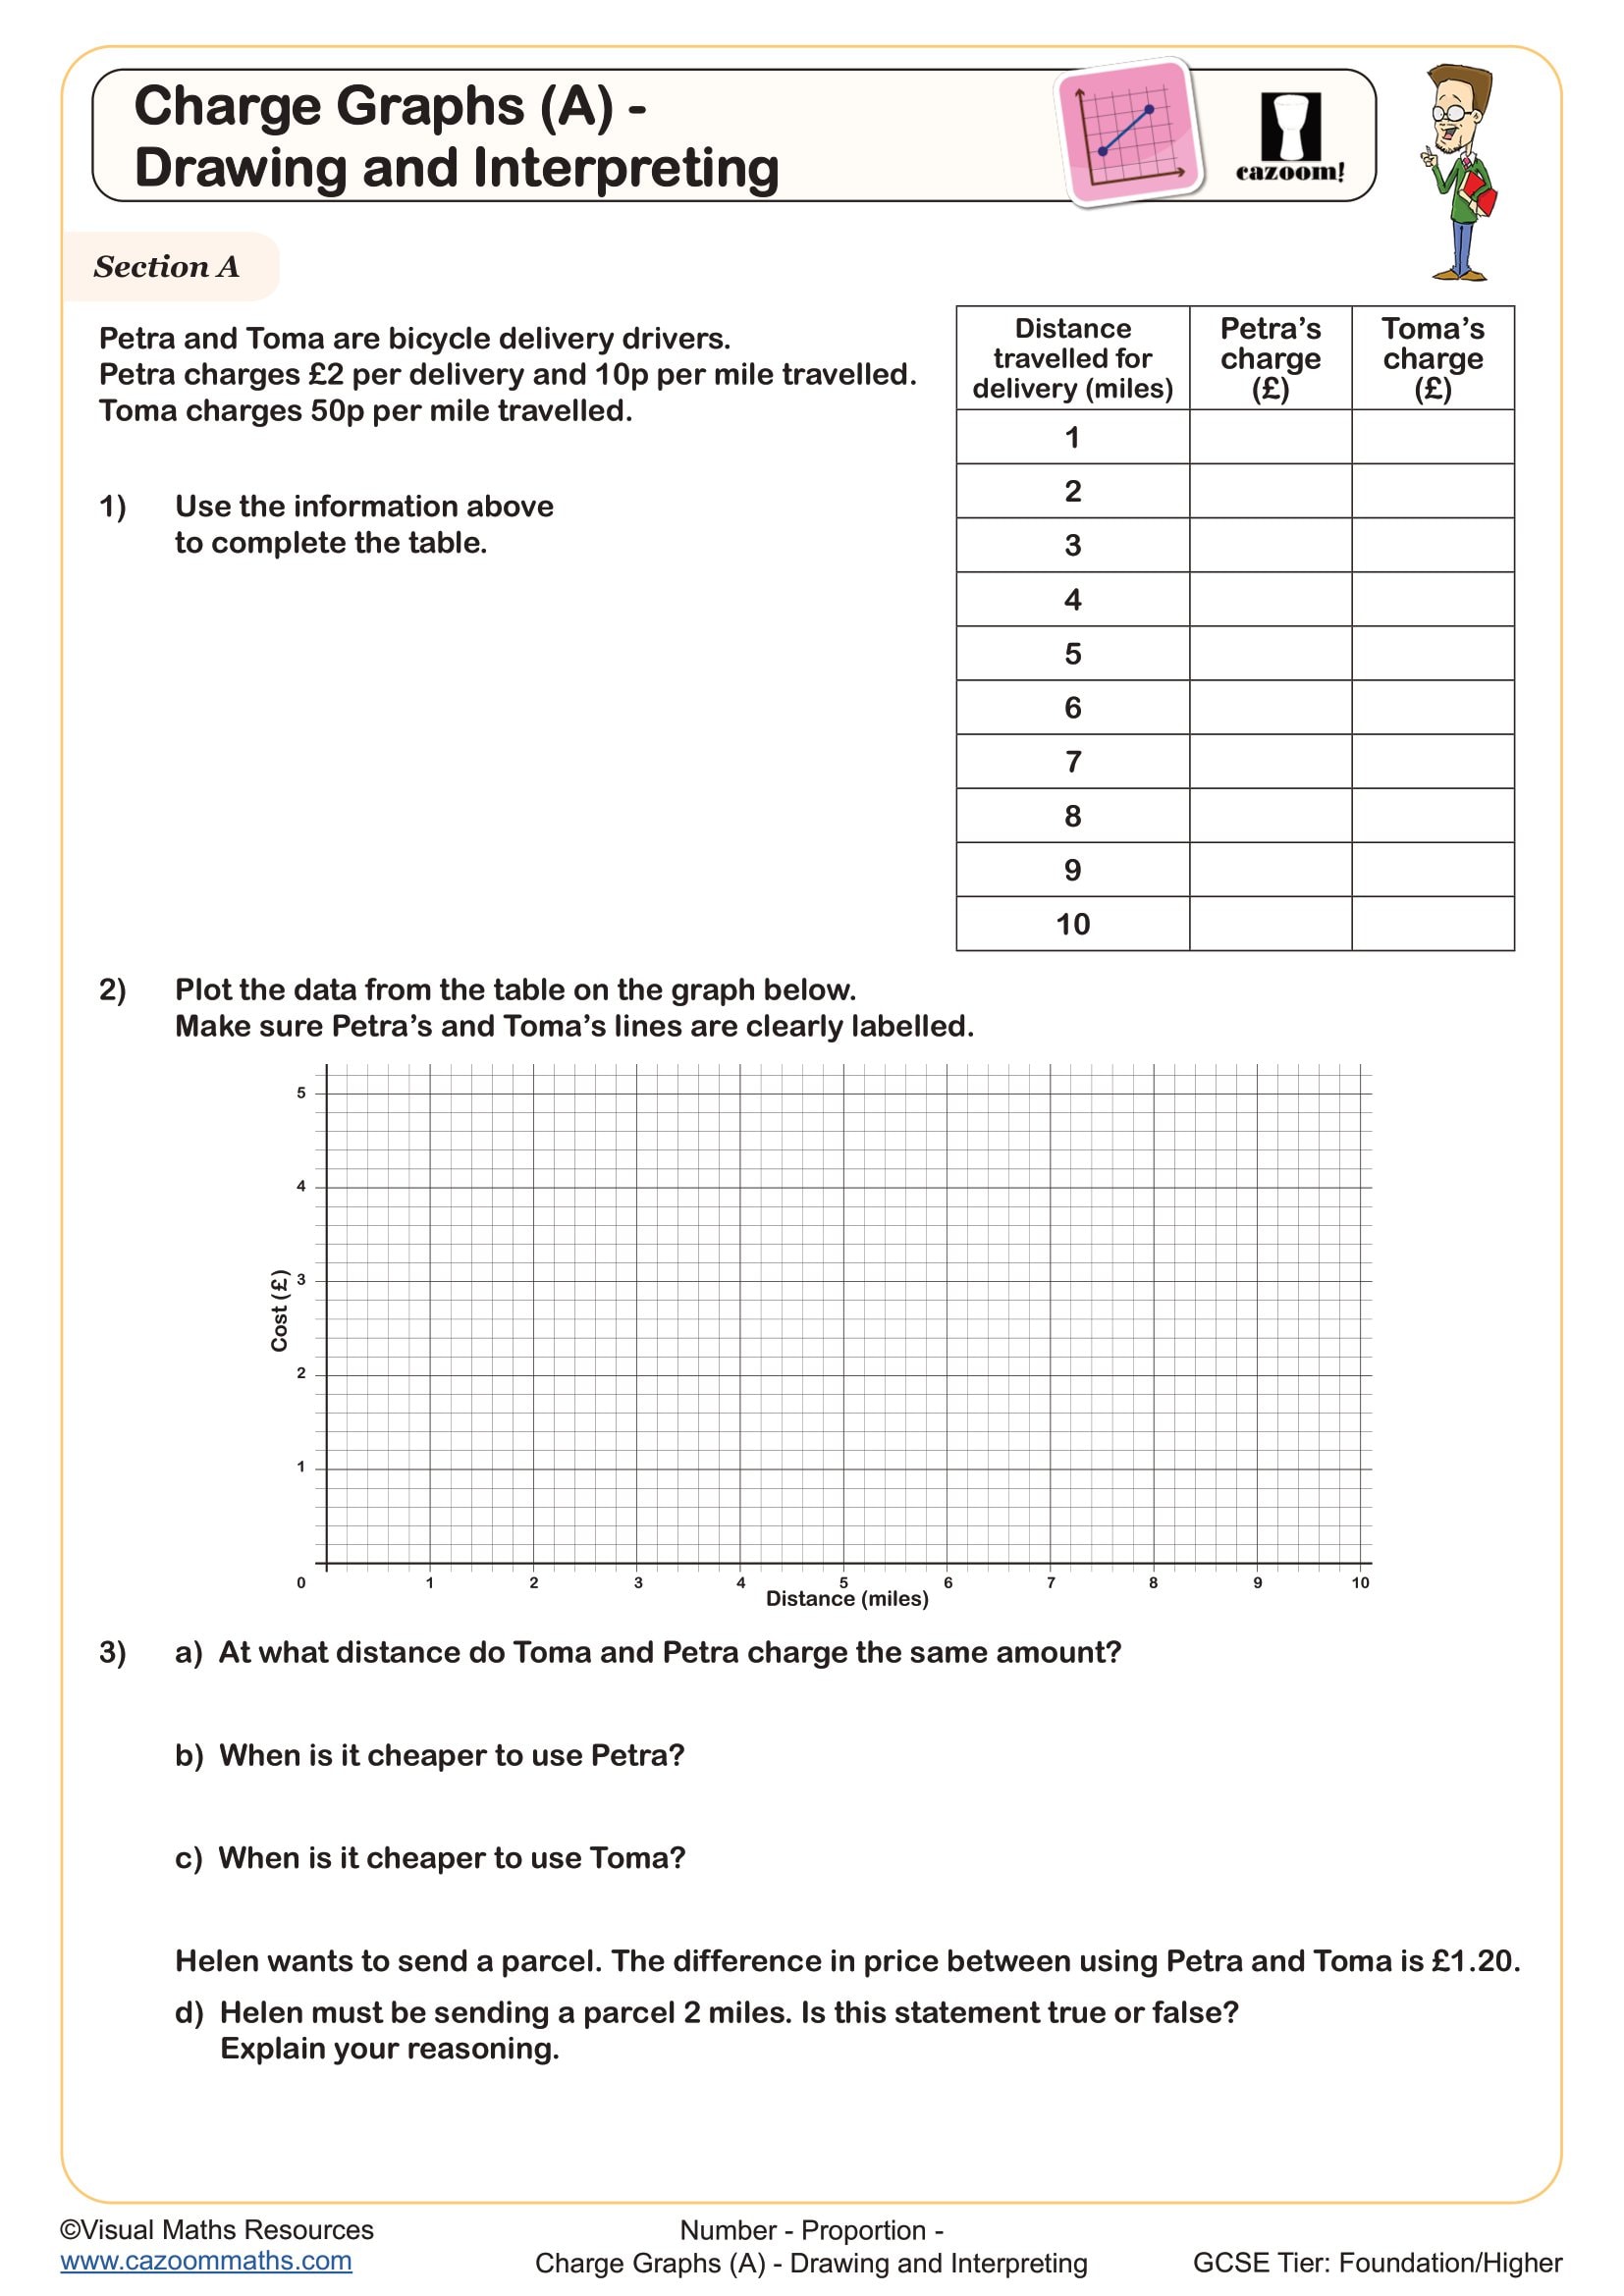
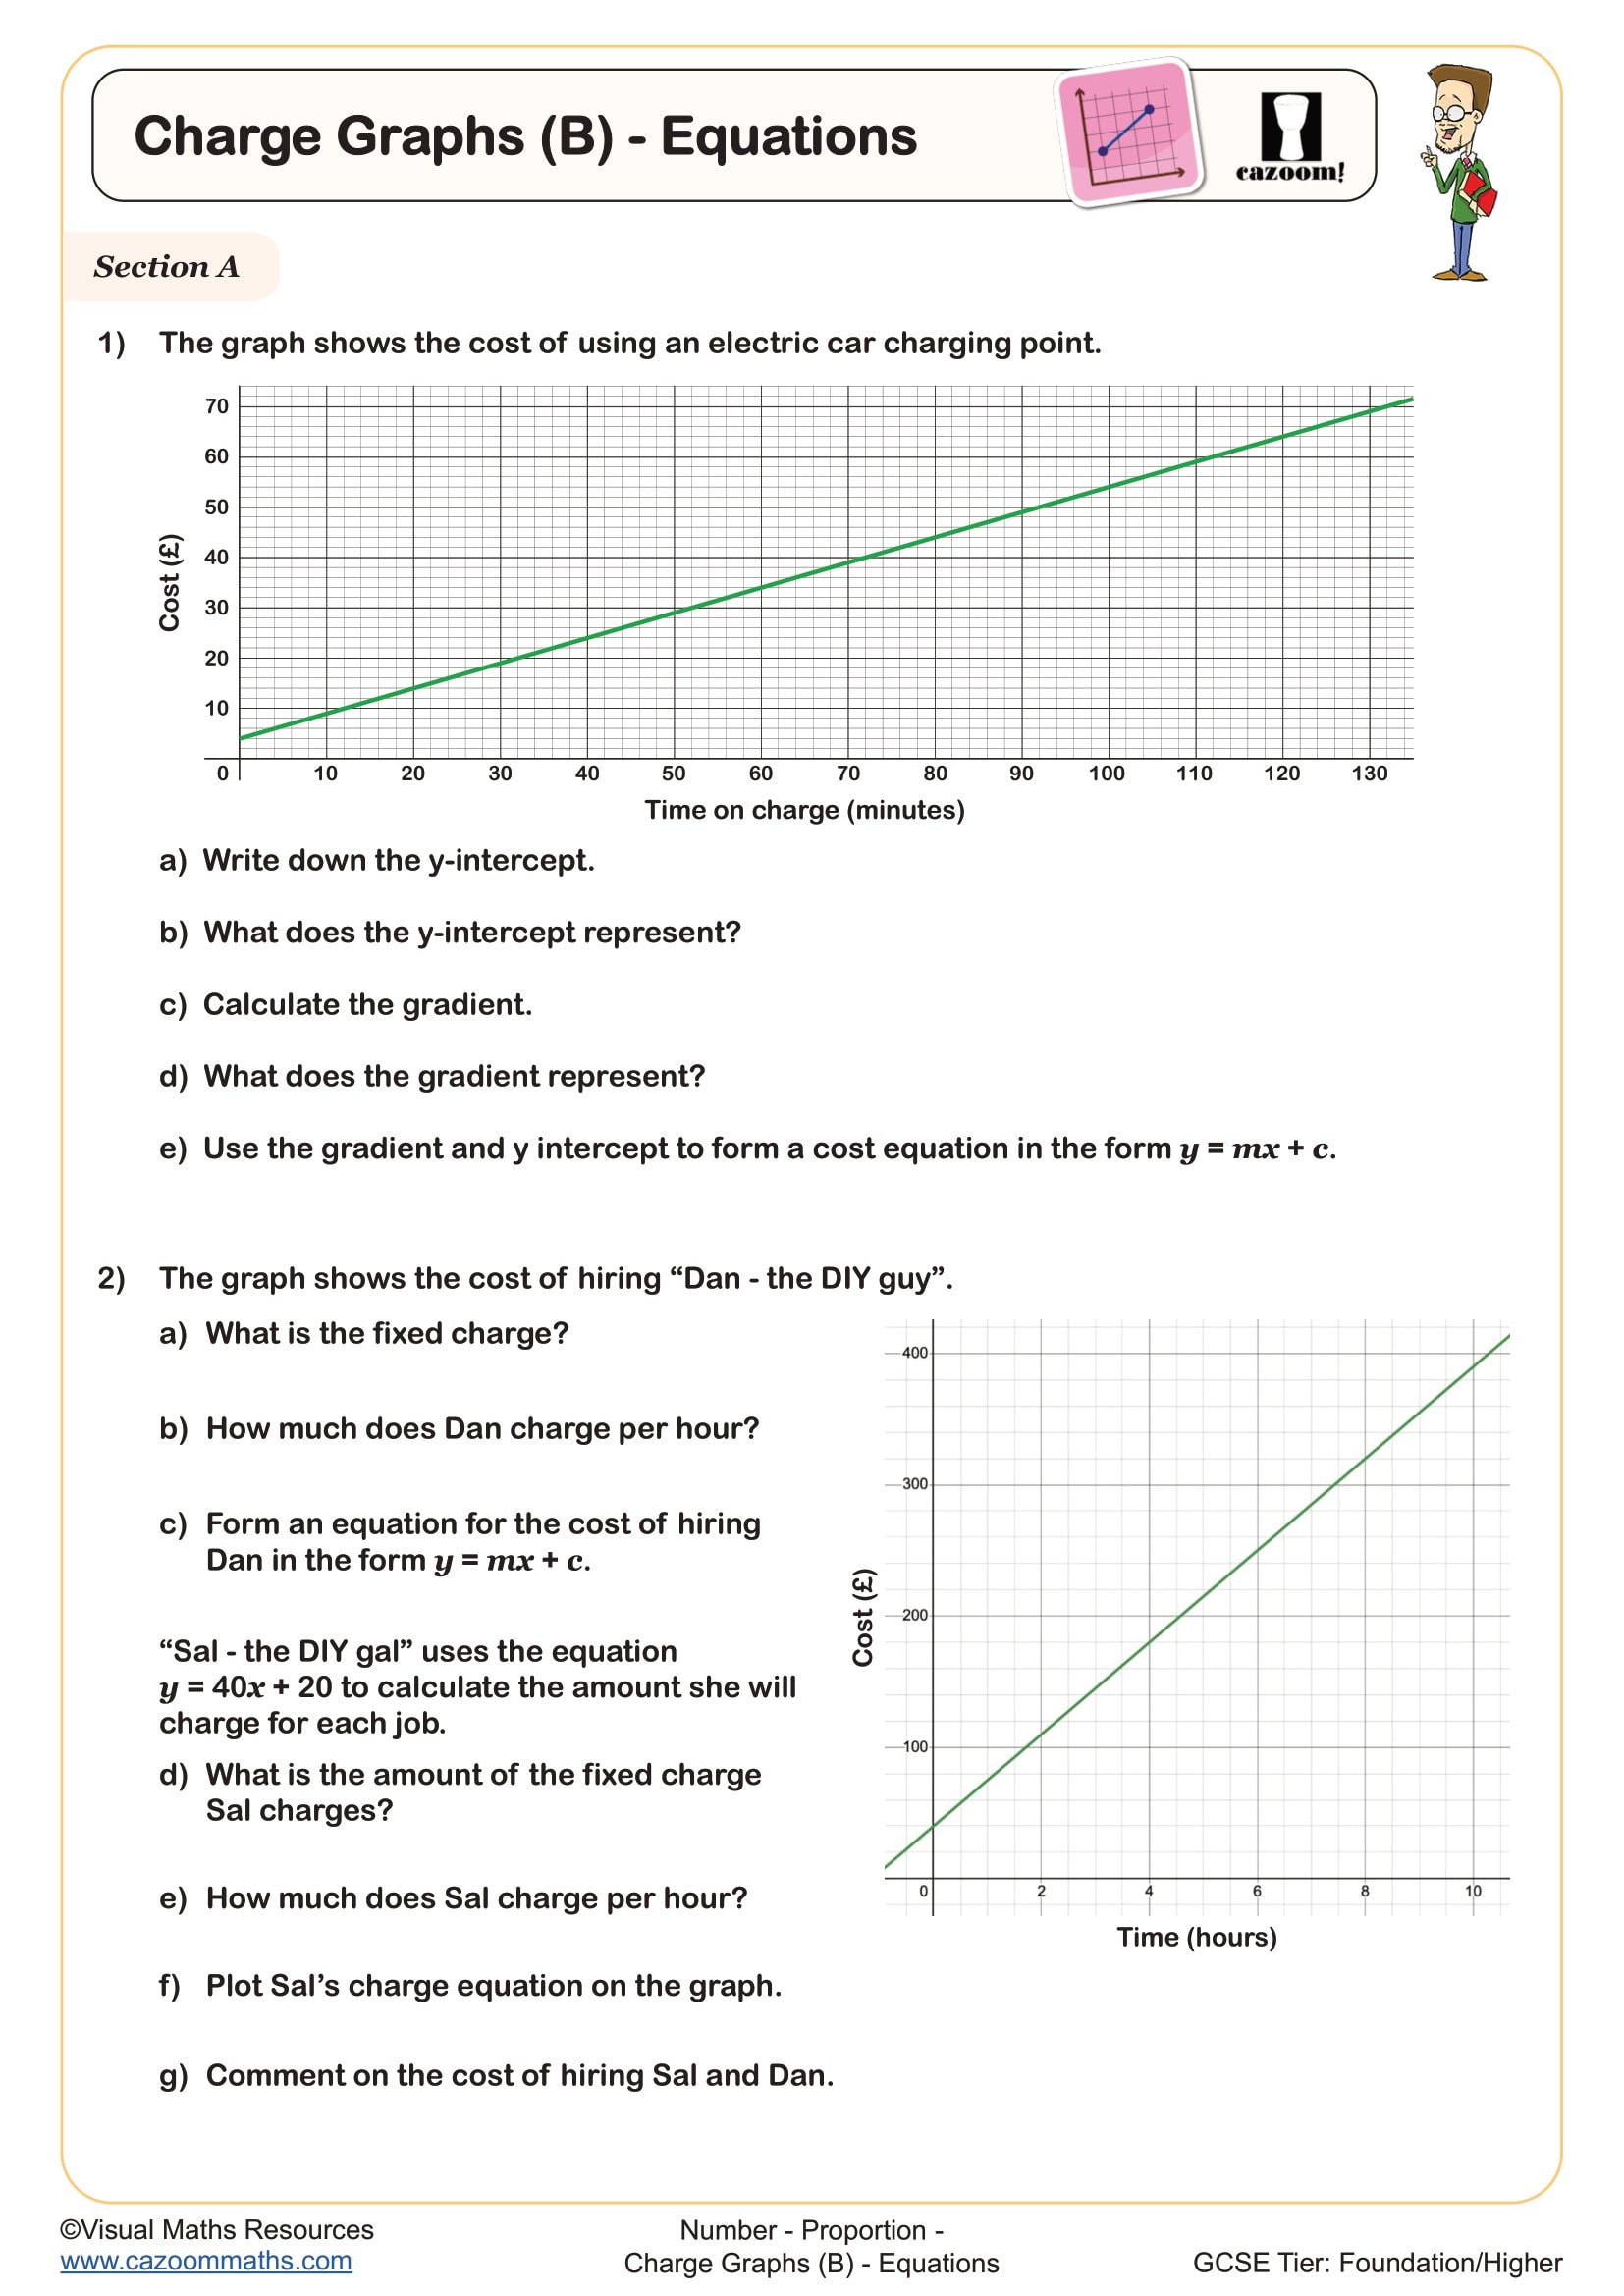
The progression across these year groups involves increasing interpretive demands. Year 8 students might read values directly from a graph showing mobile phone costs, whilst Year 9 students analyse where two different tariffs become equally expensive or explain what a steeper gradient means for the rate of change. This builds towards GCSE questions that combine graph interpretation with multi-step problem solving and require students to justify their reasoning using contextual vocabulary.
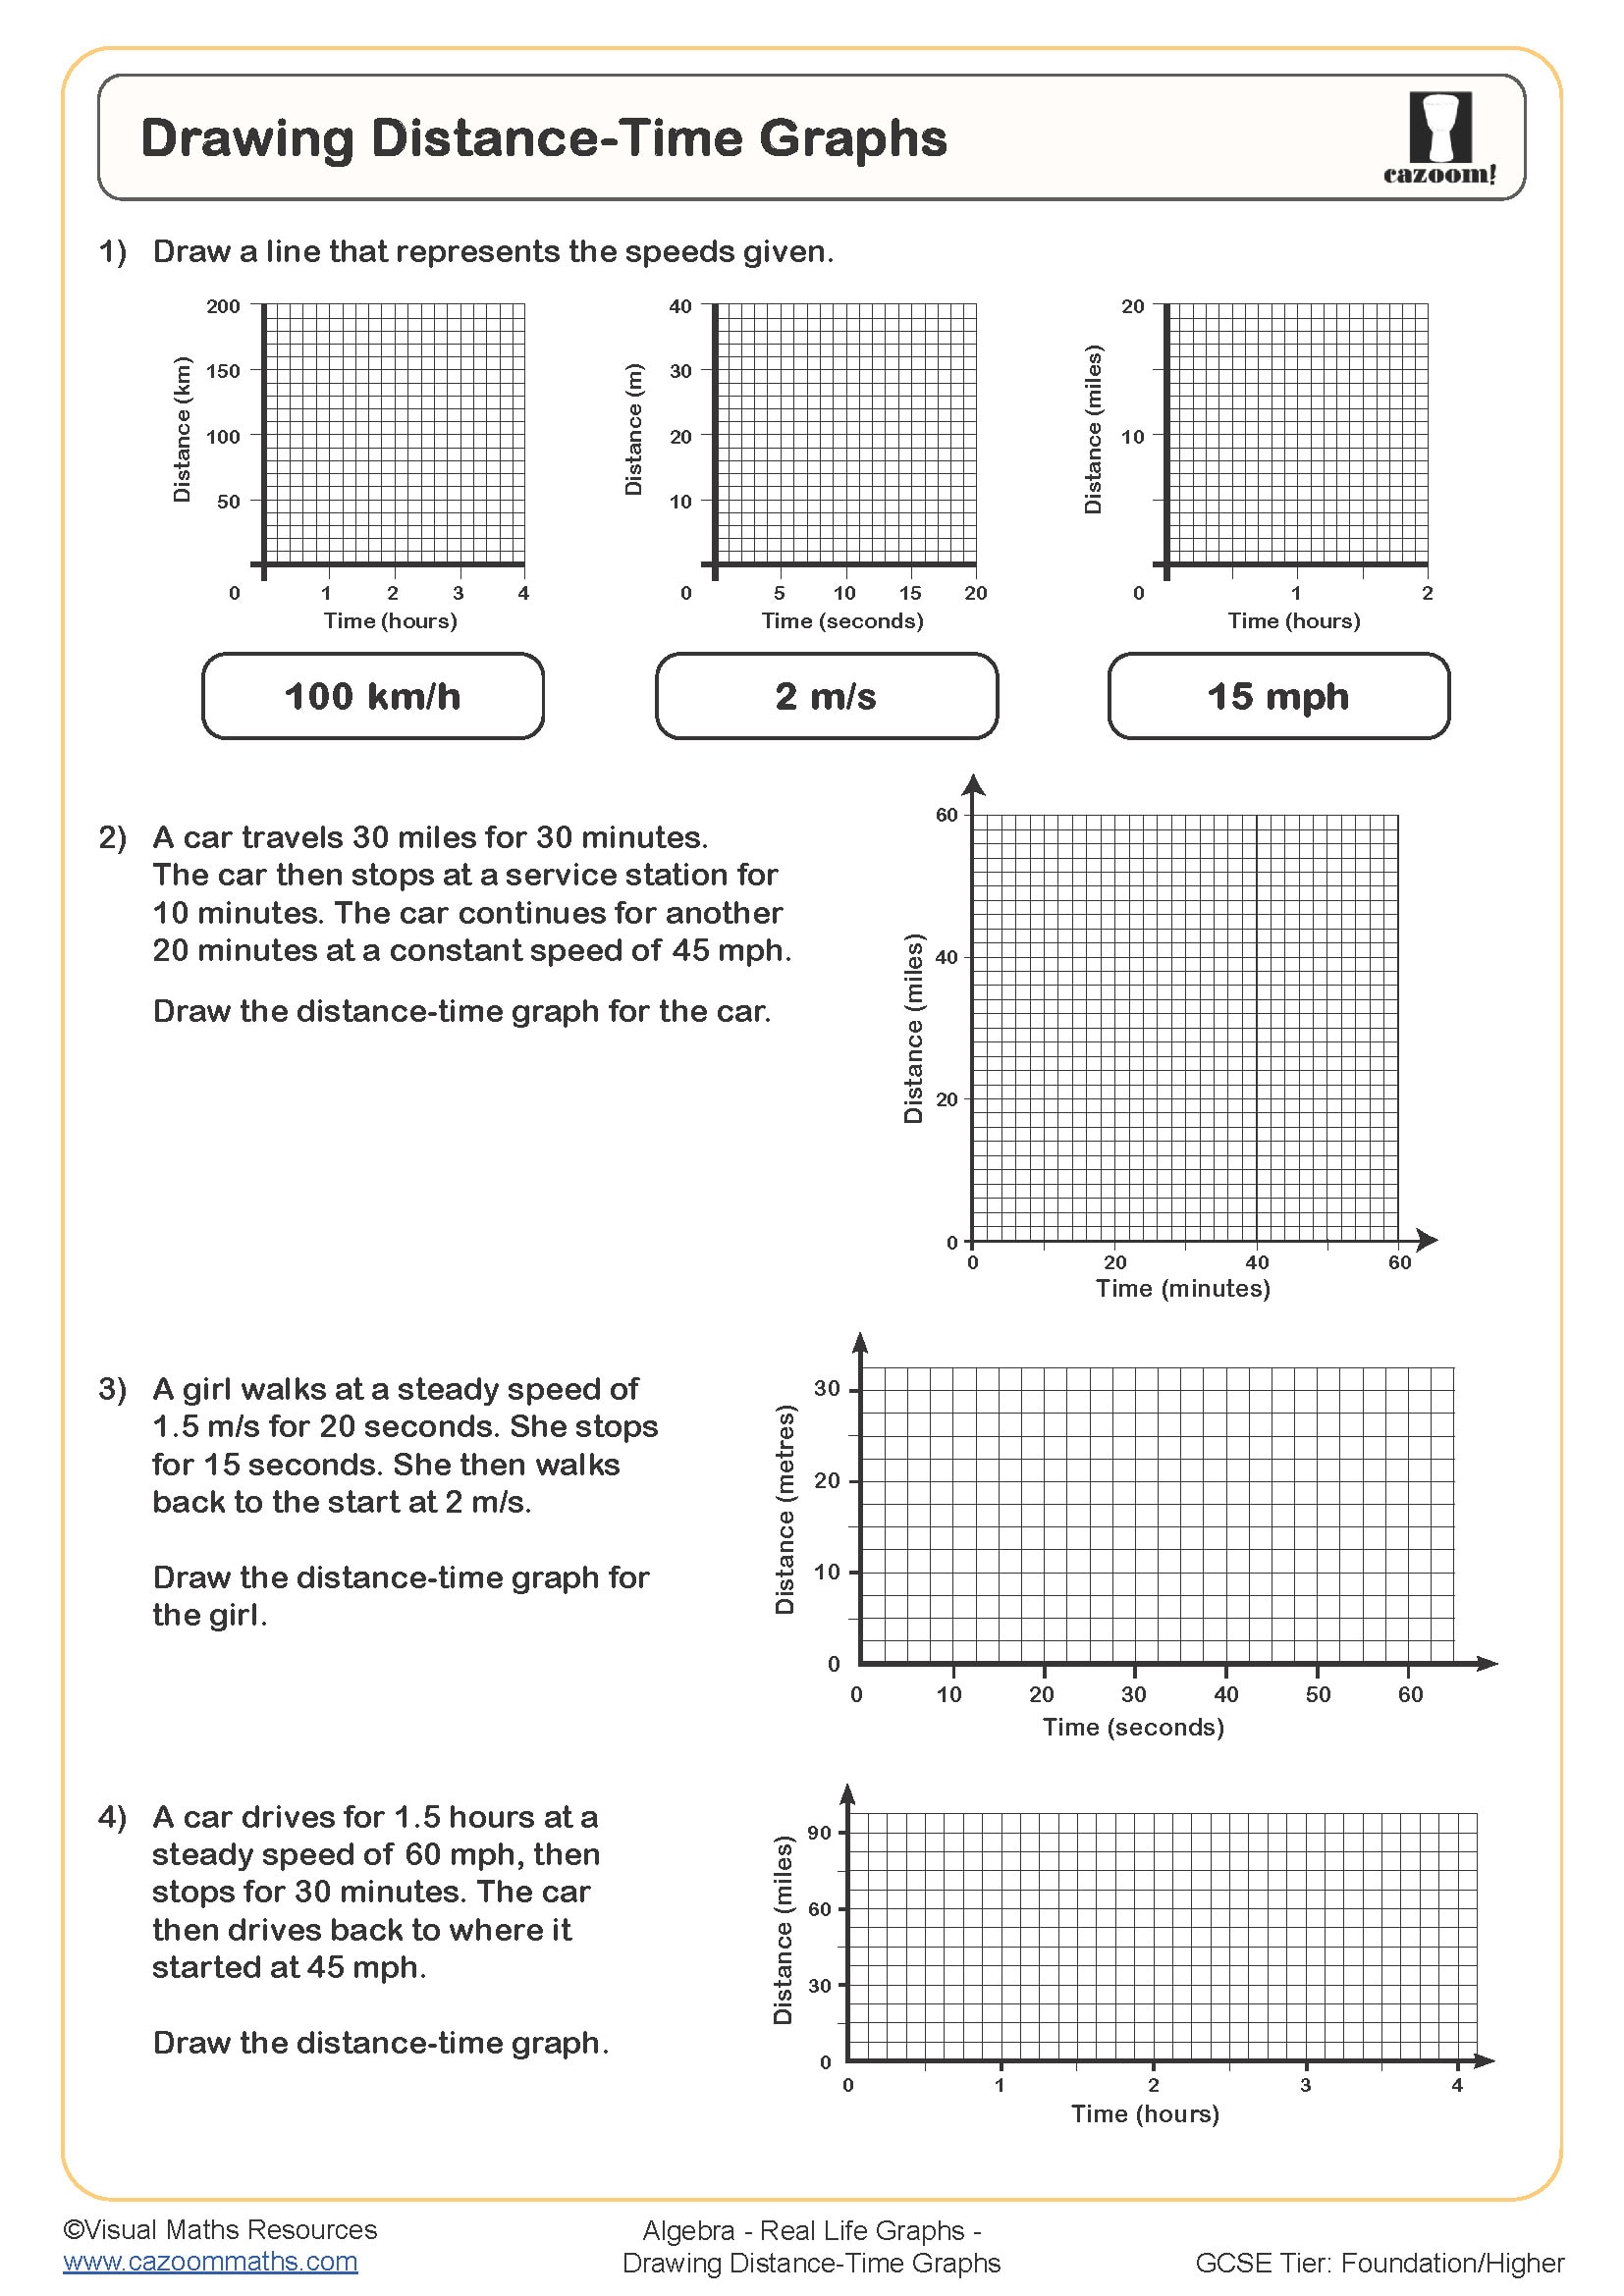
How Do You Read Distance-Time Graphs?
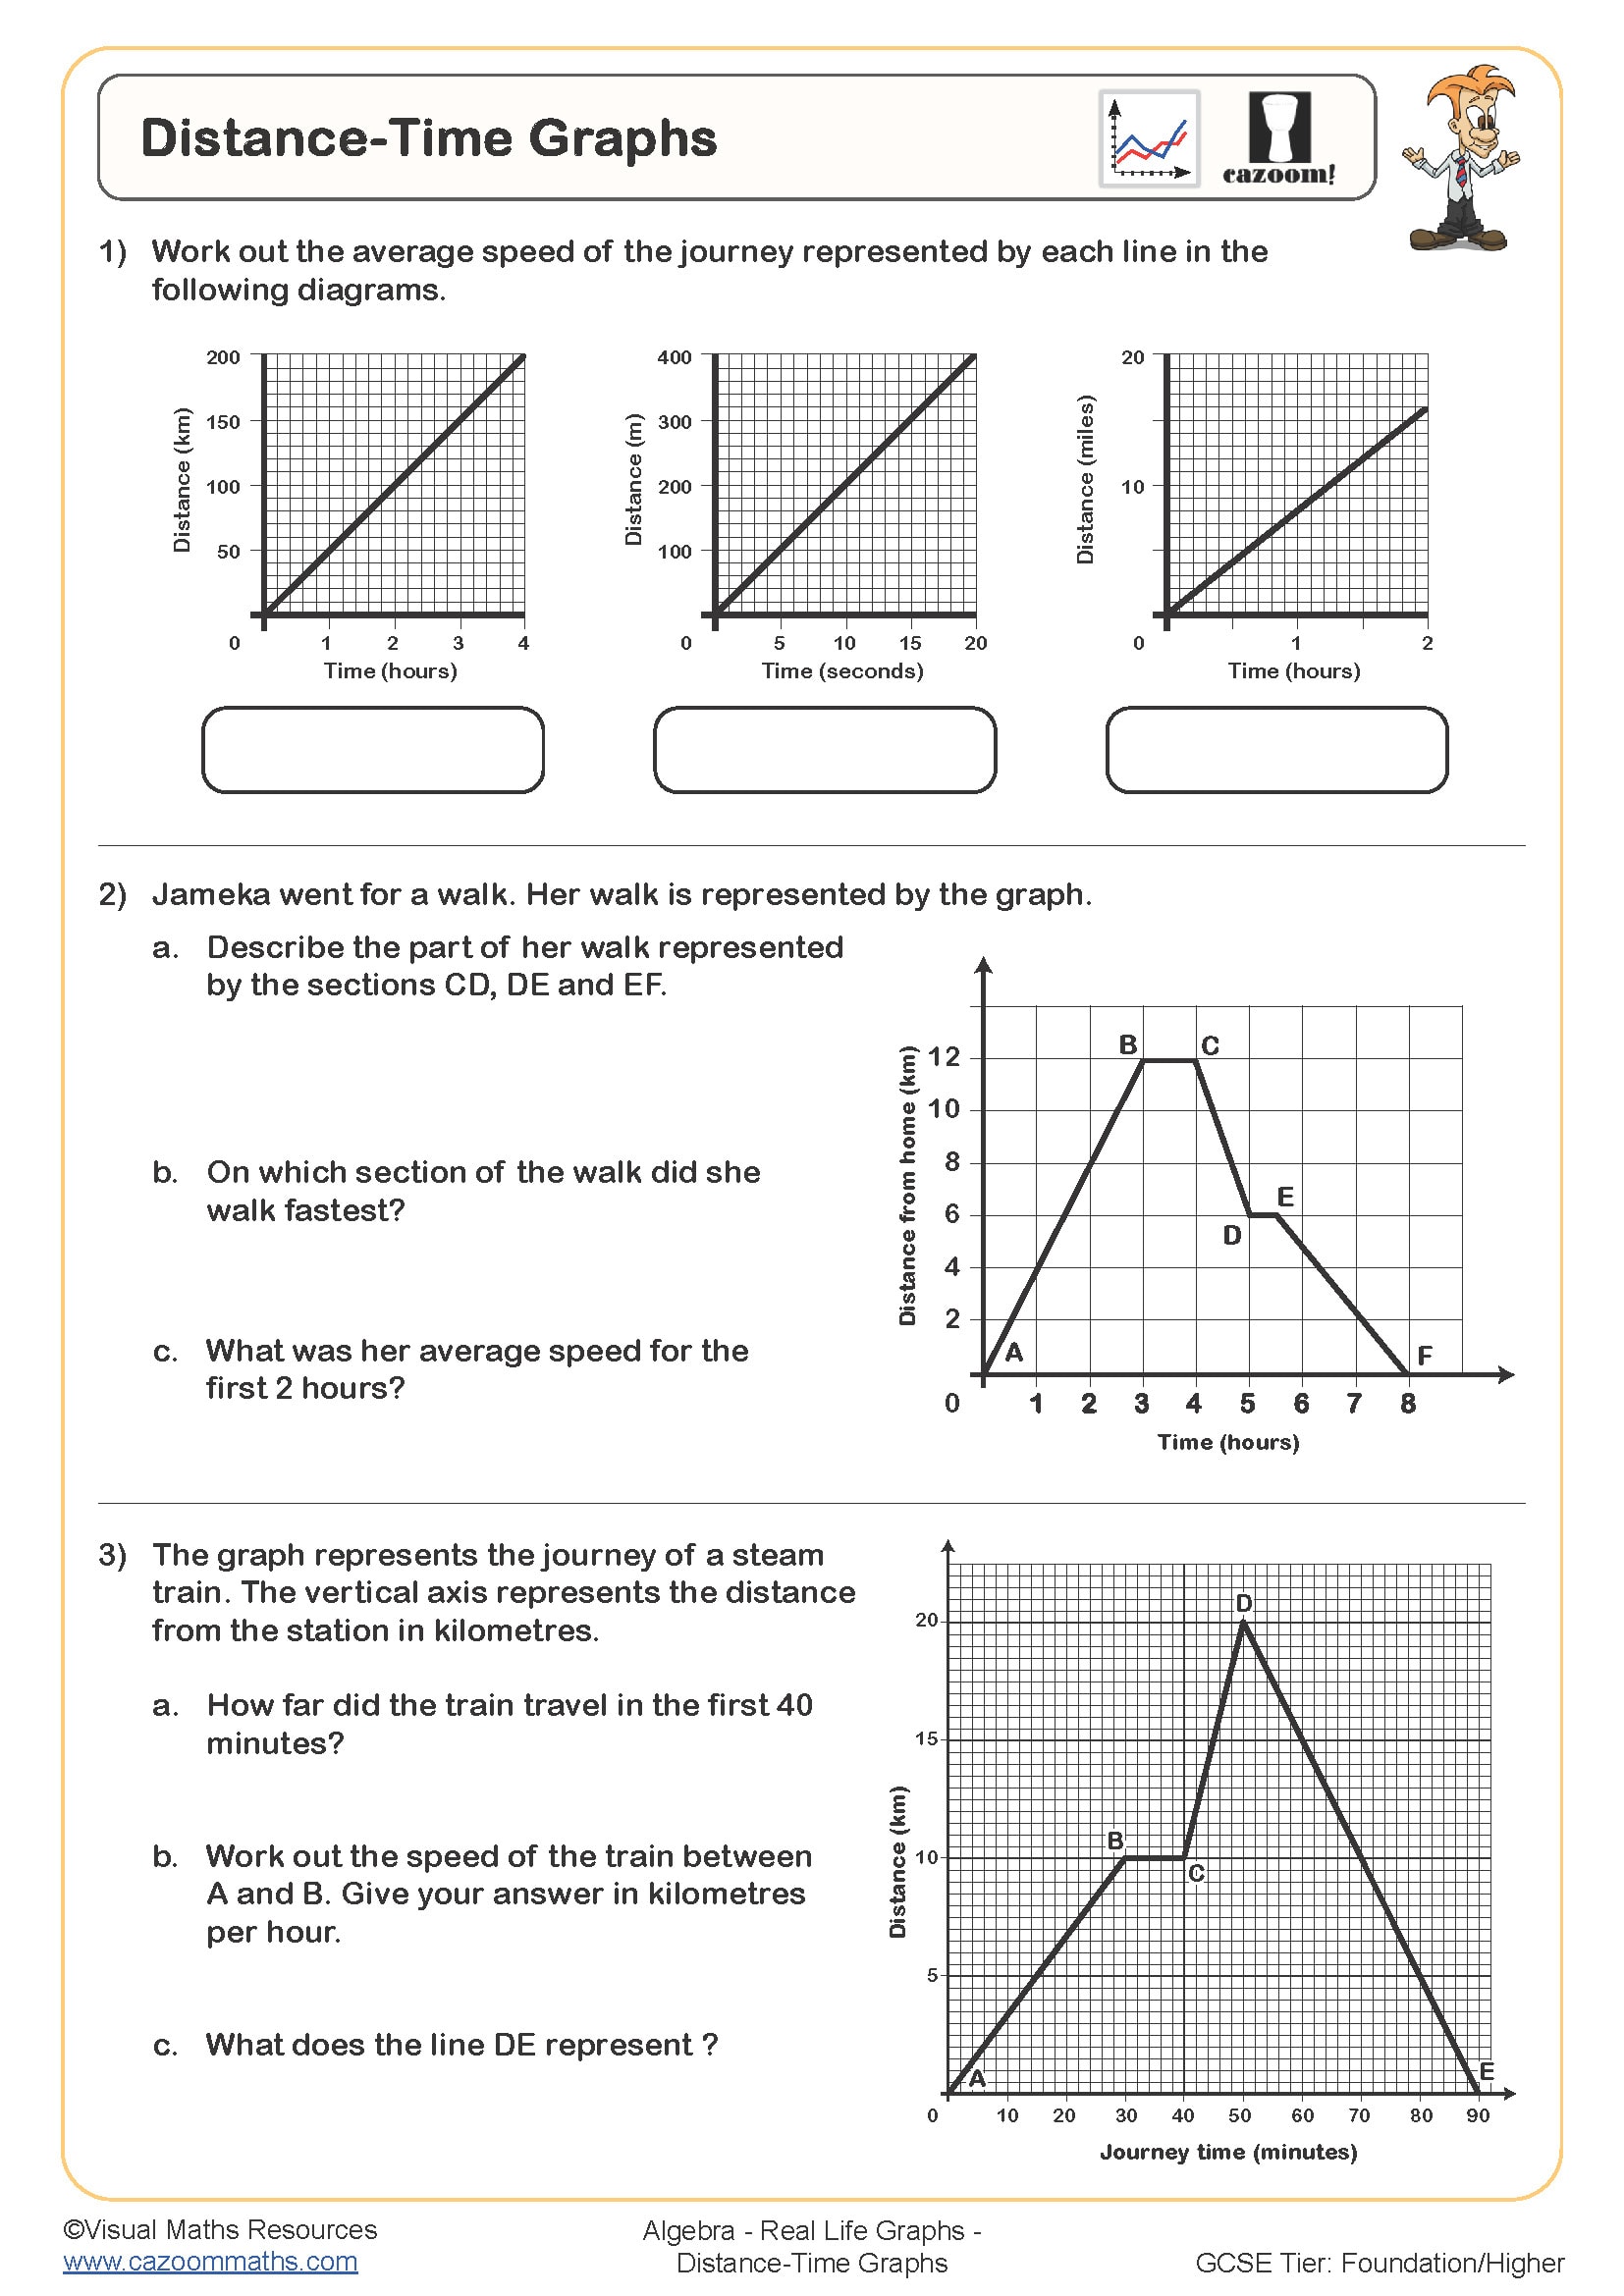
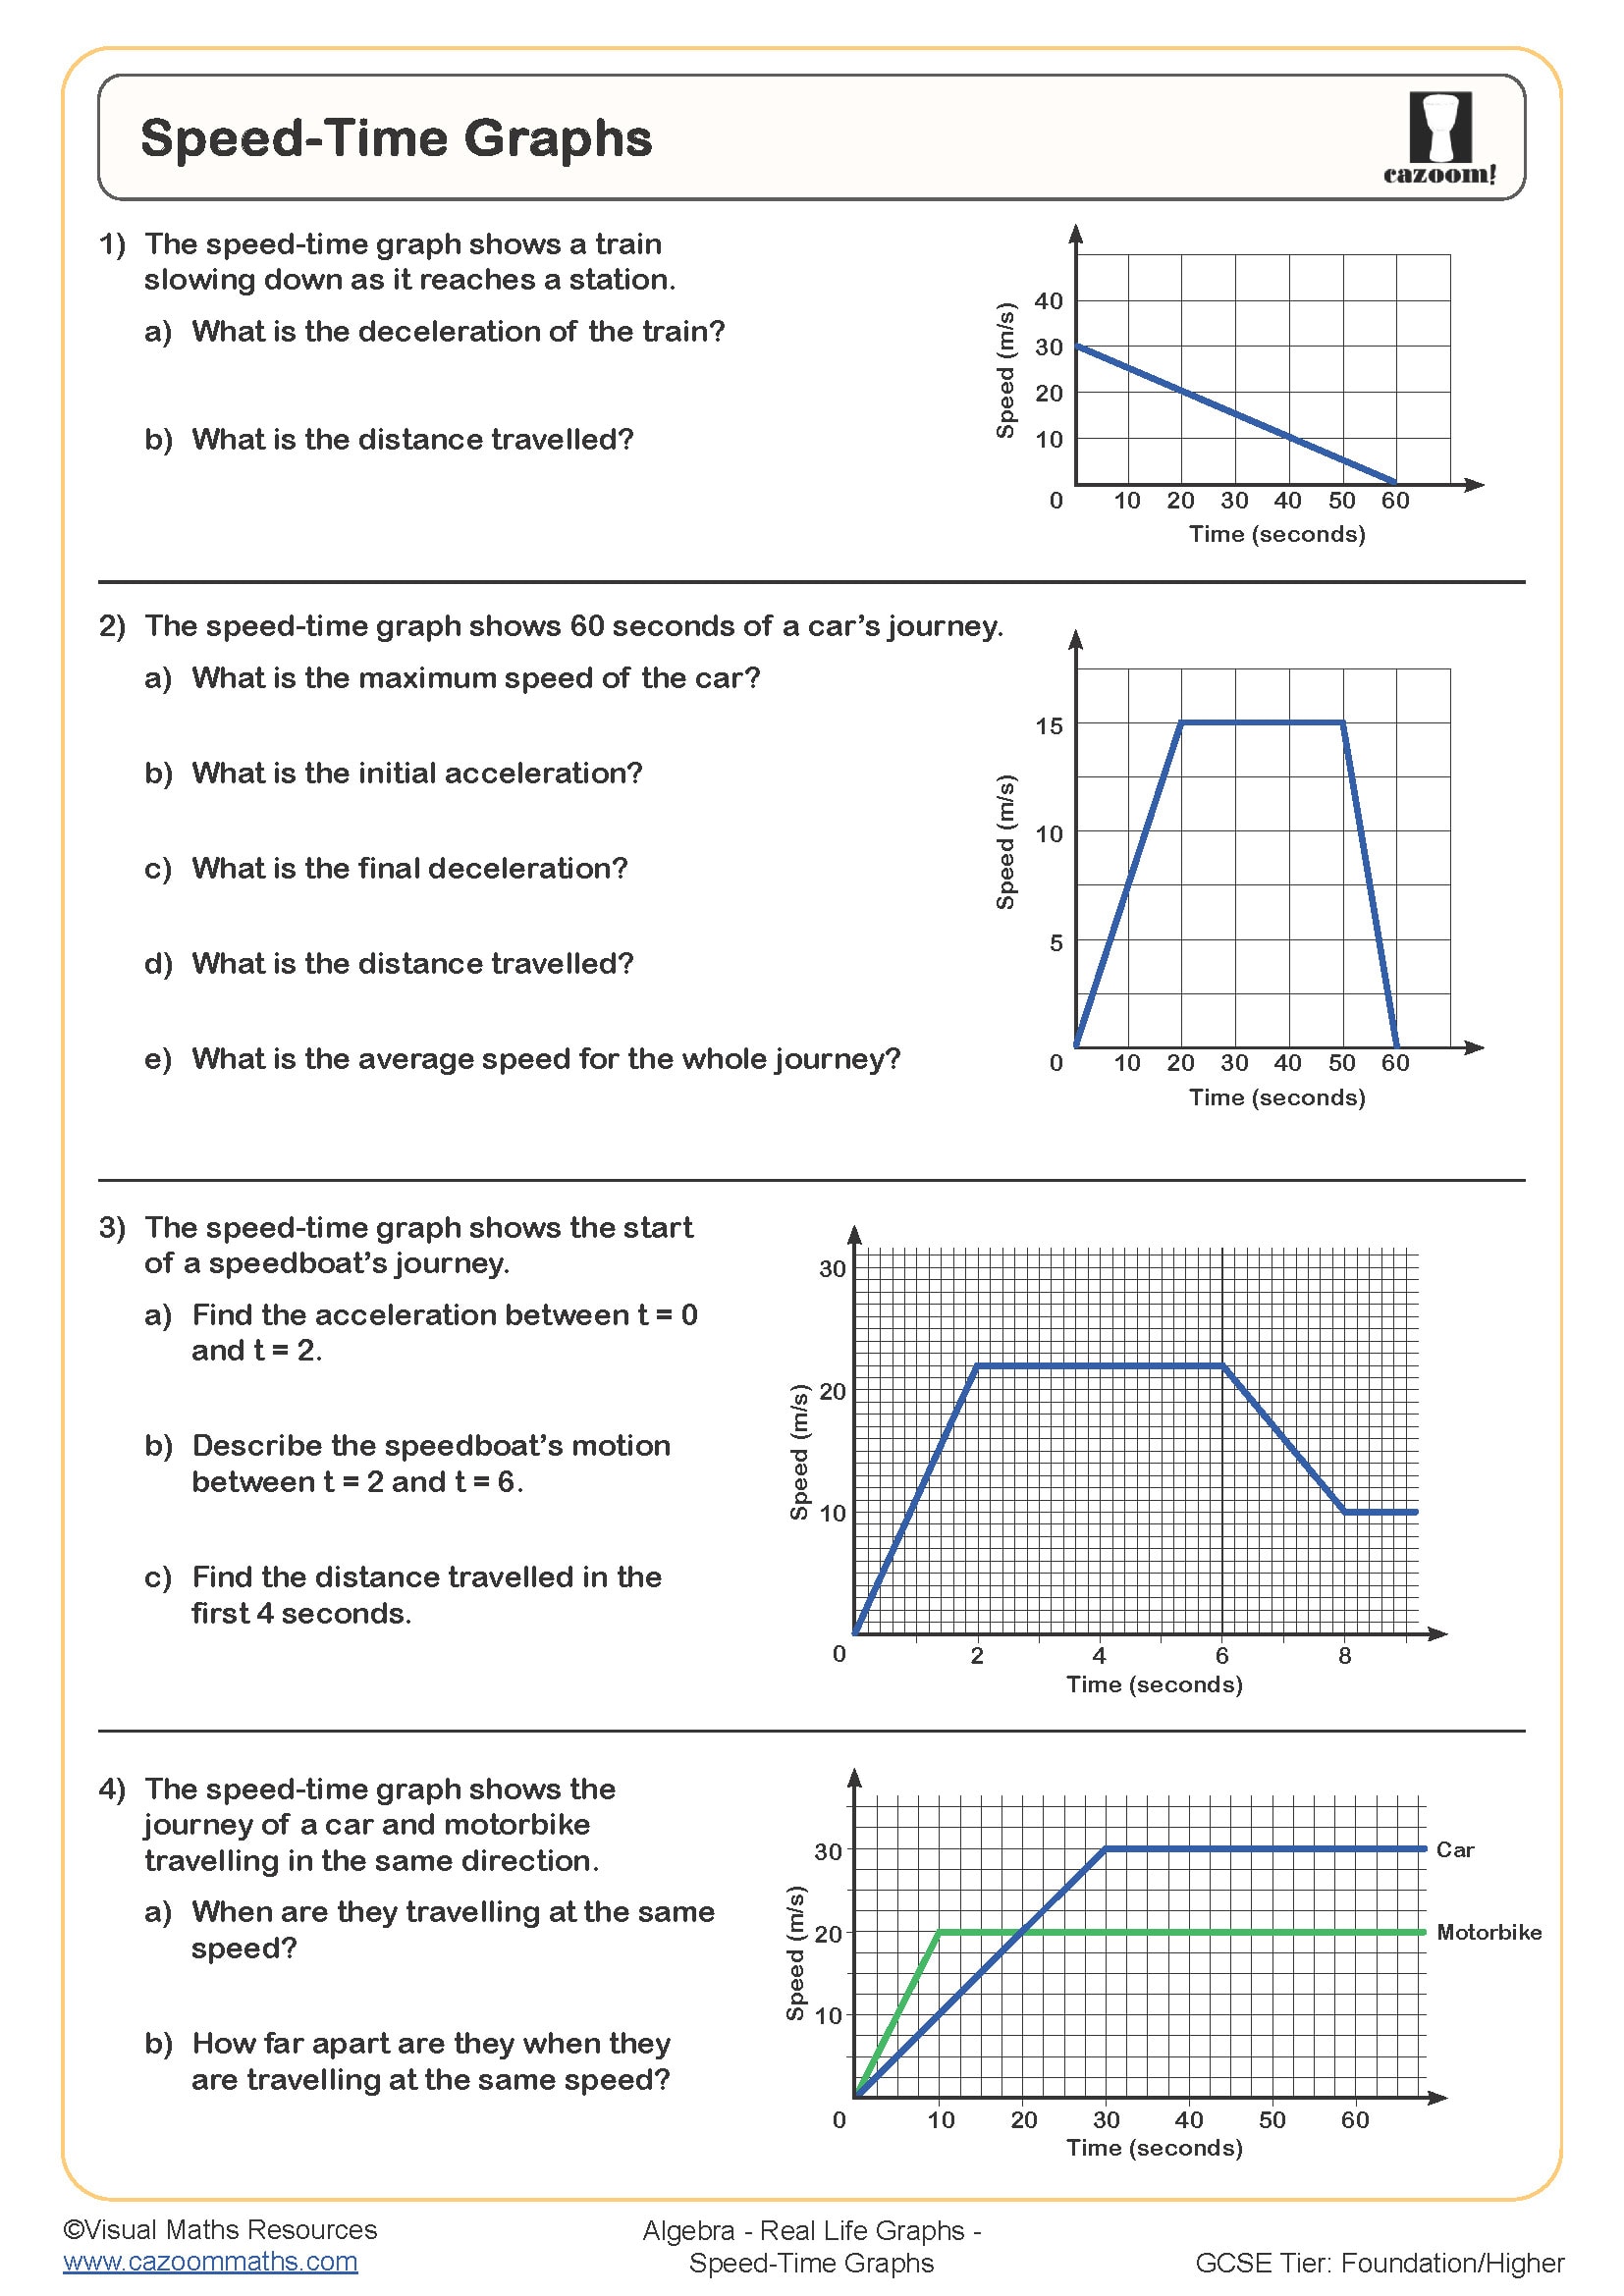
Distance-time graphs show how far an object has travelled over a period, with time on the horizontal axis and distance on the vertical. The gradient represents speed—steeper sections indicate faster movement, whilst horizontal sections show the object has stopped. Students read coordinates to find distance at specific times and calculate speed by finding the gradient (change in distance divided by change in time). Curved sections indicate acceleration or deceleration.
These graphs connect directly to transport planning and logistics. Delivery companies use distance-time analysis to optimise routes and predict arrival times, whilst traffic engineers model journey patterns to design road systems. GPS navigation systems constantly plot distance-time relationships to recalculate routes based on current speed and traffic conditions, making this skill relevant across engineering, urban planning, and data science careers where interpreting motion data drives decision-making.
How Do These Worksheets Support Learning?
The worksheets provide structured practice that moves students from reading individual values to analysing entire graph stories. Questions typically scaffold from identifying specific points through to comparing rates of change and explaining what graph features mean within the given context. Complete answer sheets allow students to check not just numerical answers but also verify their interpretations, helping them develop the reasoning skills that exam mark schemes reward.
Teachers often use these resources during intervention sessions when students struggle with functional maths elements, as they isolate graph interpretation without additional algebraic complexity. They work well for homework following initial teaching or as retrieval practice before assessments. Paired work proves effective—one student reads the question context whilst the other traces the graph journey, encouraging them to verbalise the connection between mathematical features and real-world meaning.