KS4 Real Life Graphs Worksheets
All worksheets are created by the team of experienced teachers at Cazoom Maths.
What Are Real Life Graphs in GCSE Maths?
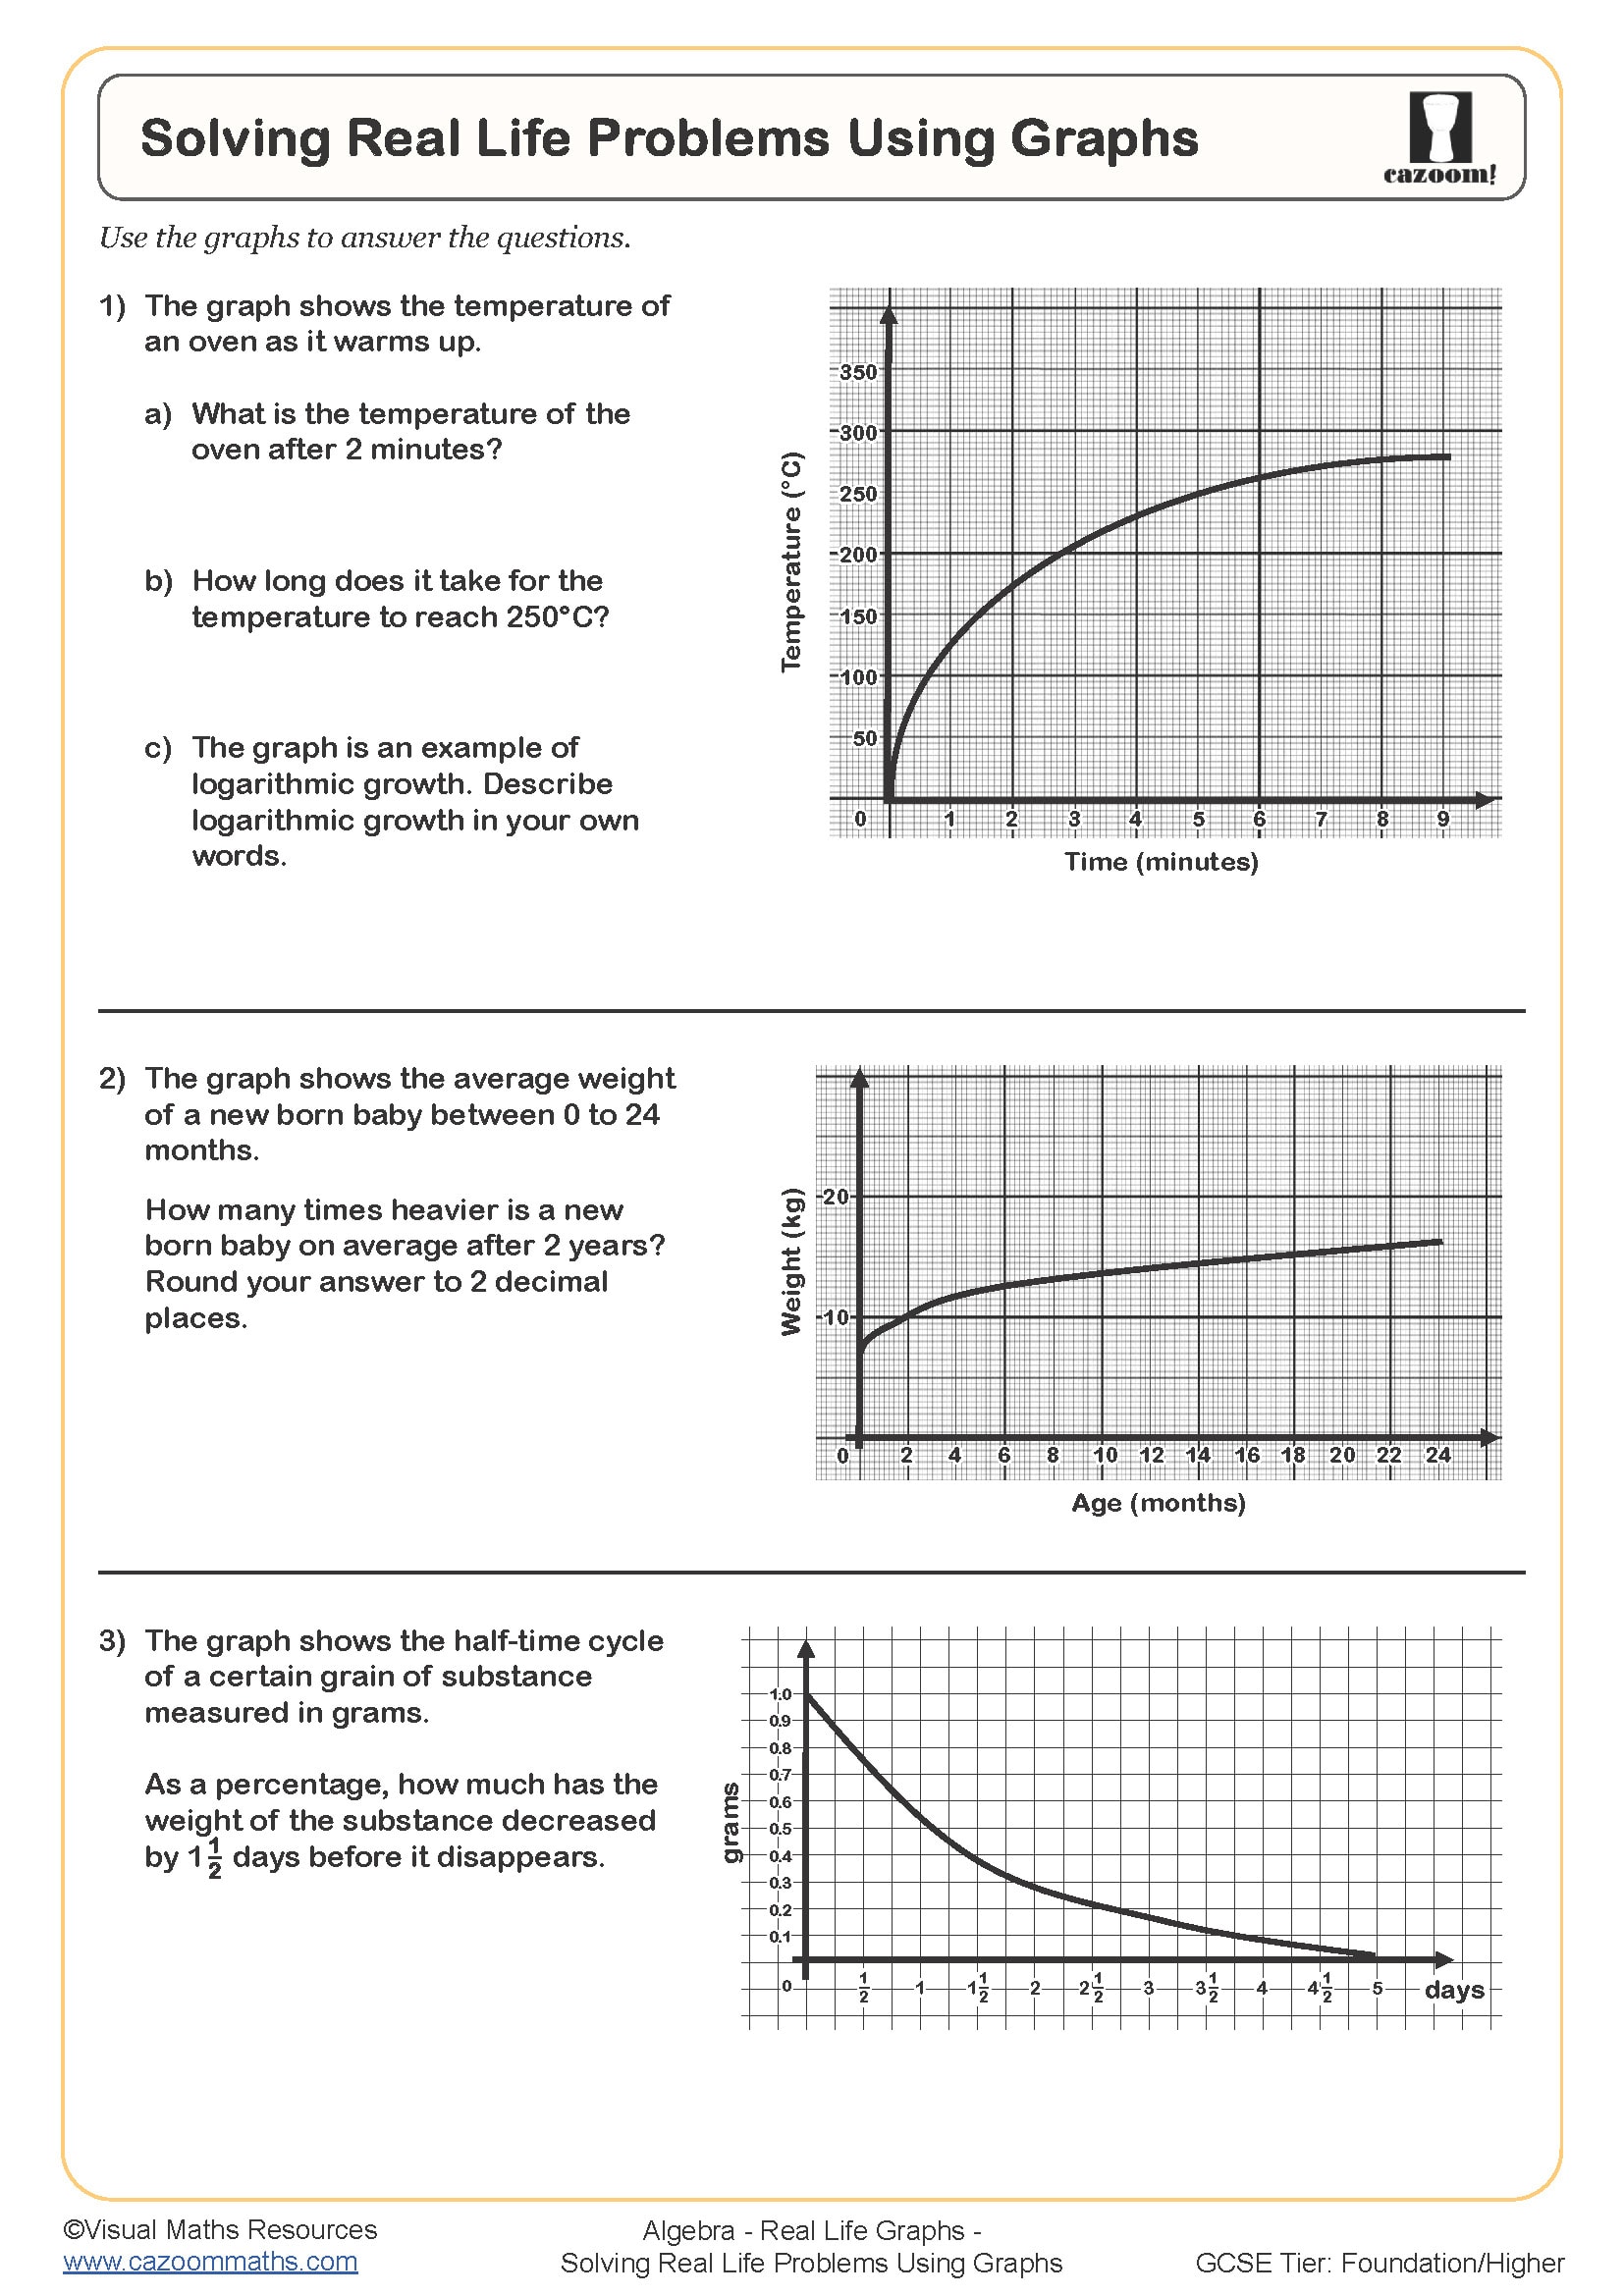
Real life graphs are graphical representations that model practical situations such as journeys, conversions, filling containers, and financial scenarios. In the GCSE maths curriculum, students analyse and interpret features like gradients (rates of change), intercepts (starting values), and horizontal sections (periods of no change), then connect these to the context described. This appears across Foundation and Higher tiers, with Higher tier students expected to handle more complex scenarios involving composite functions and reciprocal relationships.
A common error occurs when students calculate a gradient correctly but fail to interpret it—for example, finding a gradient of 15 on a distance-time graph but not stating that this represents 15 metres per second. Exam mark schemes consistently penalise answers that lack contextual units or explanations, so students need practice translating between mathematical features and their real-world meanings.
Which Year Groups Study Real Life Graphs?
These worksheets target Year 10 and Year 11 students following the KS4 National Curriculum. Real life graphs typically appear in Year 10 as students consolidate earlier work on coordinates and linear graphs, extending this to practical contexts. The topic becomes more sophisticated in Year 11 as part of GCSE revision, where students encounter examination-style questions that combine multiple graph types and require detailed written explanations.
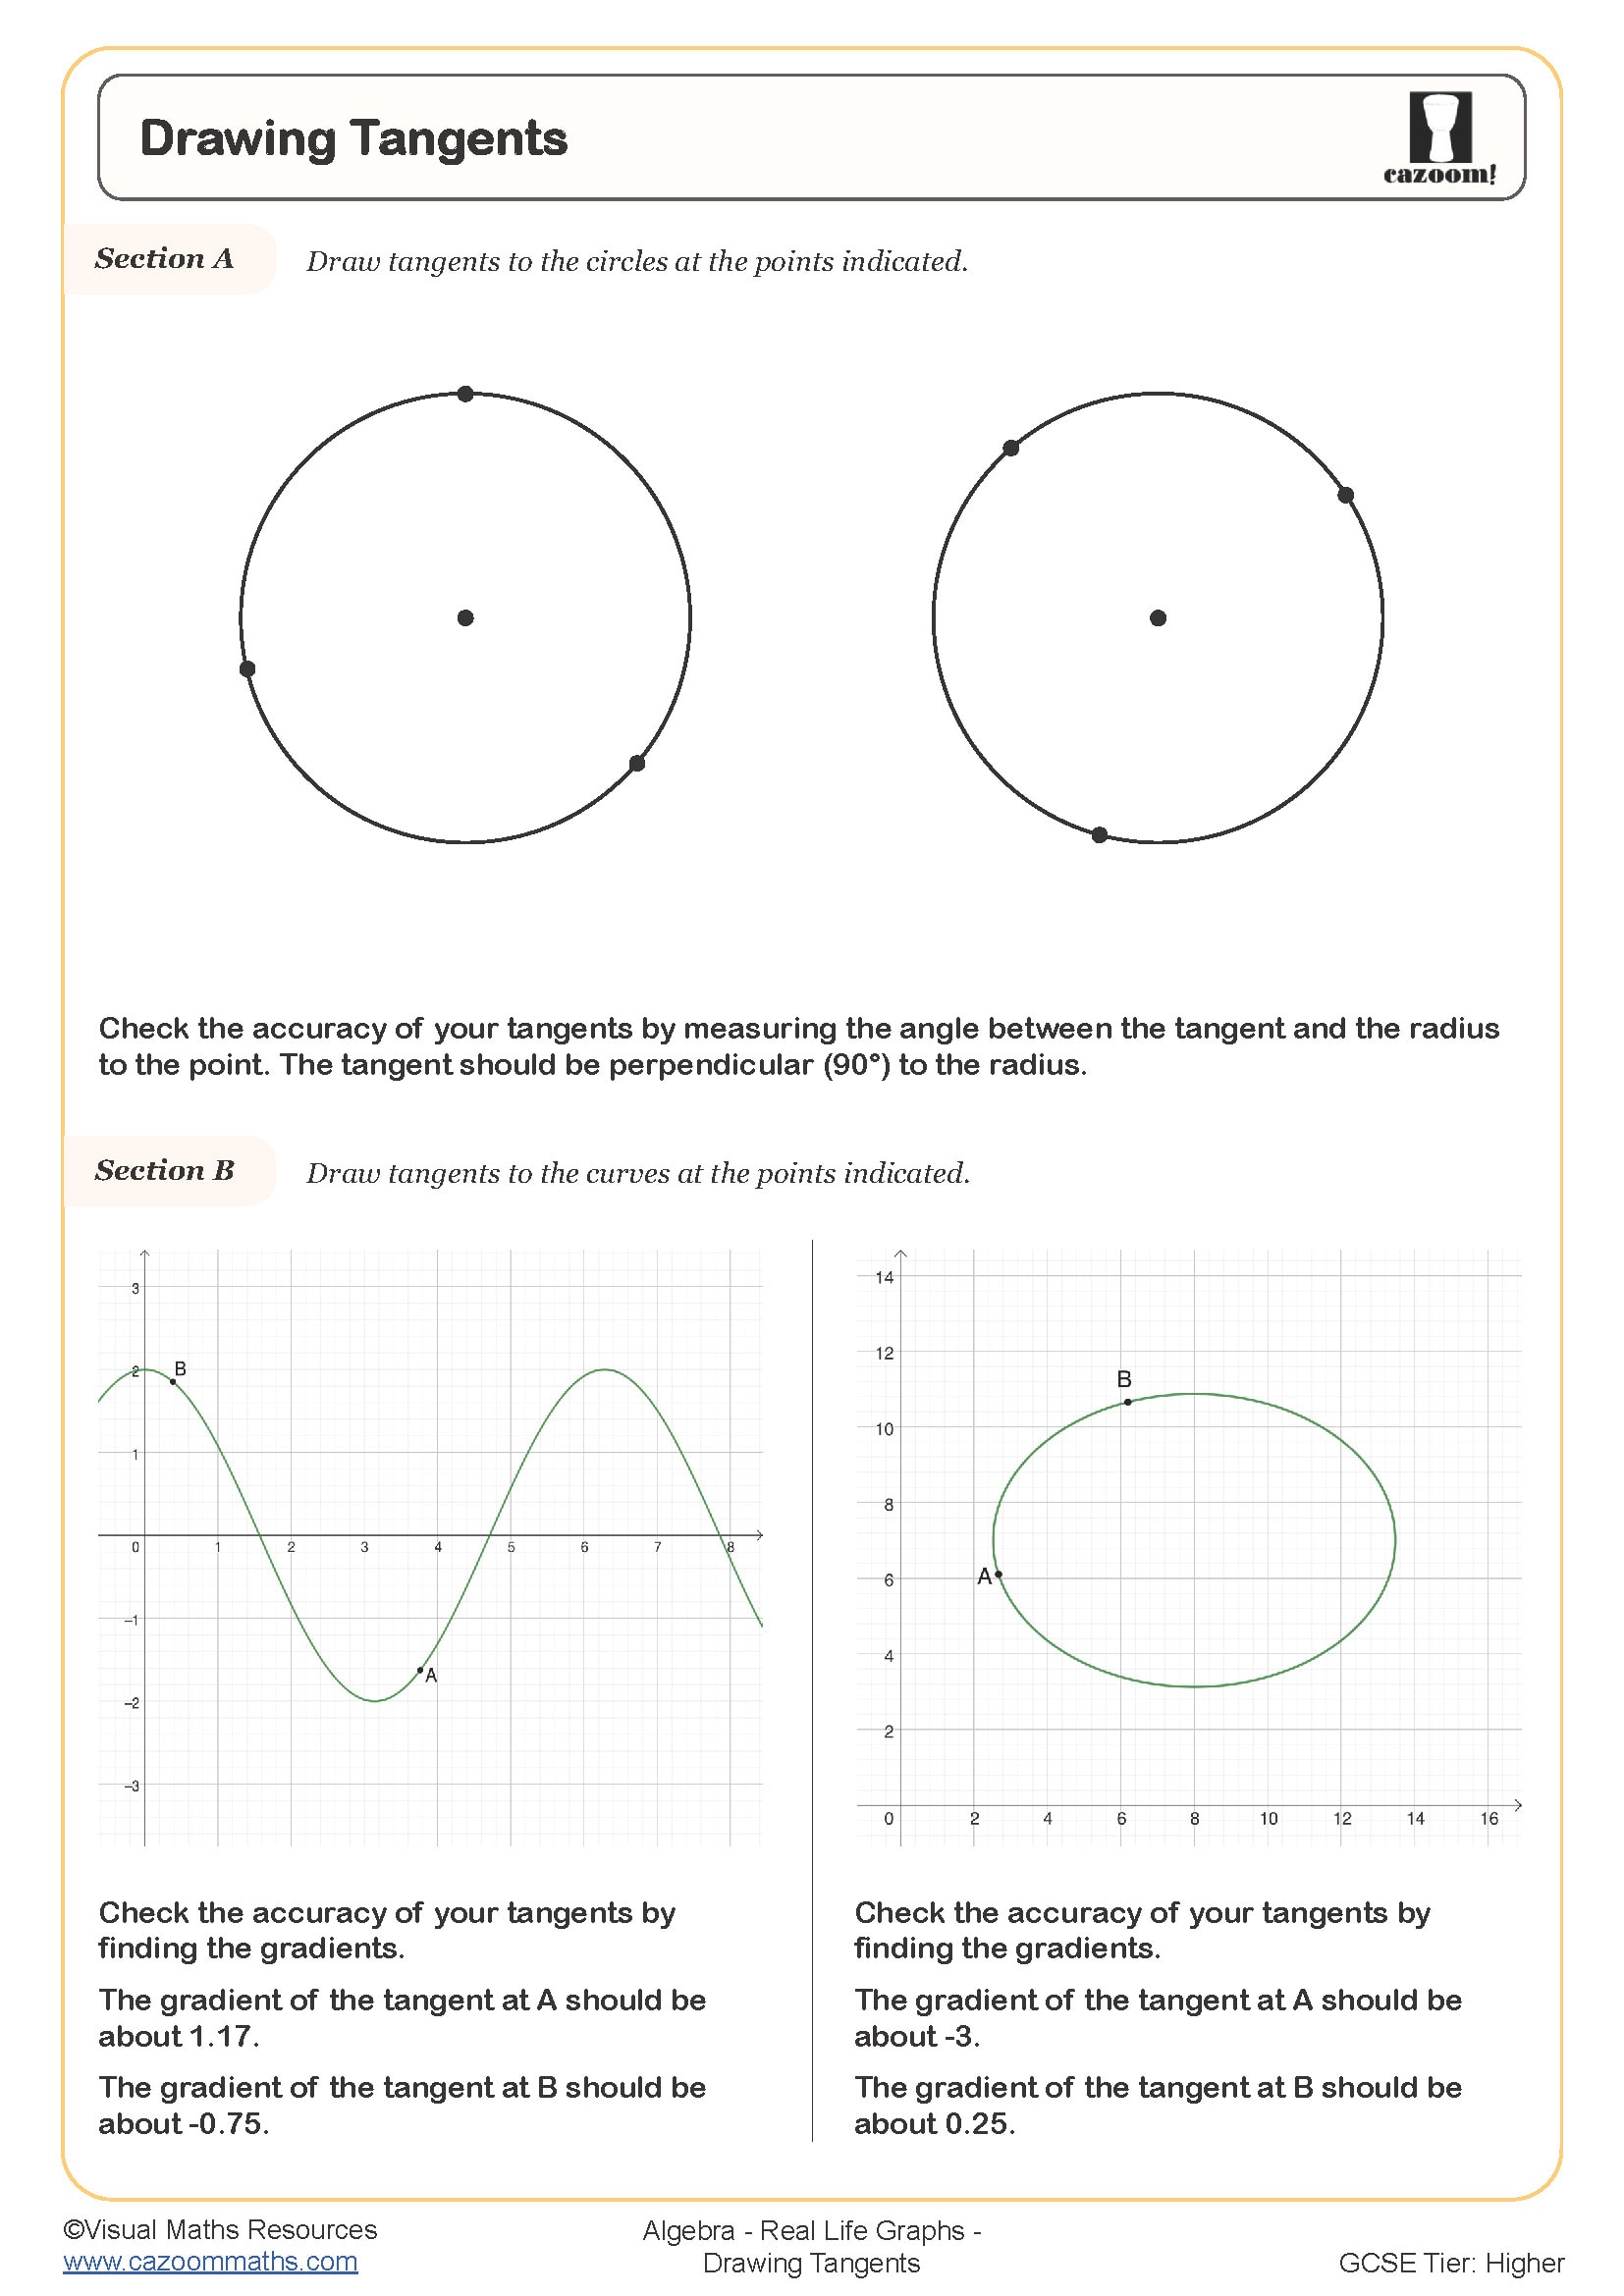
Progression within KS4 moves from straightforward distance-time and conversion graphs towards more challenging scenarios involving rates of change, such as velocity-time graphs or graphs showing water depth in irregular containers. Higher tier students also work with compound measures and may need to sketch graphs from descriptions, reverse-engineer scenarios from given graphs, or compare multiple journeys on the same axes—all skills that require secure understanding of how gradients and shapes relate to real situations.
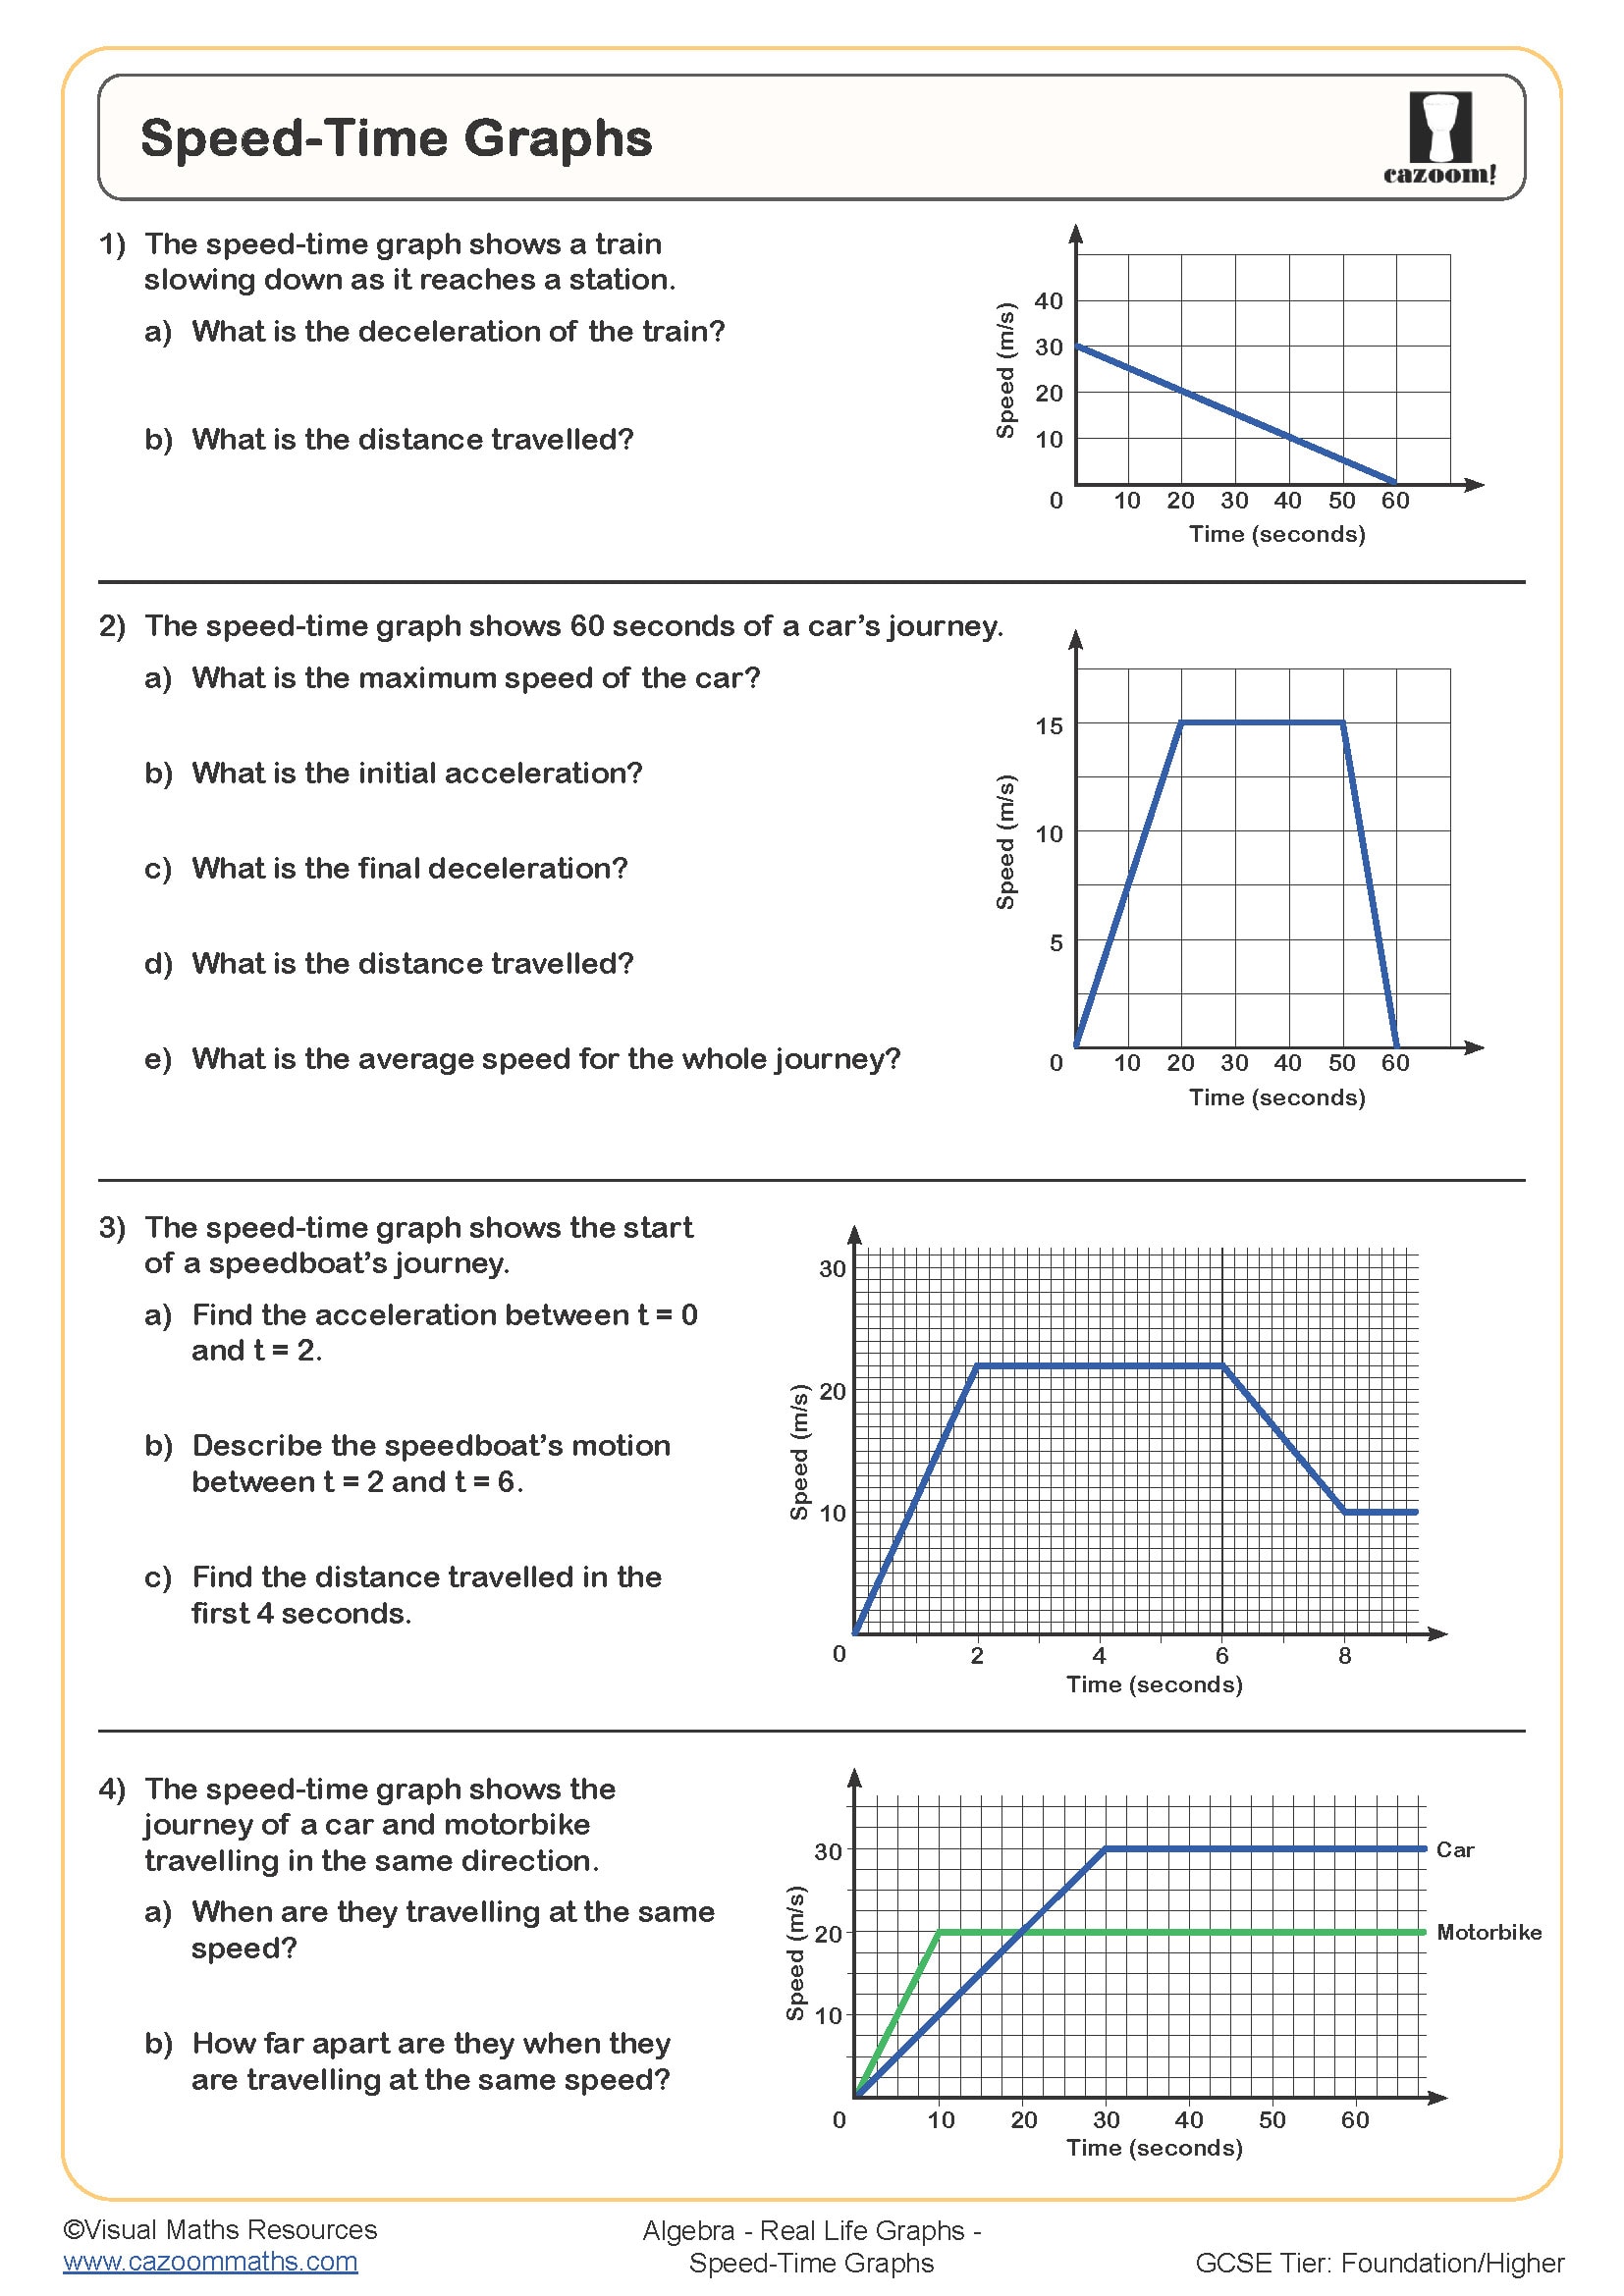
How Do Distance-Time Graphs Link to Real-World Contexts?
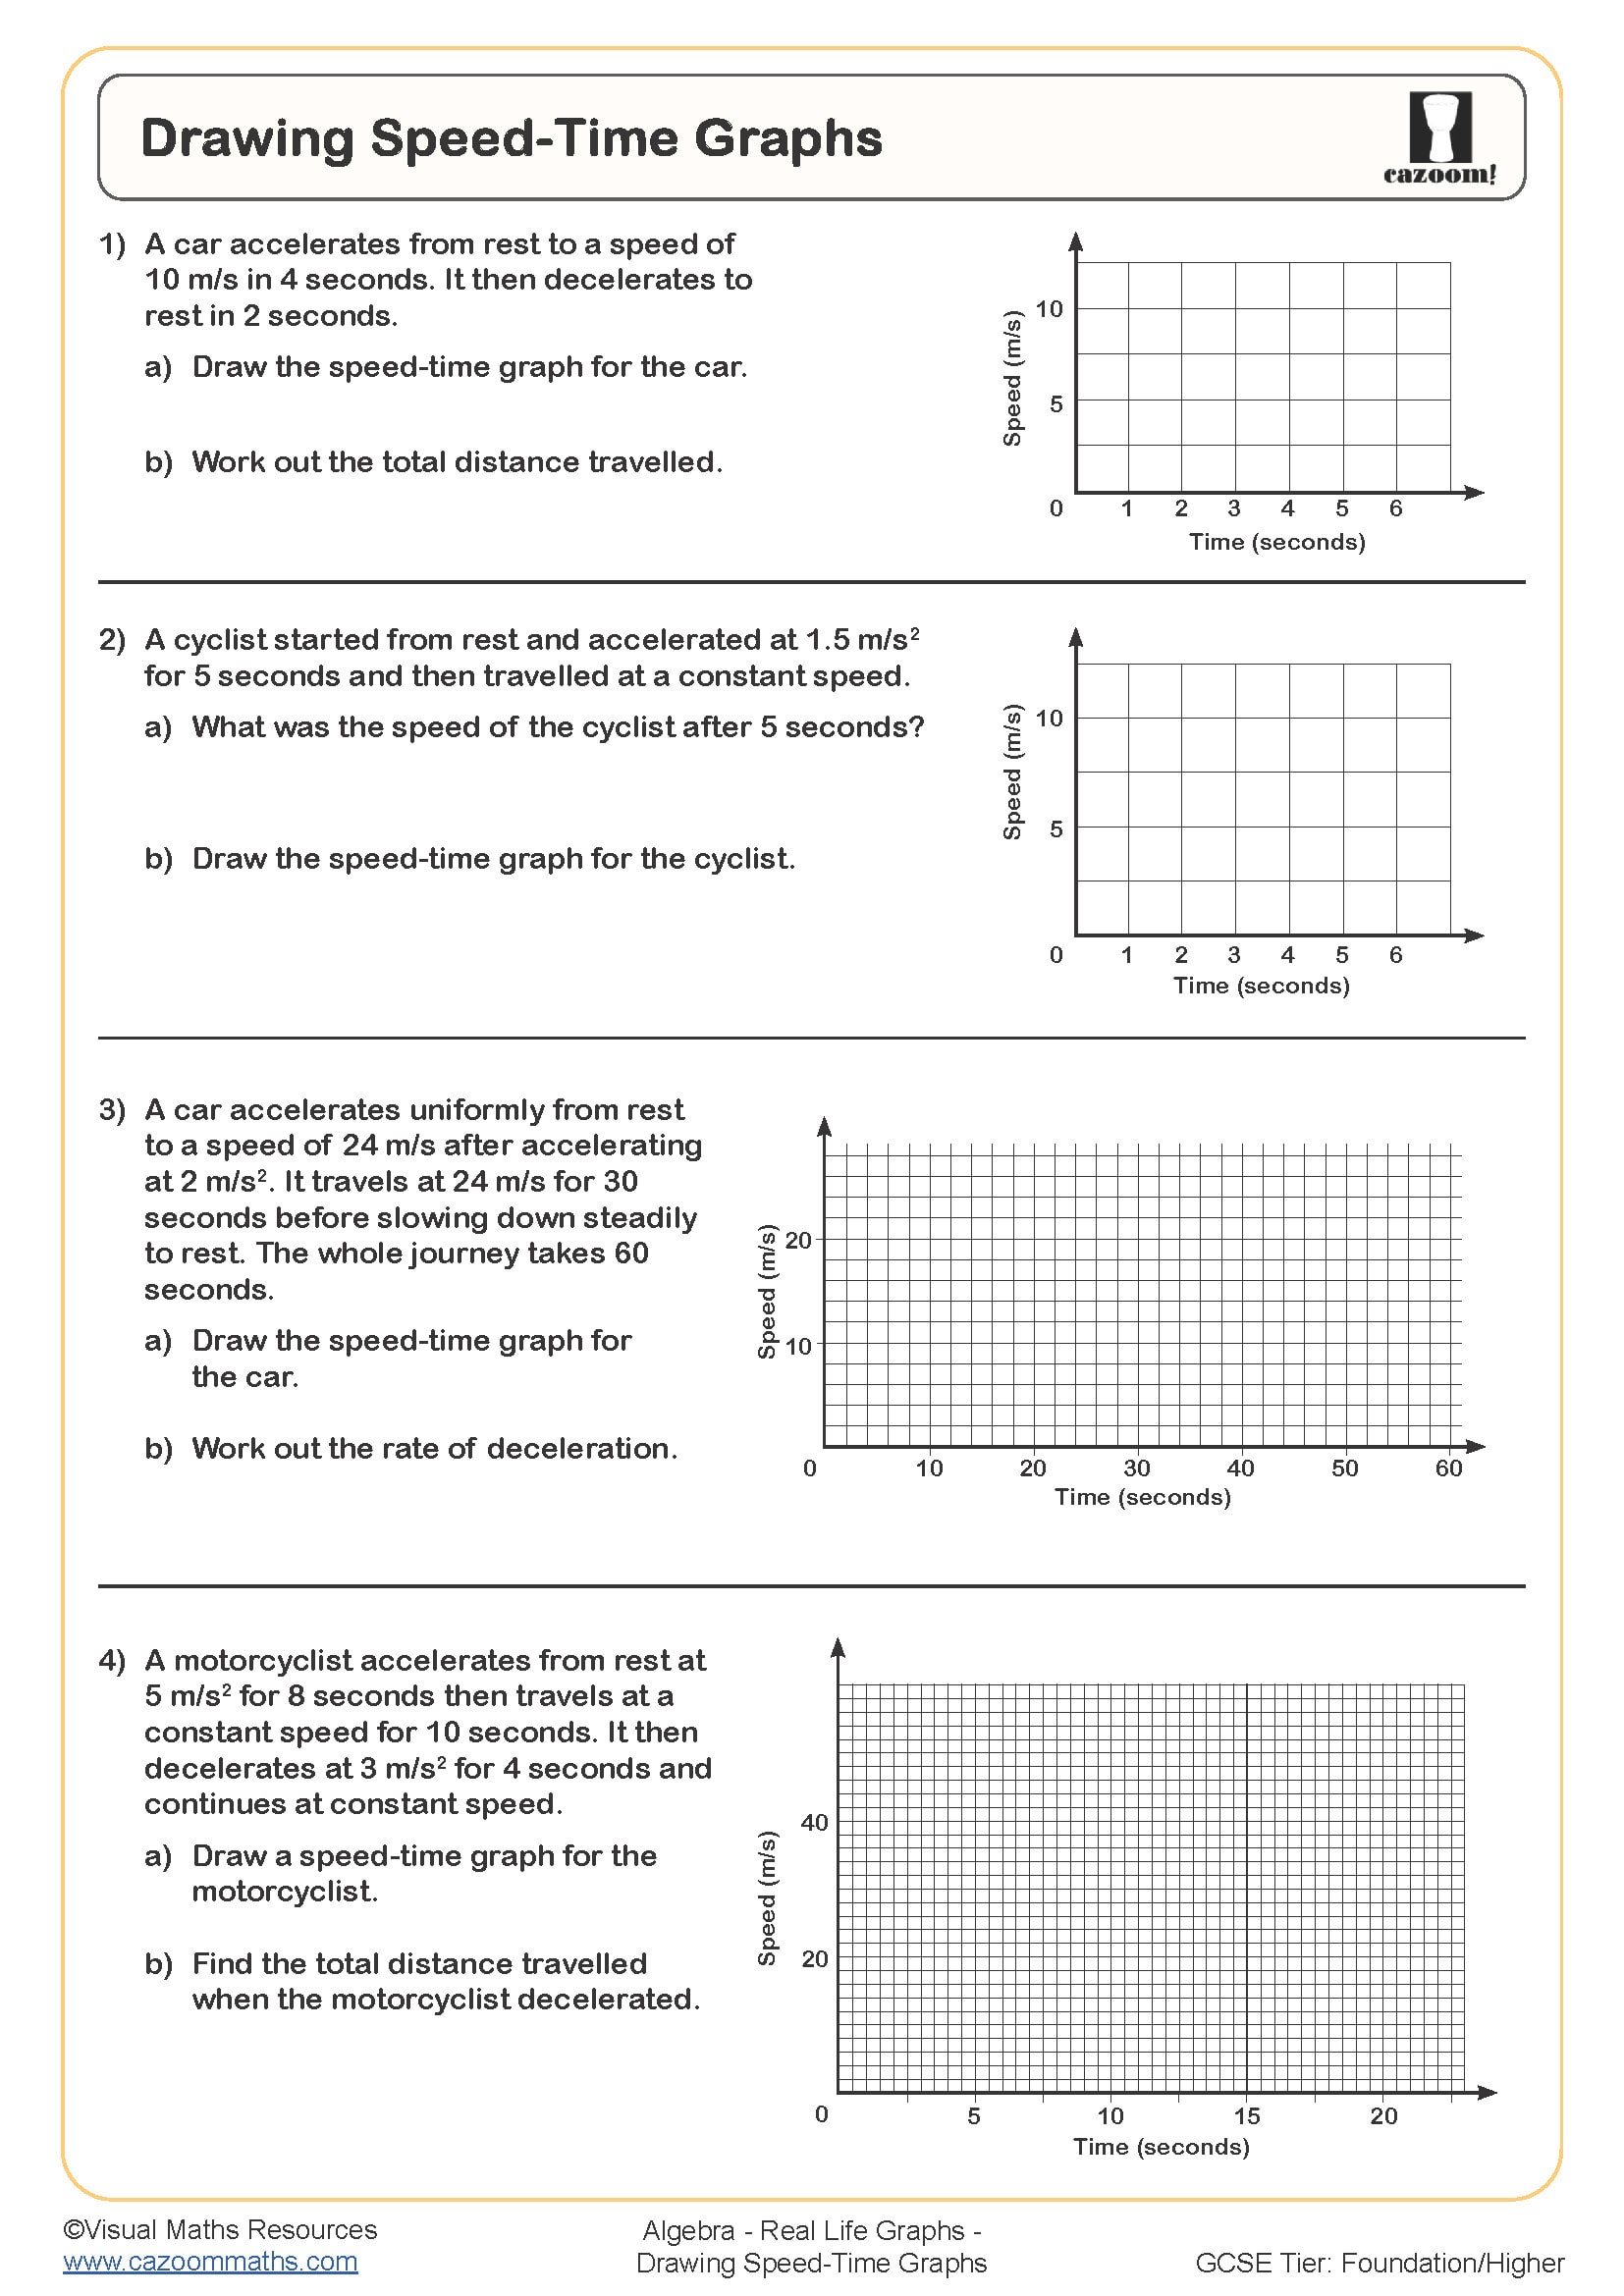
Distance-time graphs plot the relationship between time elapsed and distance travelled, with the gradient representing speed. A steeper gradient indicates faster travel, horizontal sections show stationary periods, and curved sections represent acceleration or deceleration. Students learn to extract information about journeys, calculate speeds for different sections, and determine when two people or vehicles meet by identifying where their graphs intersect.
This skill connects directly to navigation systems, logistics, and transport planning. Delivery companies use similar graphical analysis to optimise routes and predict arrival times, whilst traffic management systems analyse vehicle speeds from distance-time data. In physics and engineering, understanding how displacement relates to time underpins kinematics—the foundation for designing everything from rollercoasters to spacecraft trajectories. Students who grasp that gradients represent rates of change can apply this reasoning across STEM subjects, recognising the same principle whether they're analysing chemical reaction rates or population growth models.
How Can Teachers Use These Real Life Graphs Worksheets?
The worksheets provide structured practice with questions that build from interpreting given graphs to sketching graphs from written descriptions. Many include scaffolded examples where students first identify features like gradients and intercepts, then progress to multi-step problems requiring calculations and written explanations. The answer sheets show complete working, which helps students understand the level of detail expected in GCSE exam responses, particularly for questions worth multiple marks where method marks depend on clear reasoning.
Teachers regularly use these resources for mixed-ability teaching by assigning different worksheets based on confidence levels, or as retrieval practice starters to reinforce prior learning. They work well for homework when students need independent consolidation, and during intervention sessions where small groups benefit from working through examples together before attempting questions individually. The contextual nature of the problems also makes them effective for paired discussion work, where students explain their reasoning to each other—a strategy that often reveals misunderstandings about what graph features actually represent in practical terms.