Averages and Range Worksheets
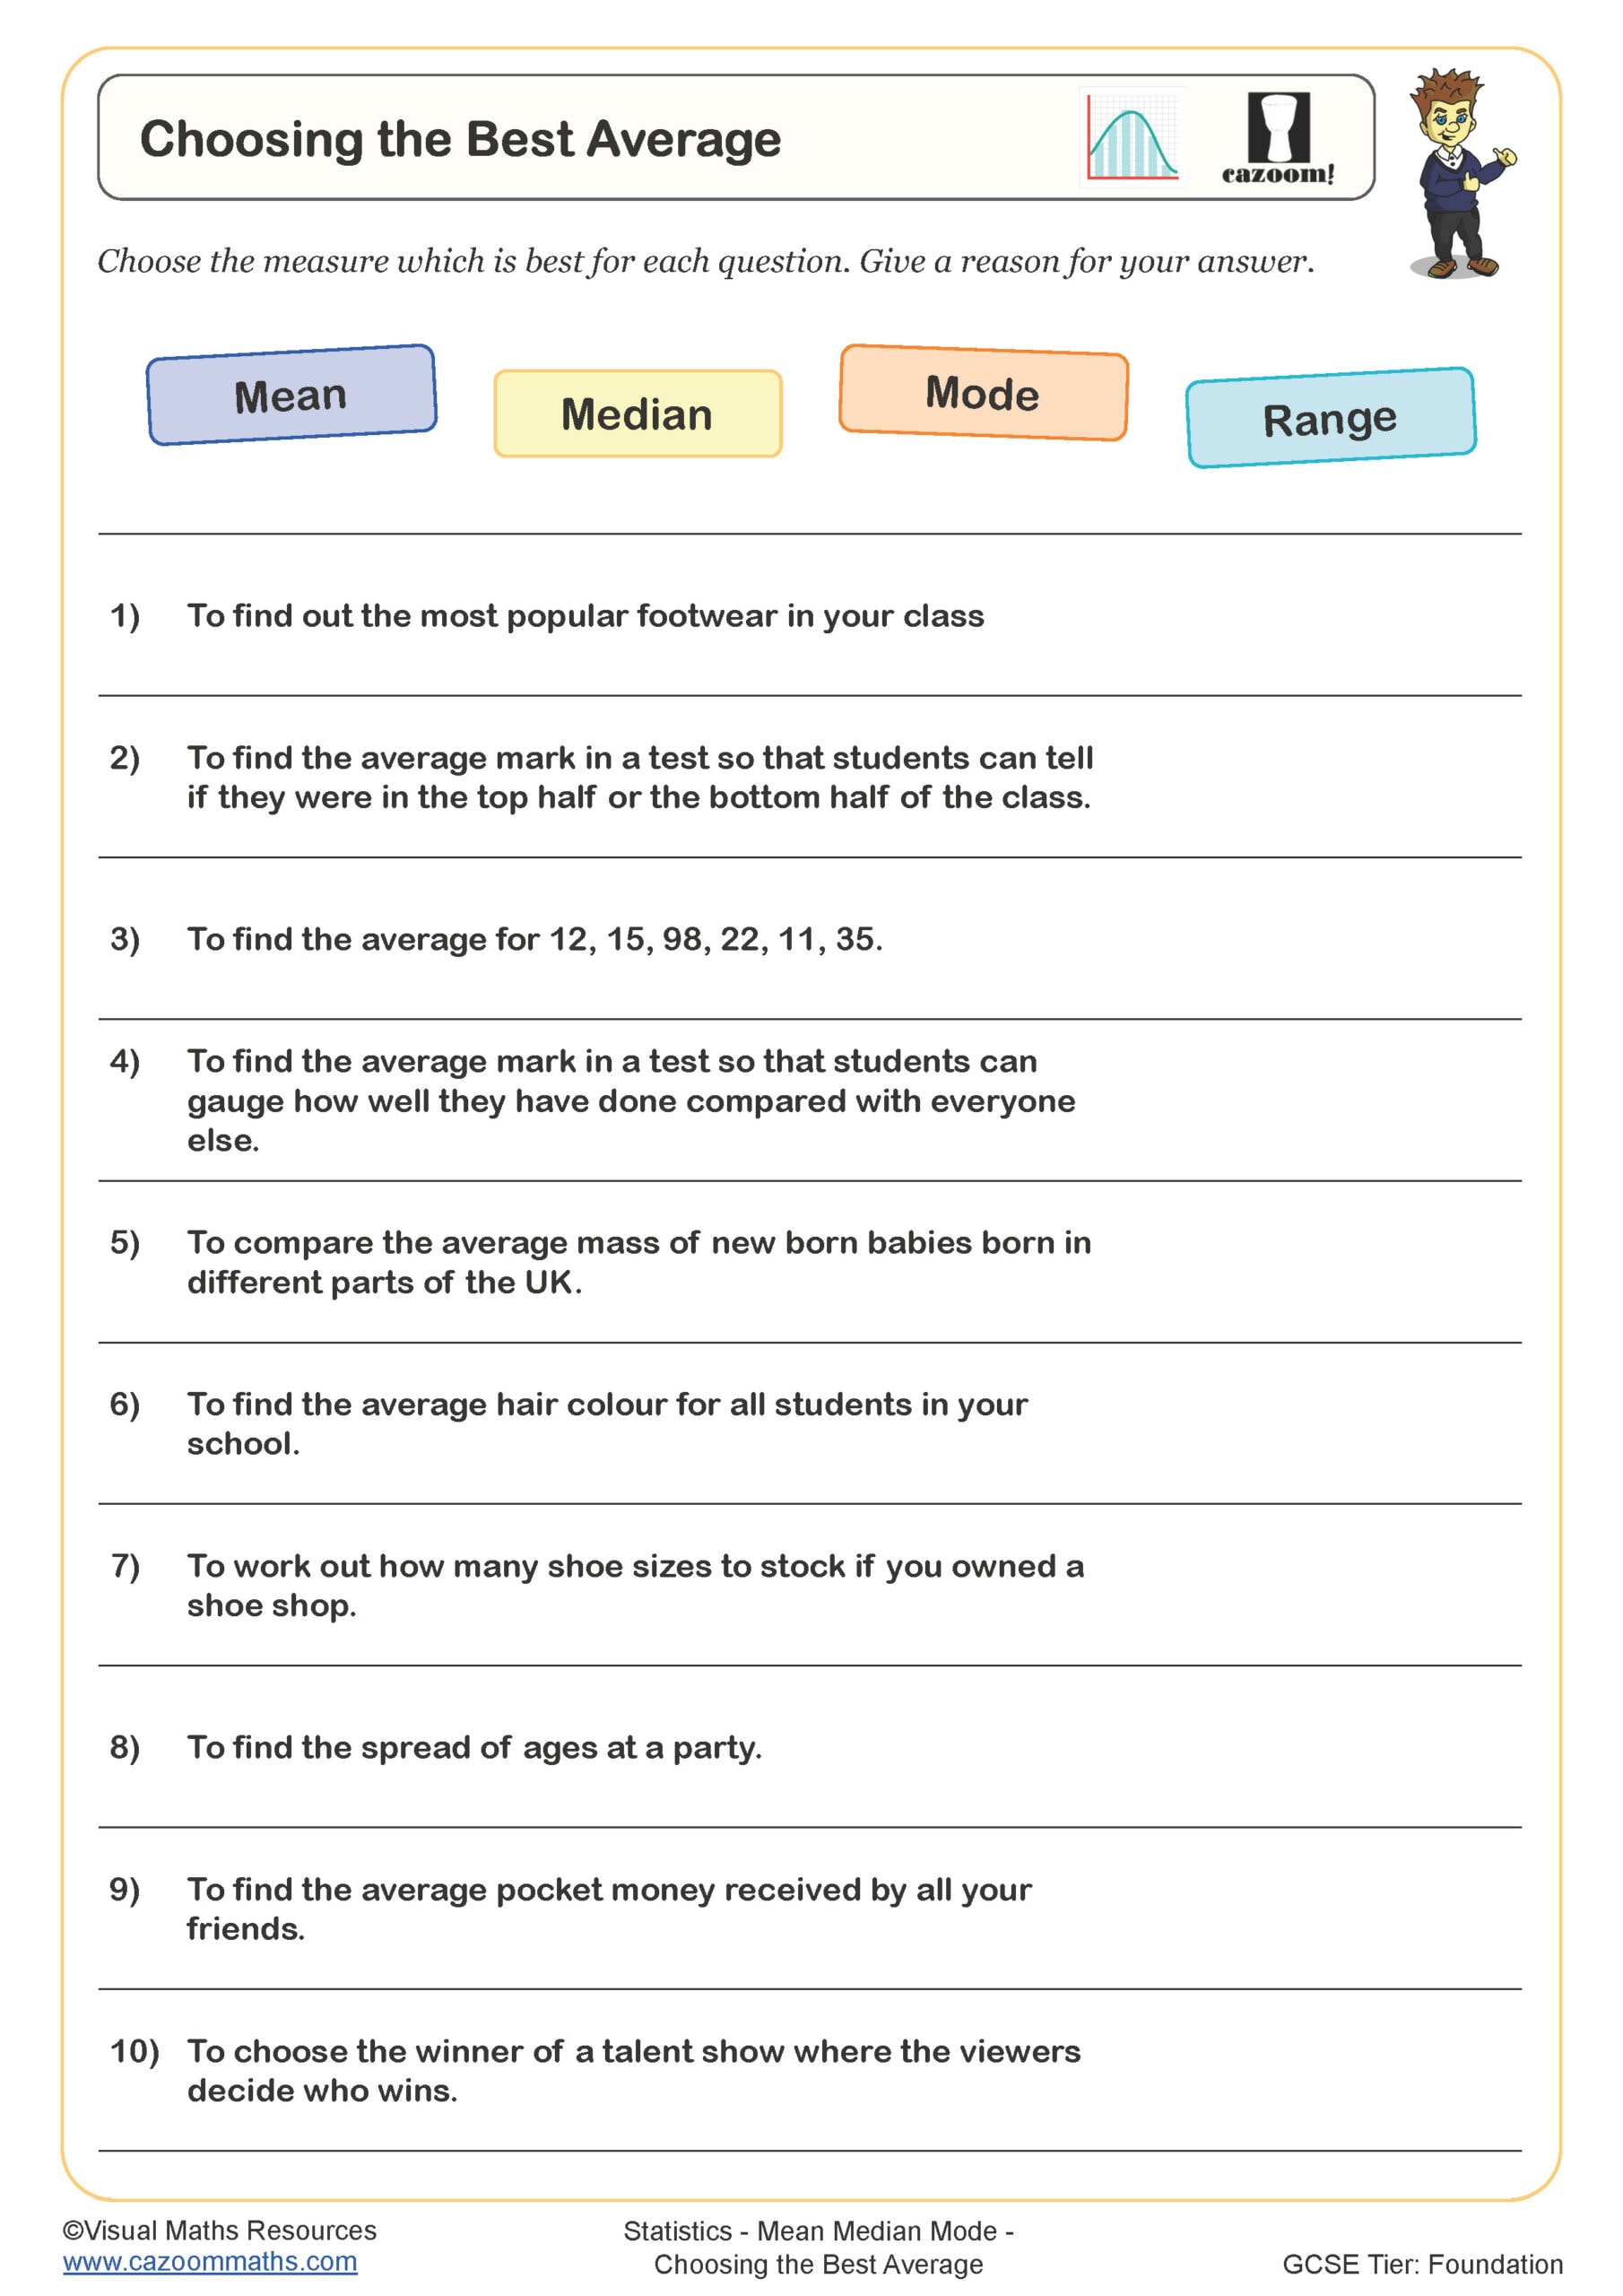
Choosing the Best Average
Year groups: 7, 8
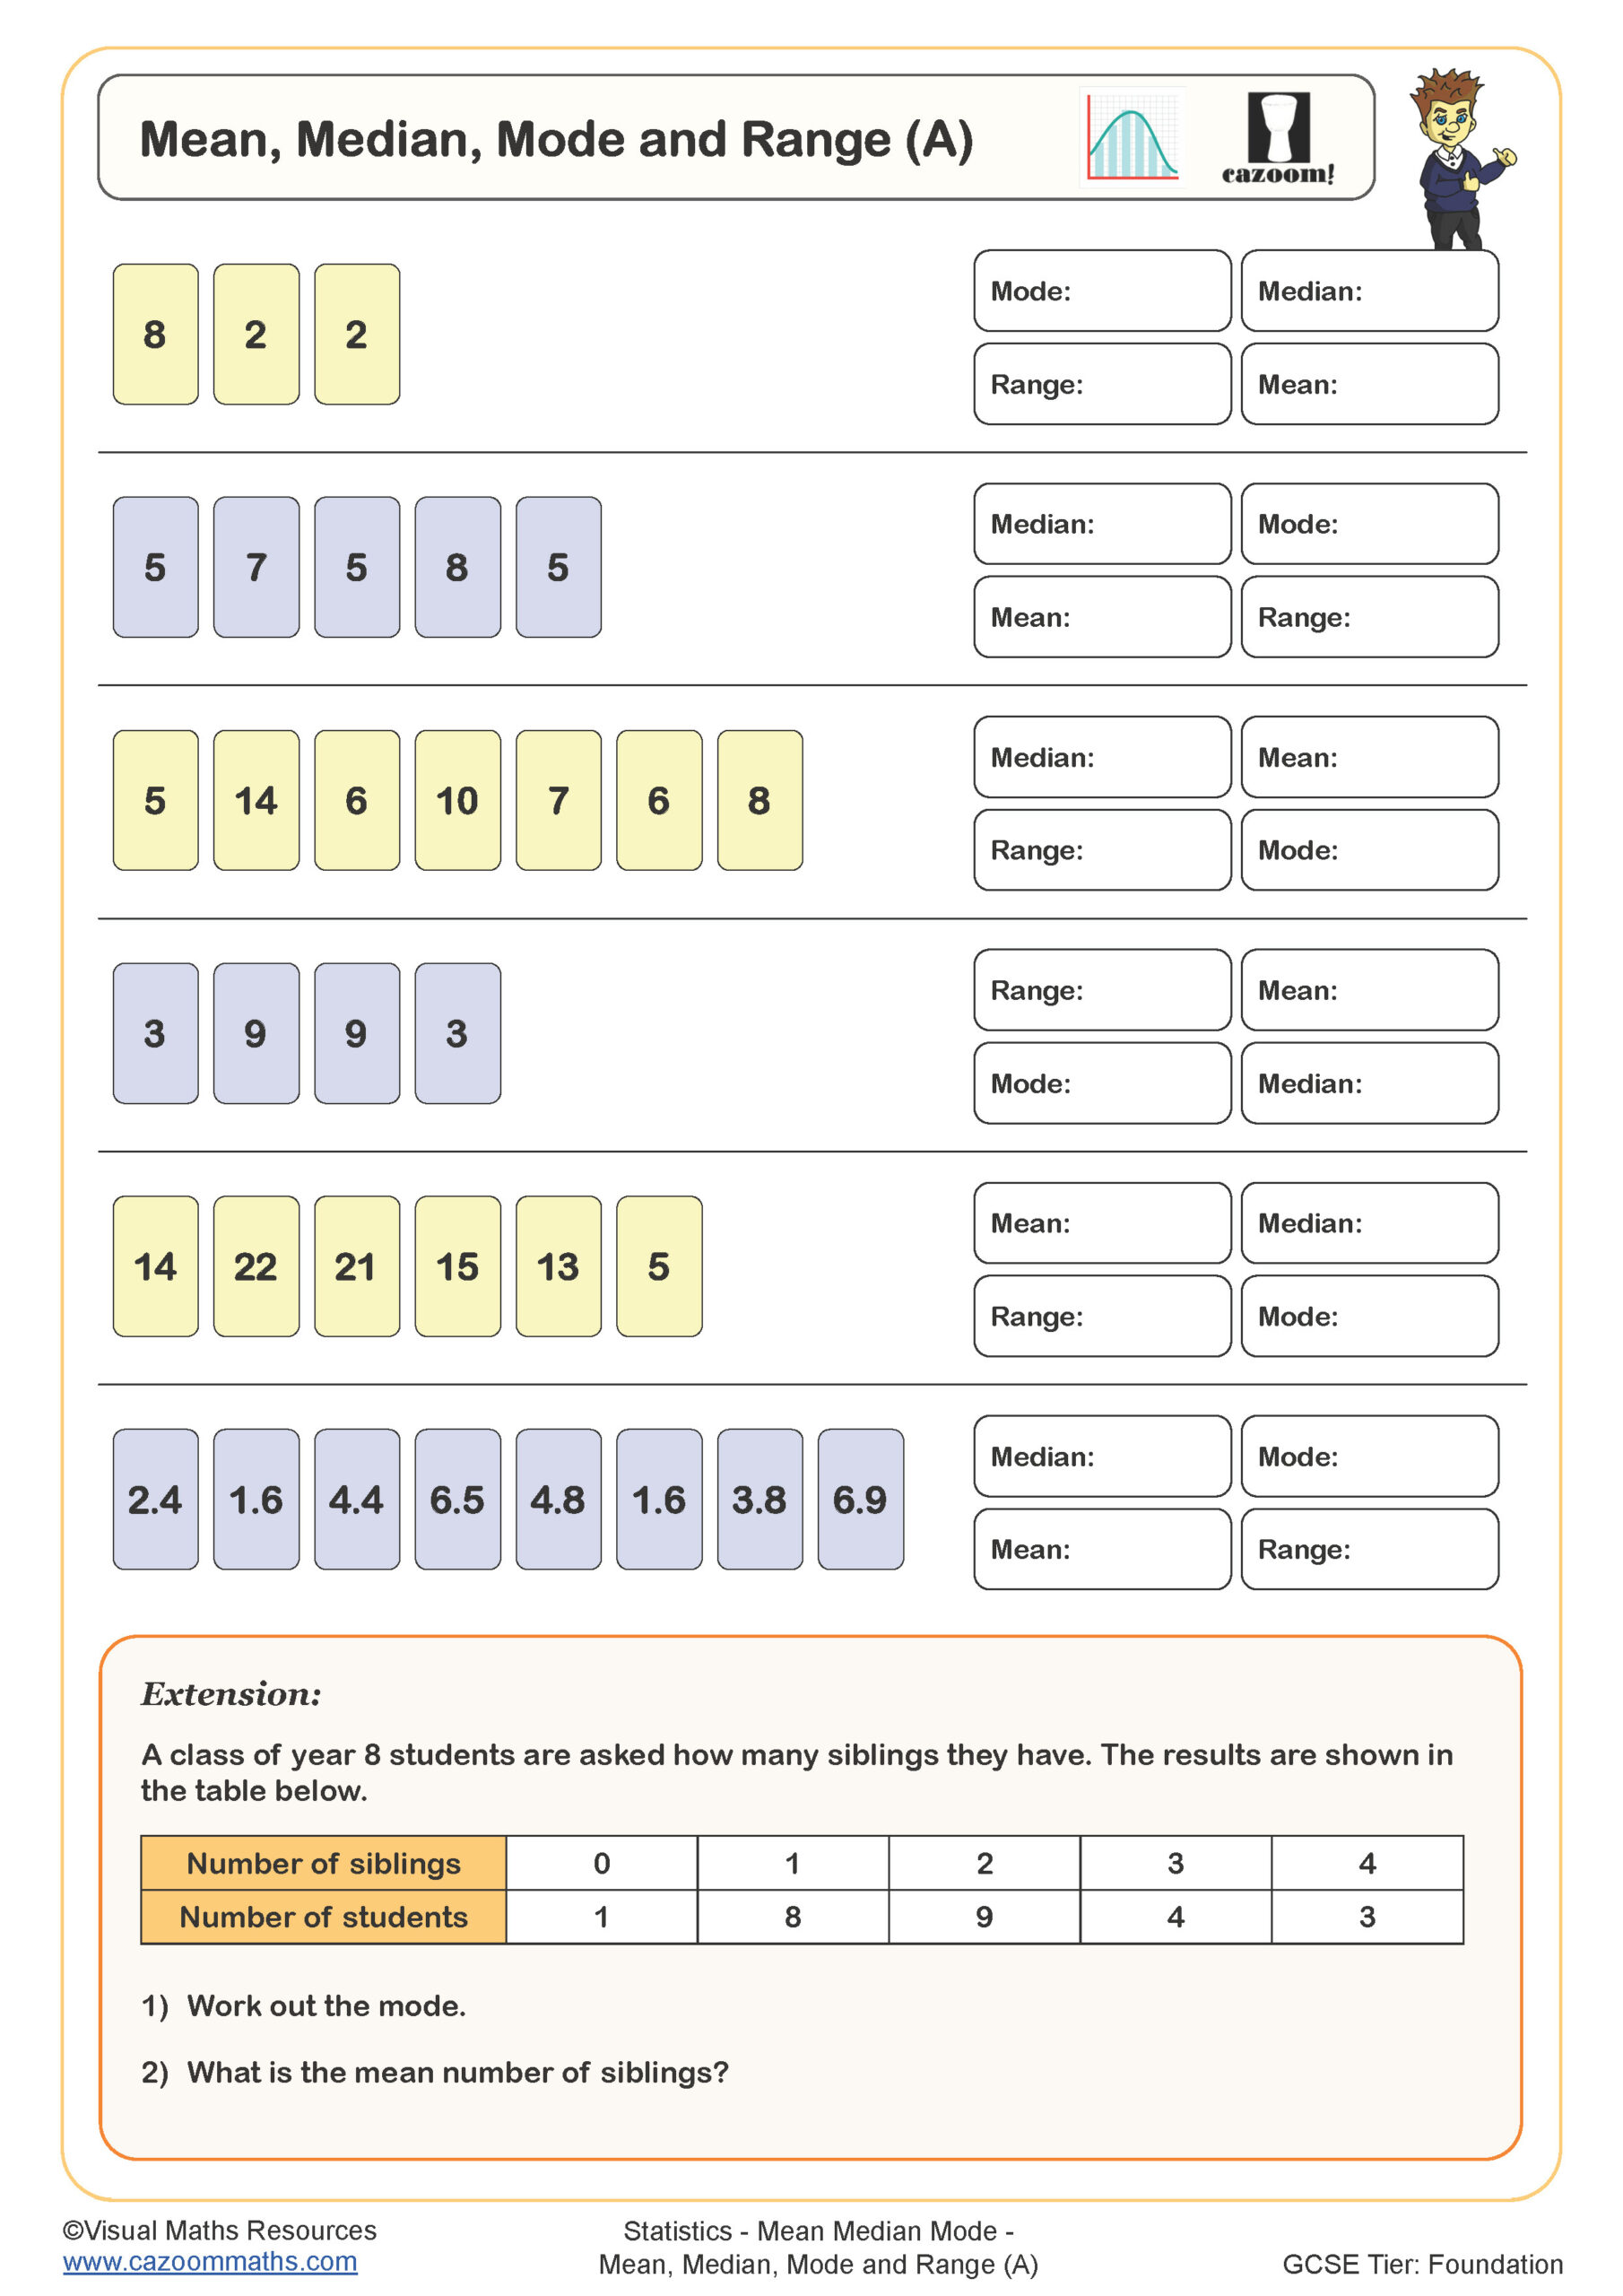
Mean, Median, Mode and Range (A)
Year groups: 7, 8
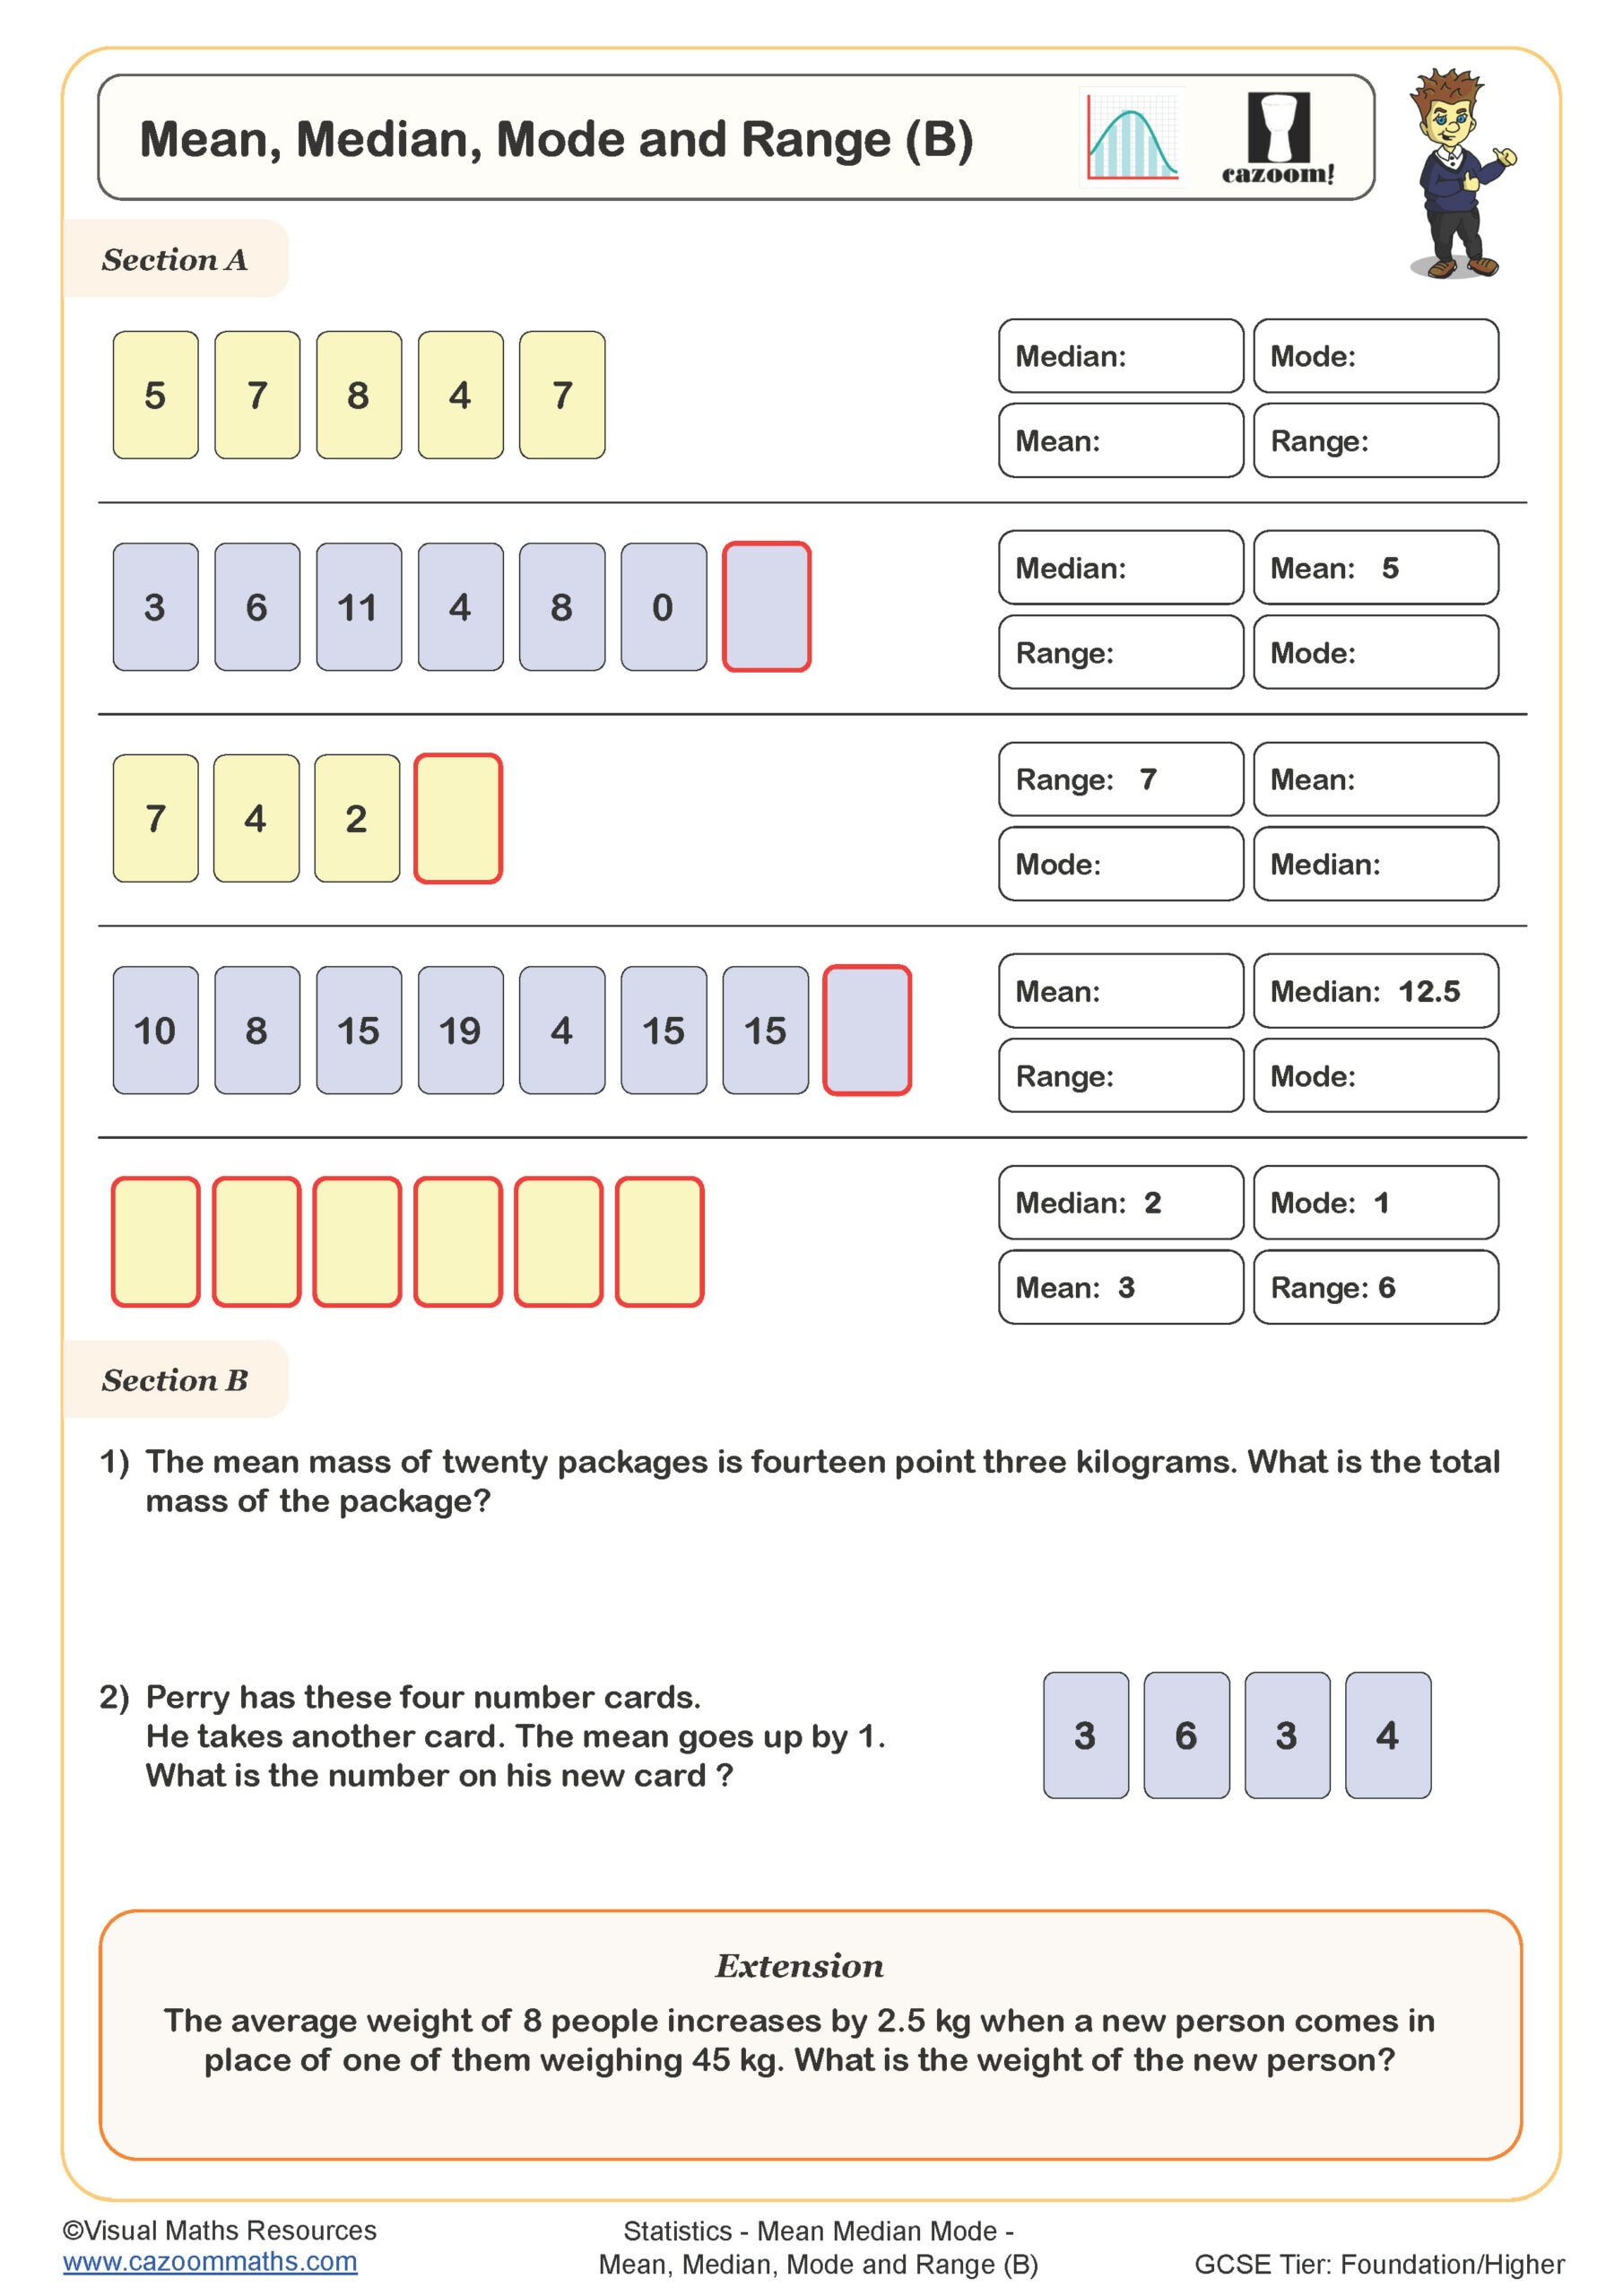
Mean, Median, Mode and Range (B)
Year groups: 7, 8
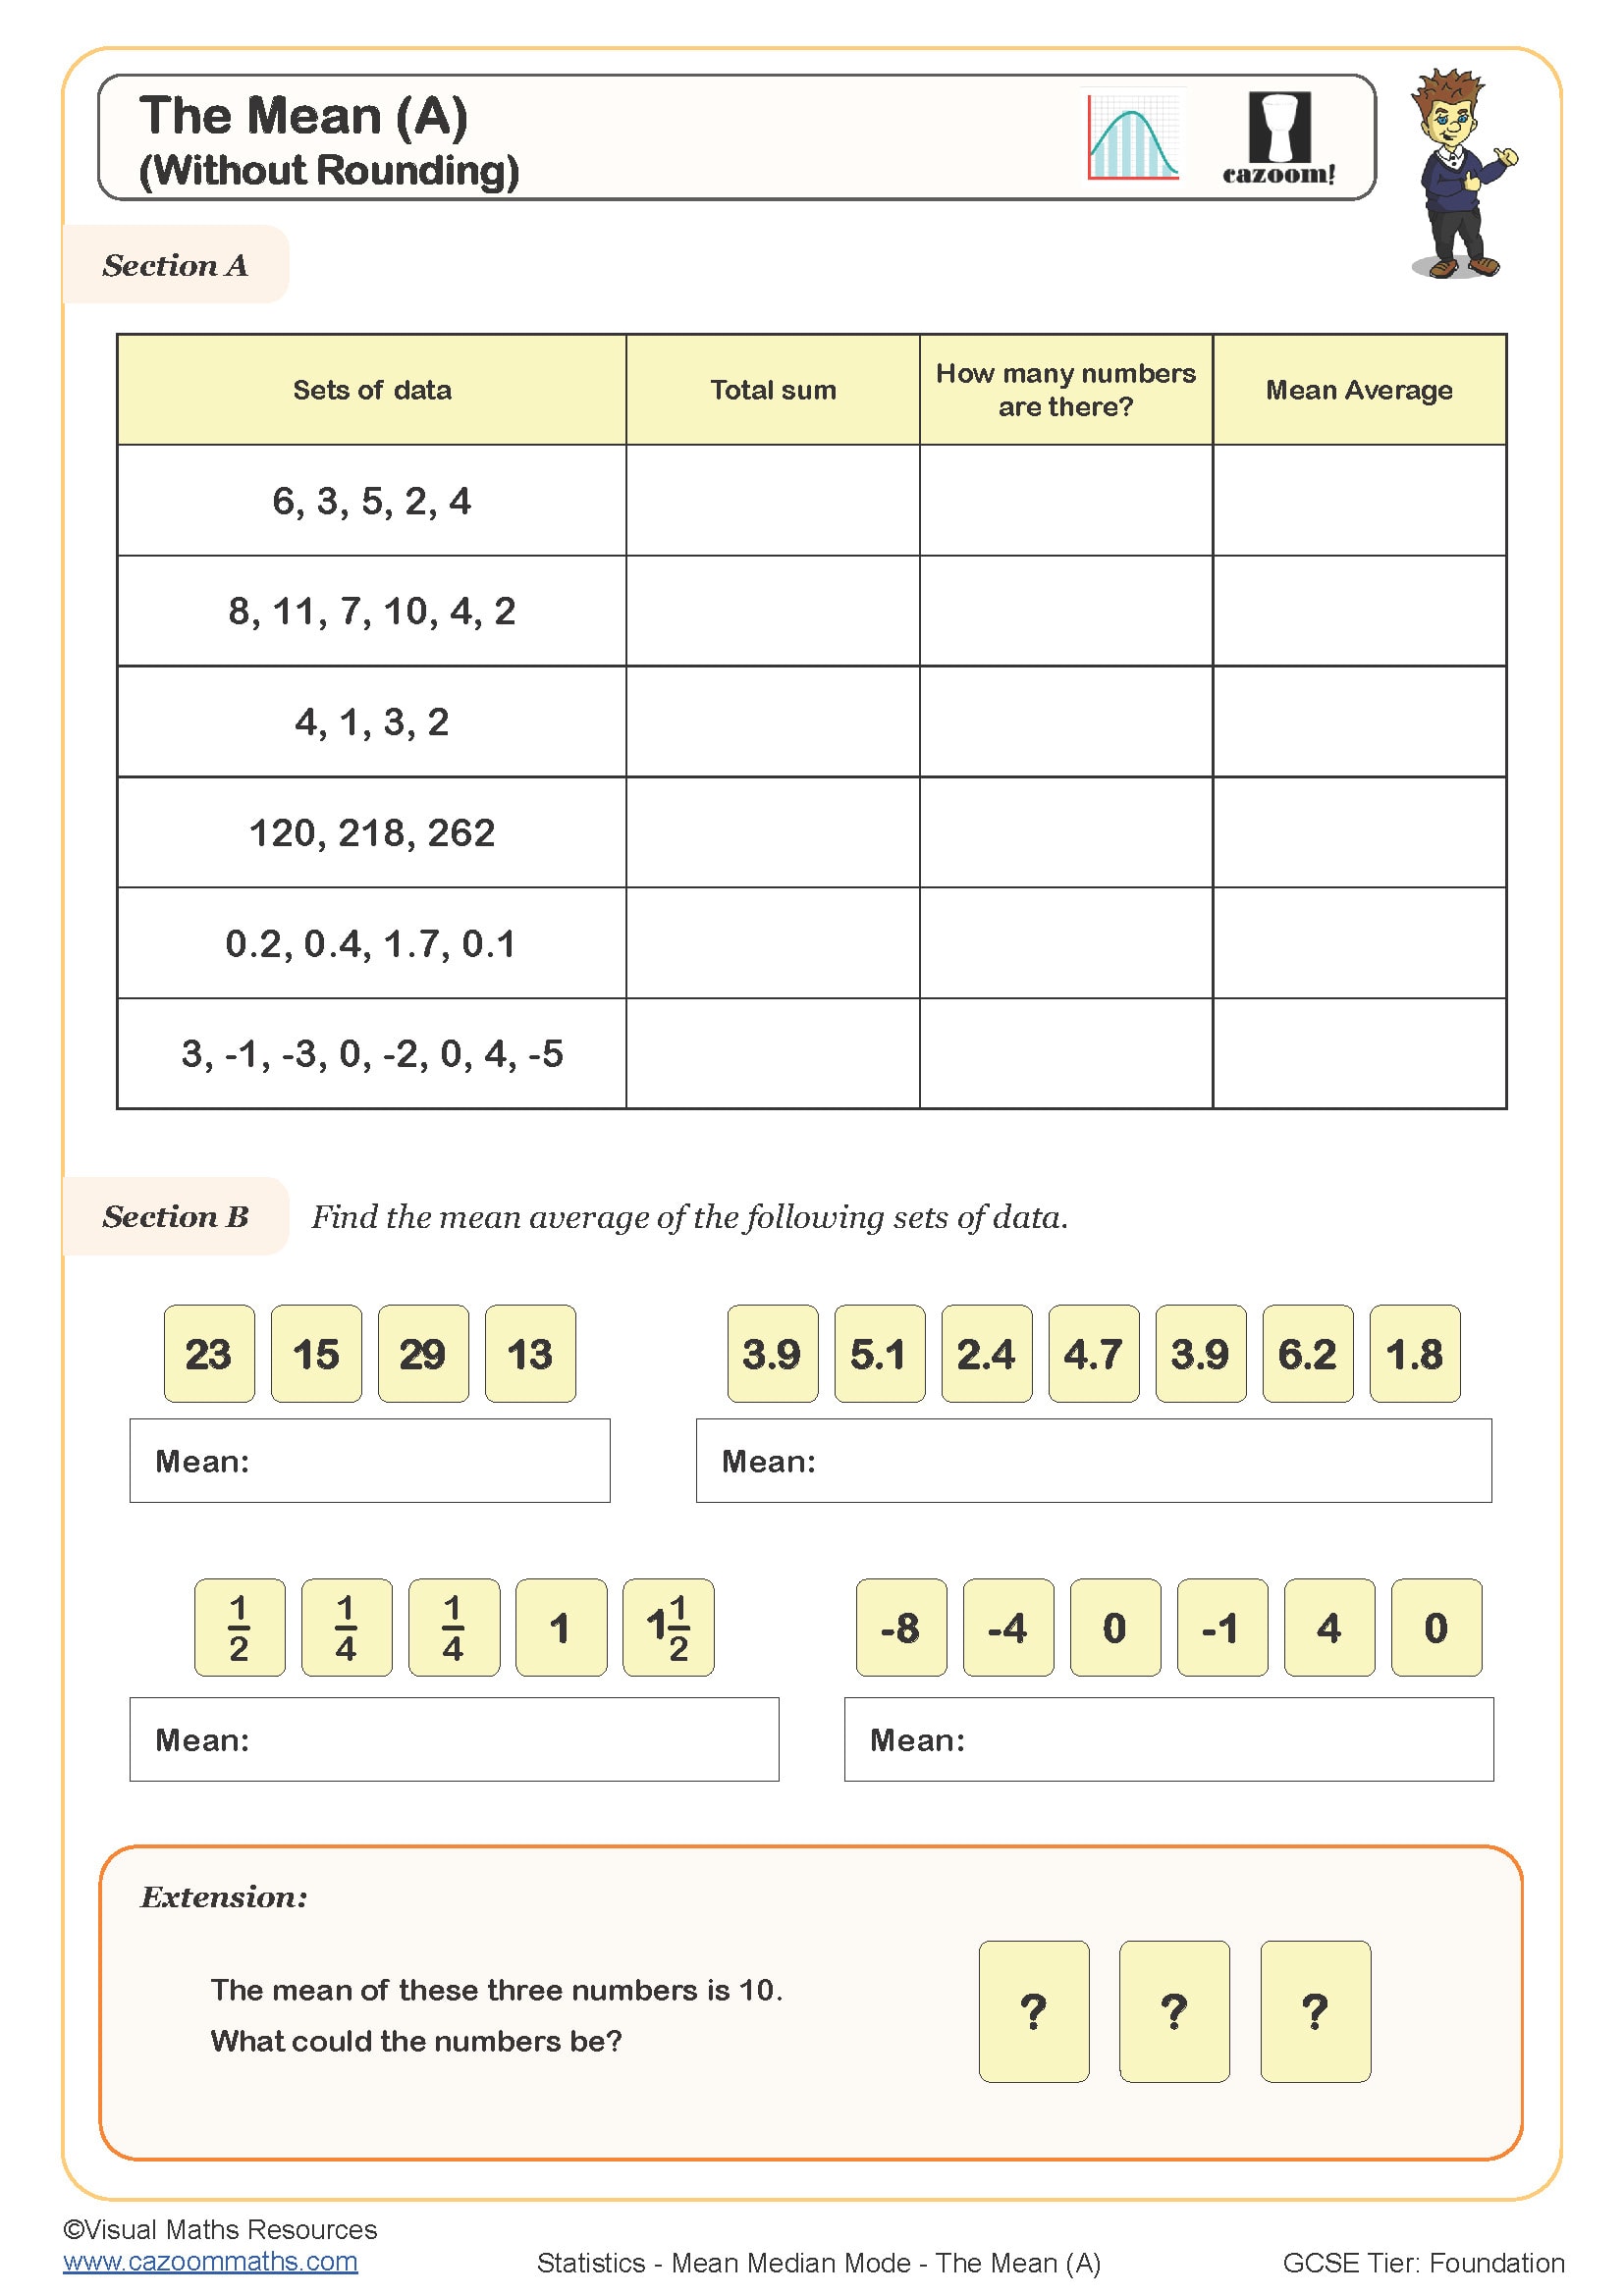
The Mean (A)
Year groups: 7, 8
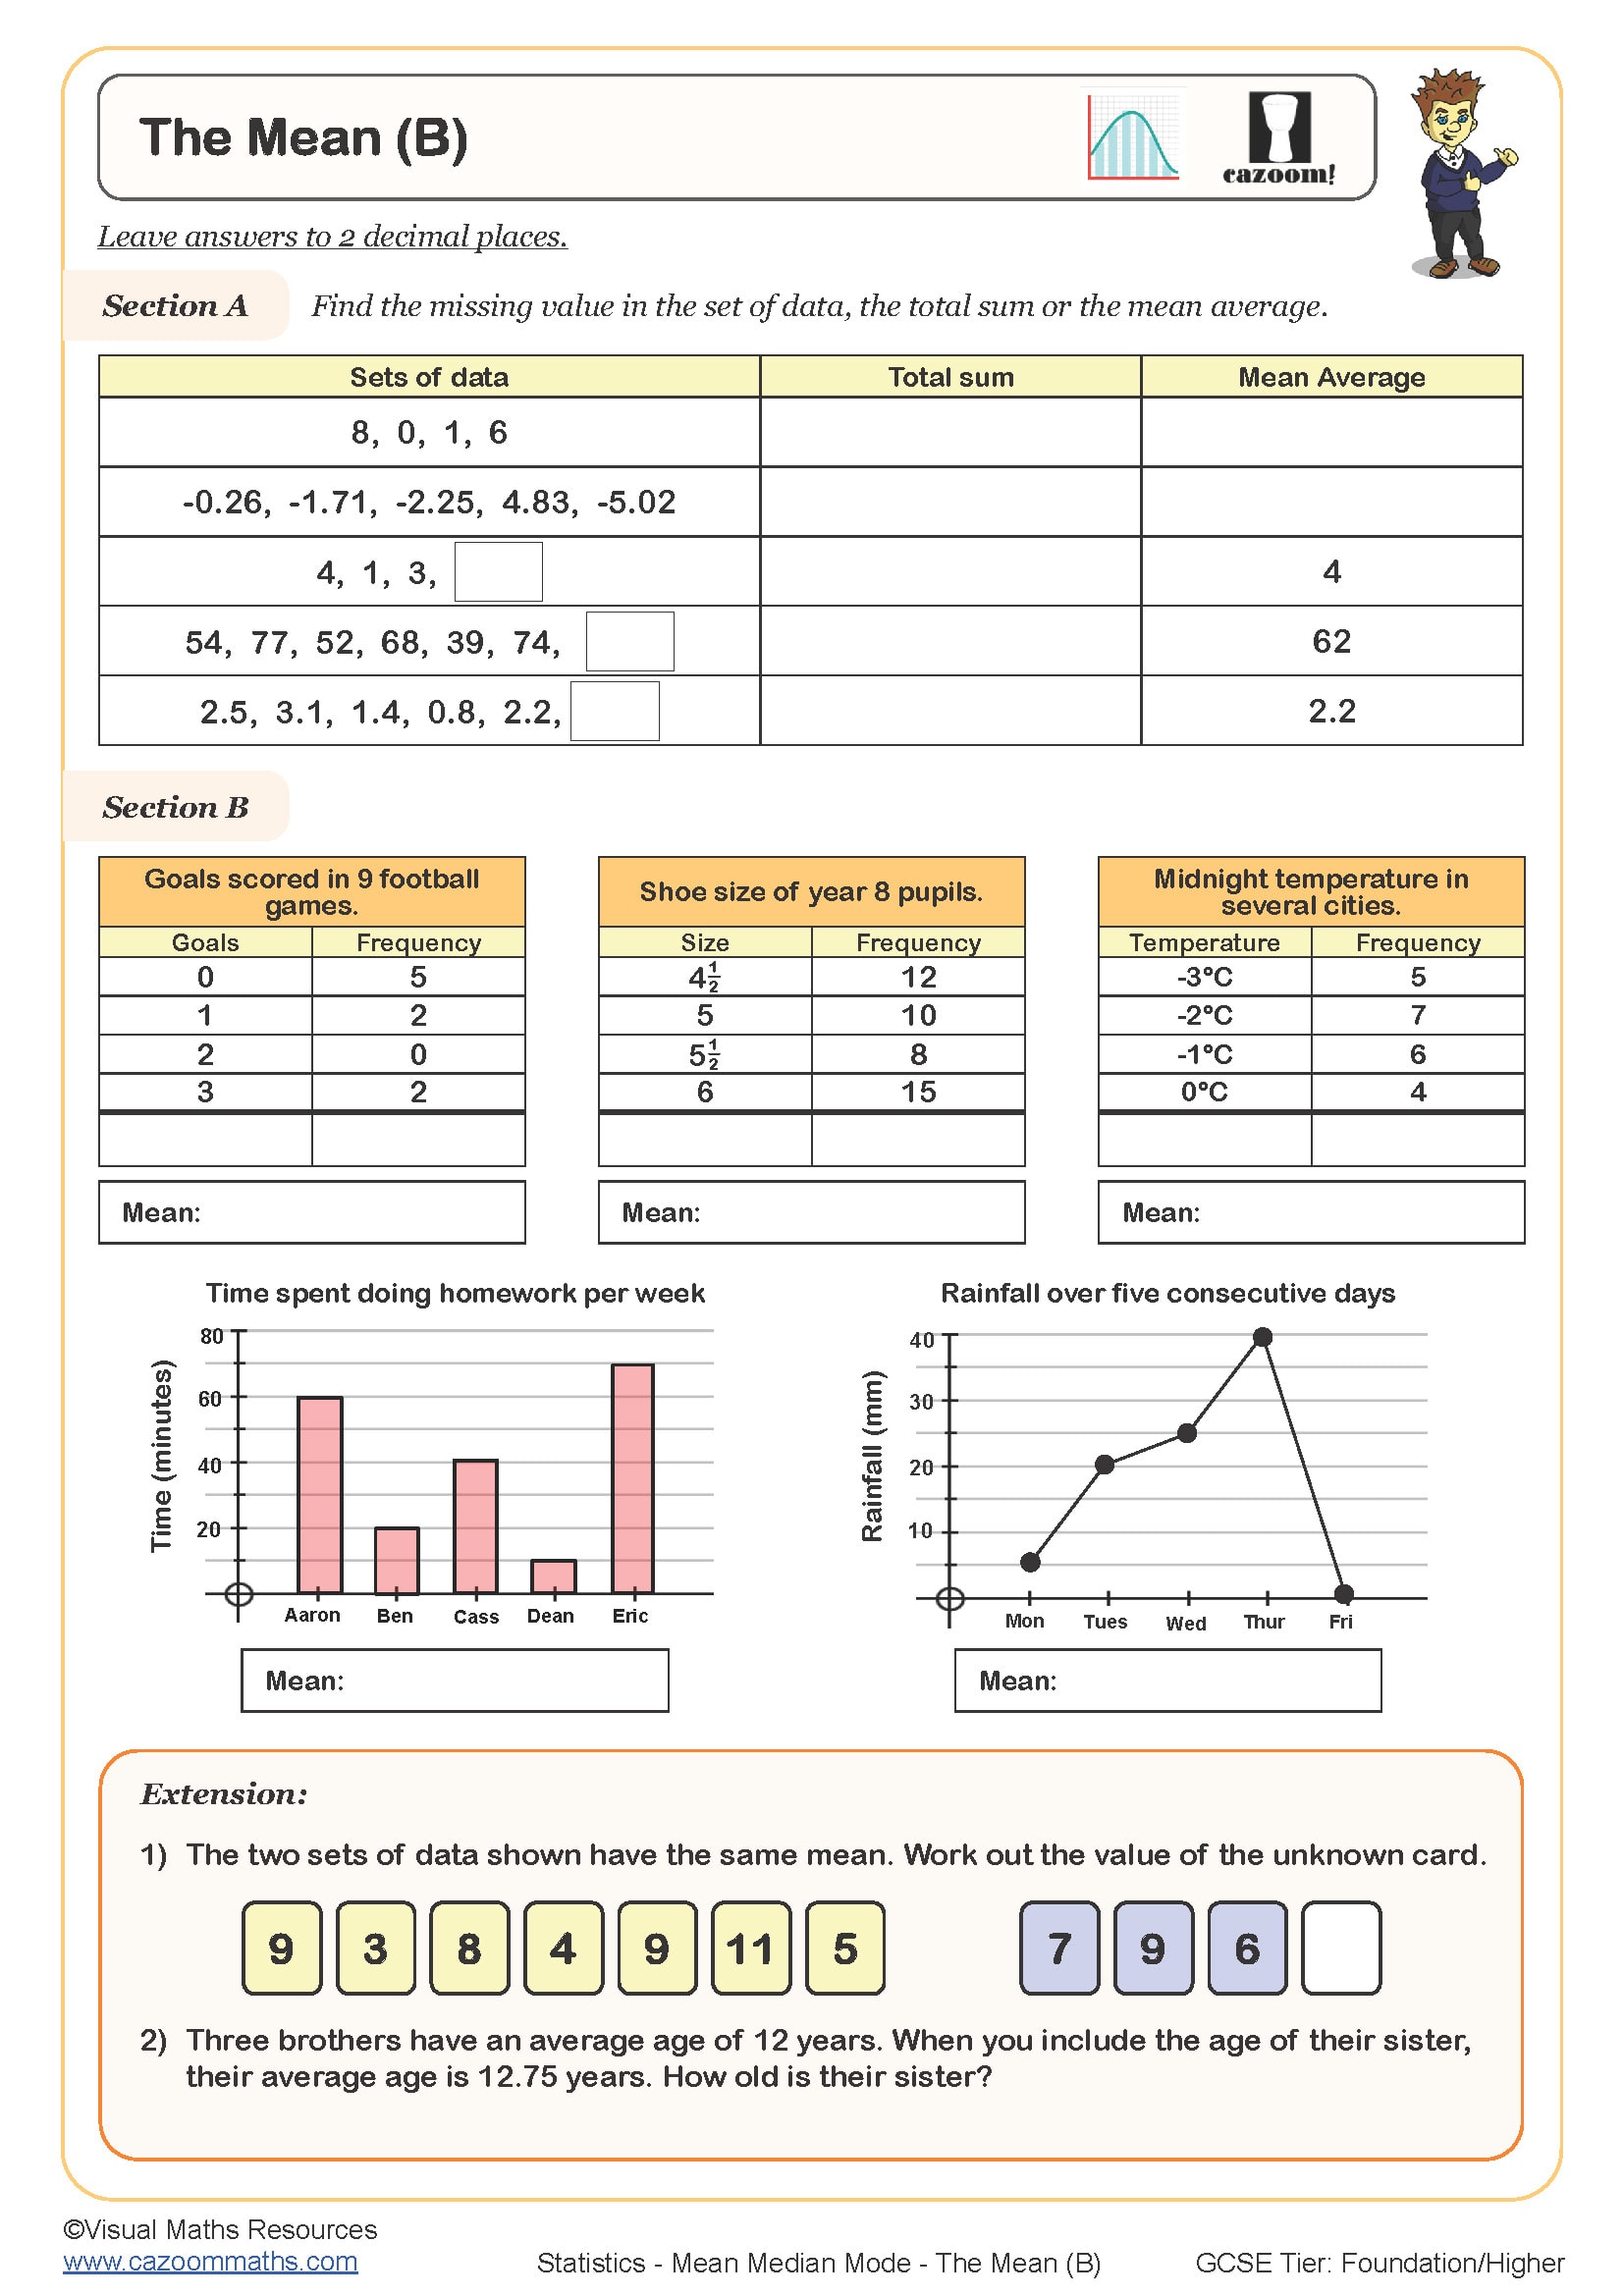
The Mean (B)
Year groups: 7, 8
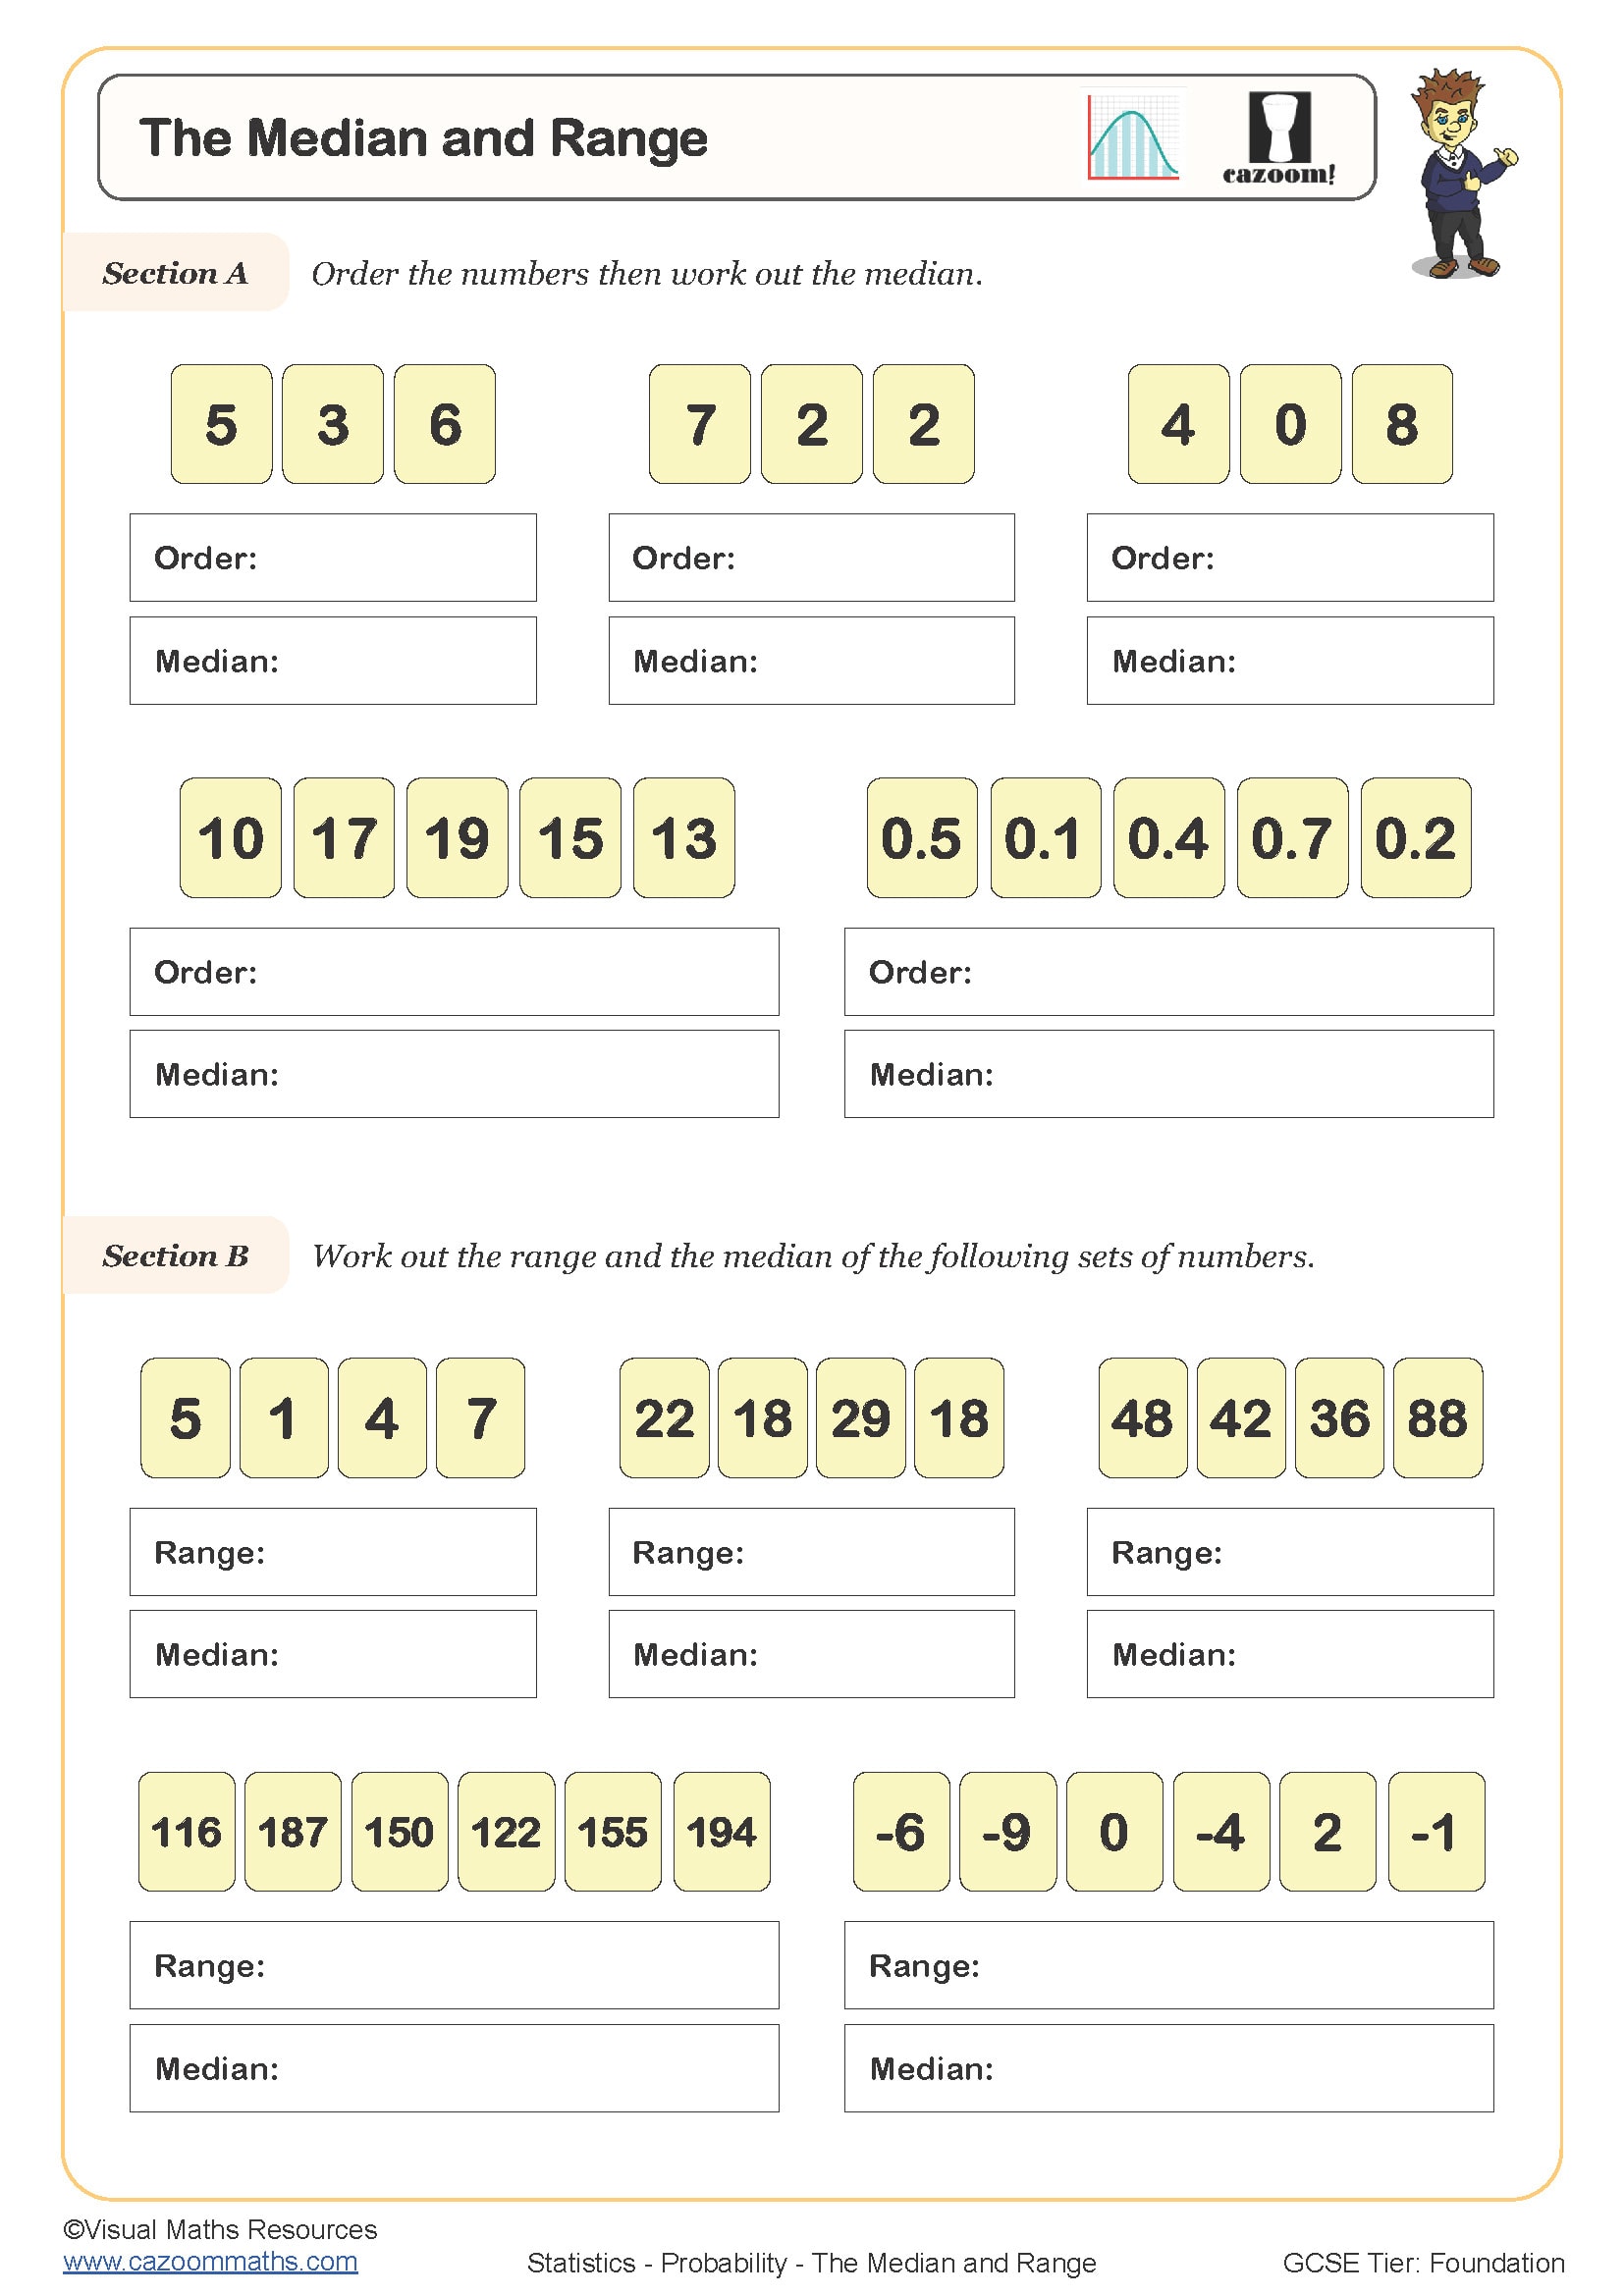
The Median and Range
Year groups: 7, 8
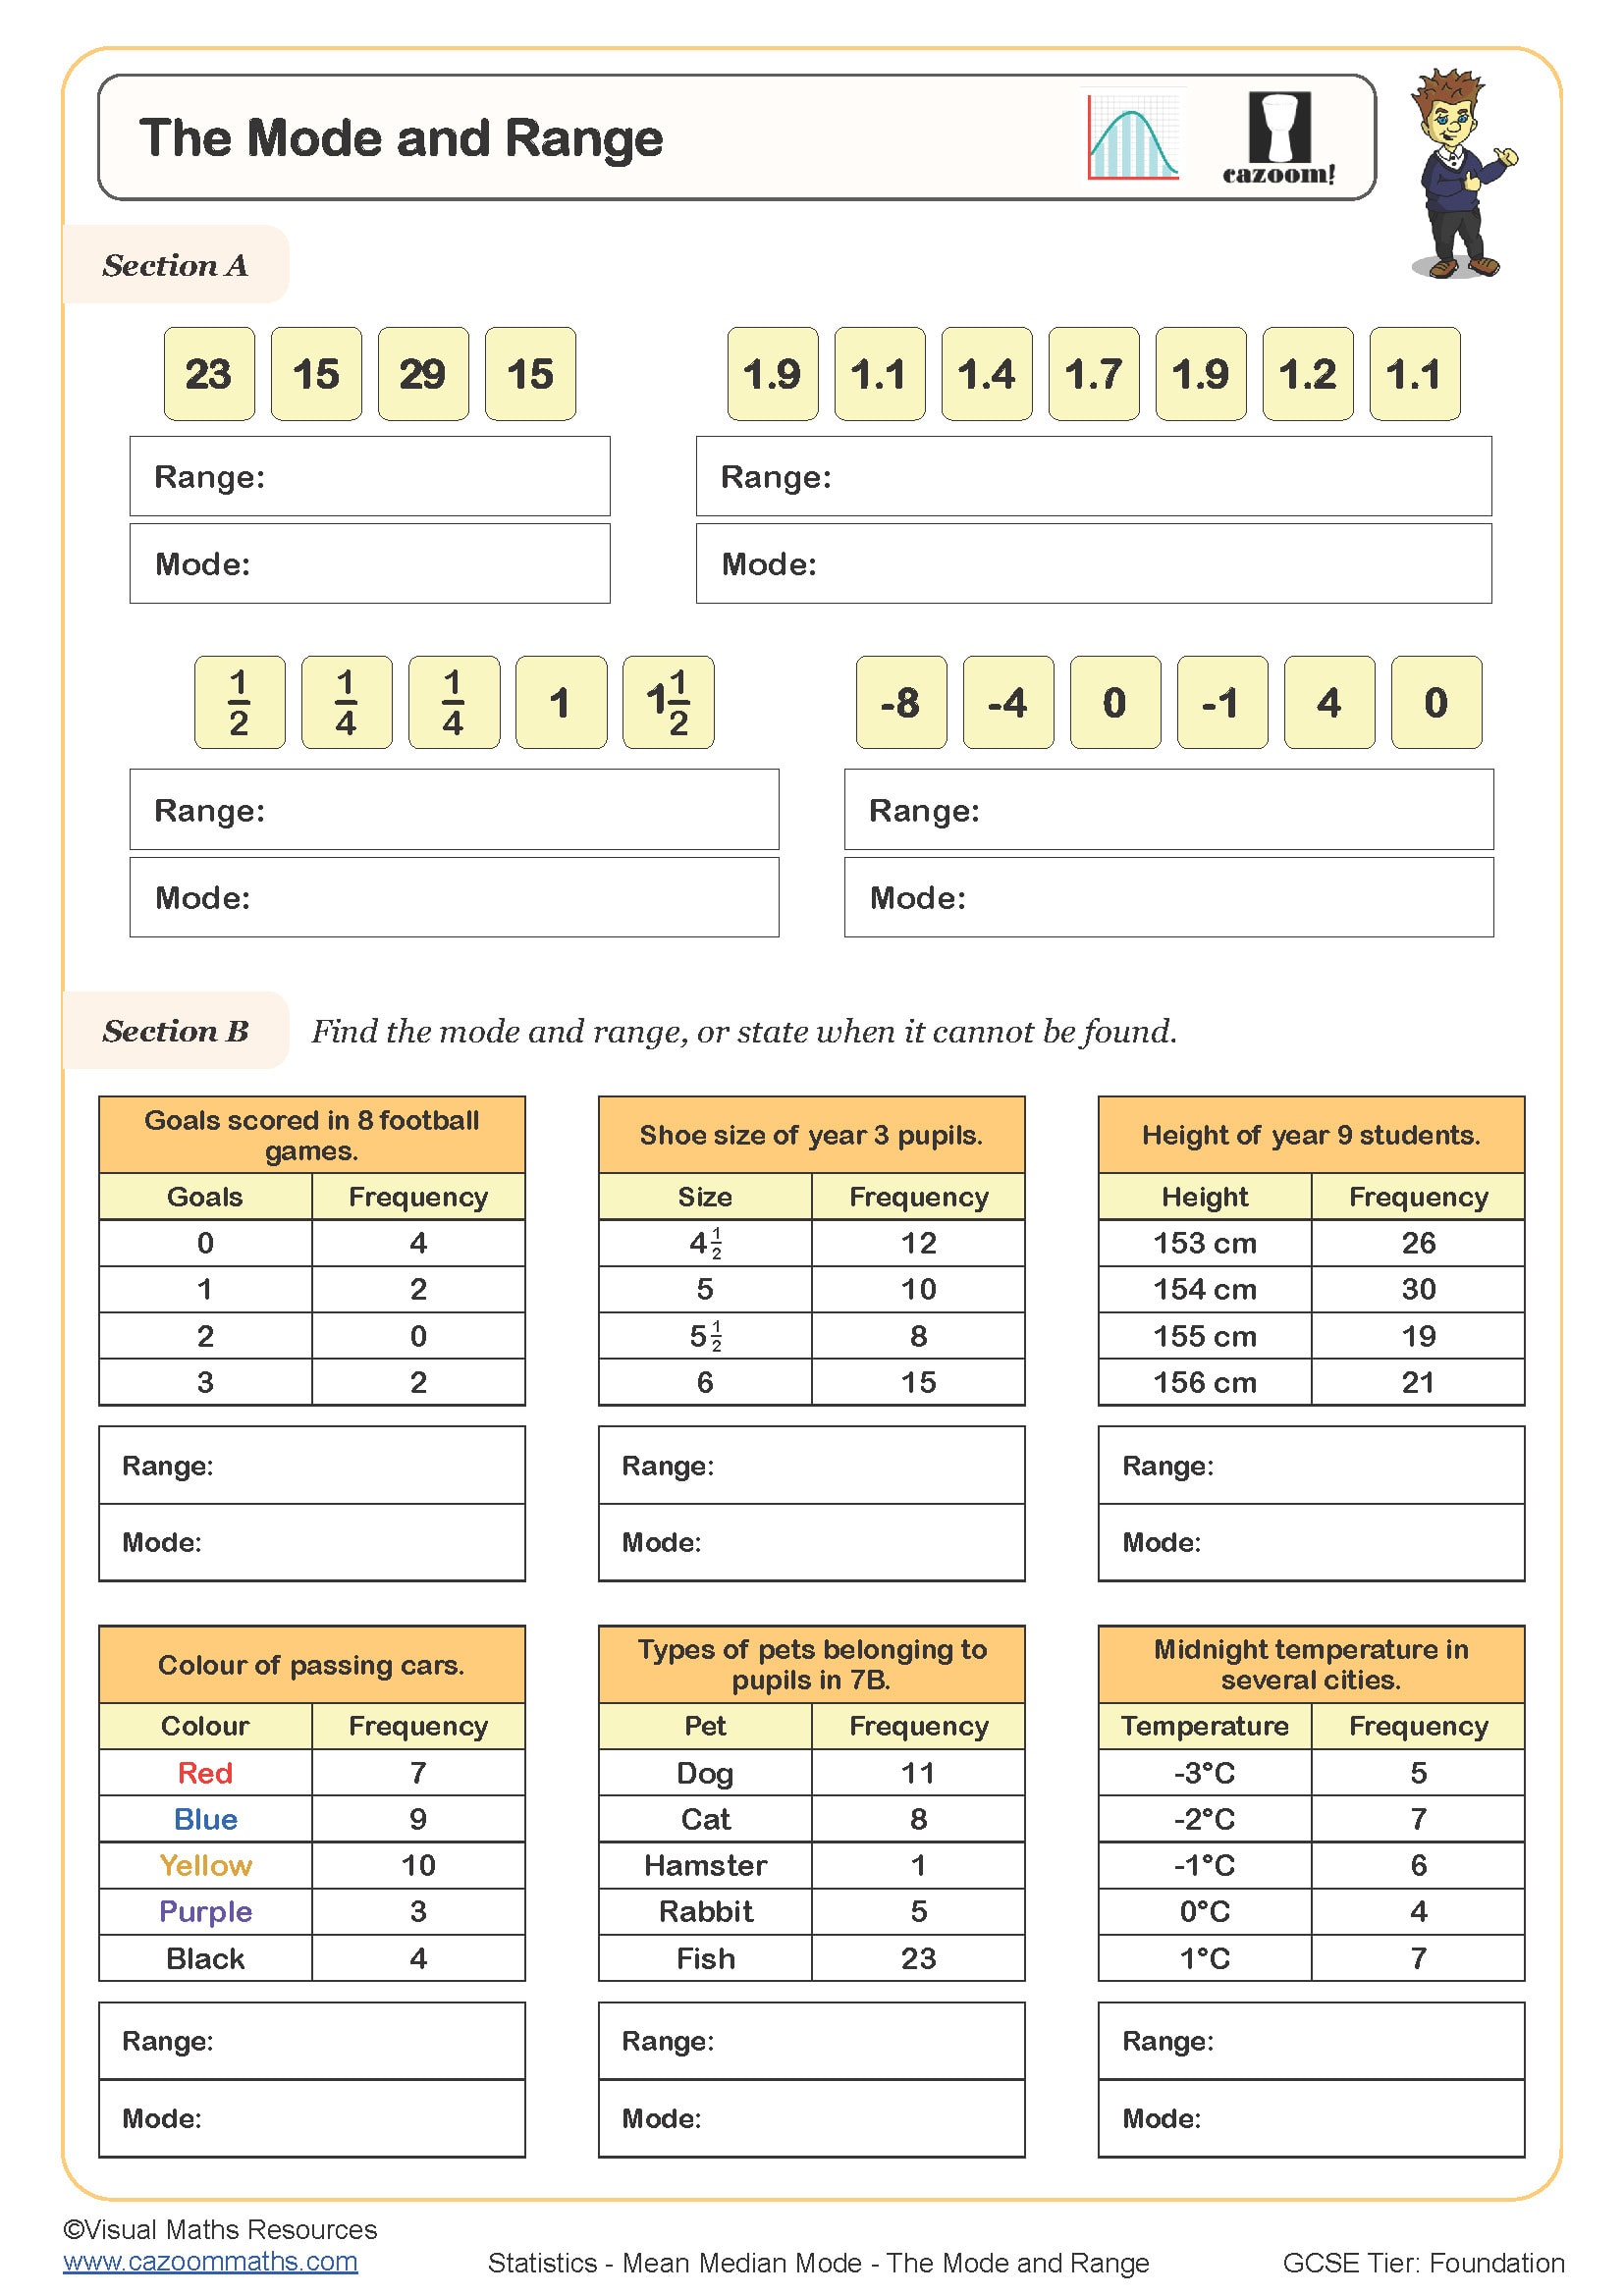
The Mode and Range
Year groups: 7, 8
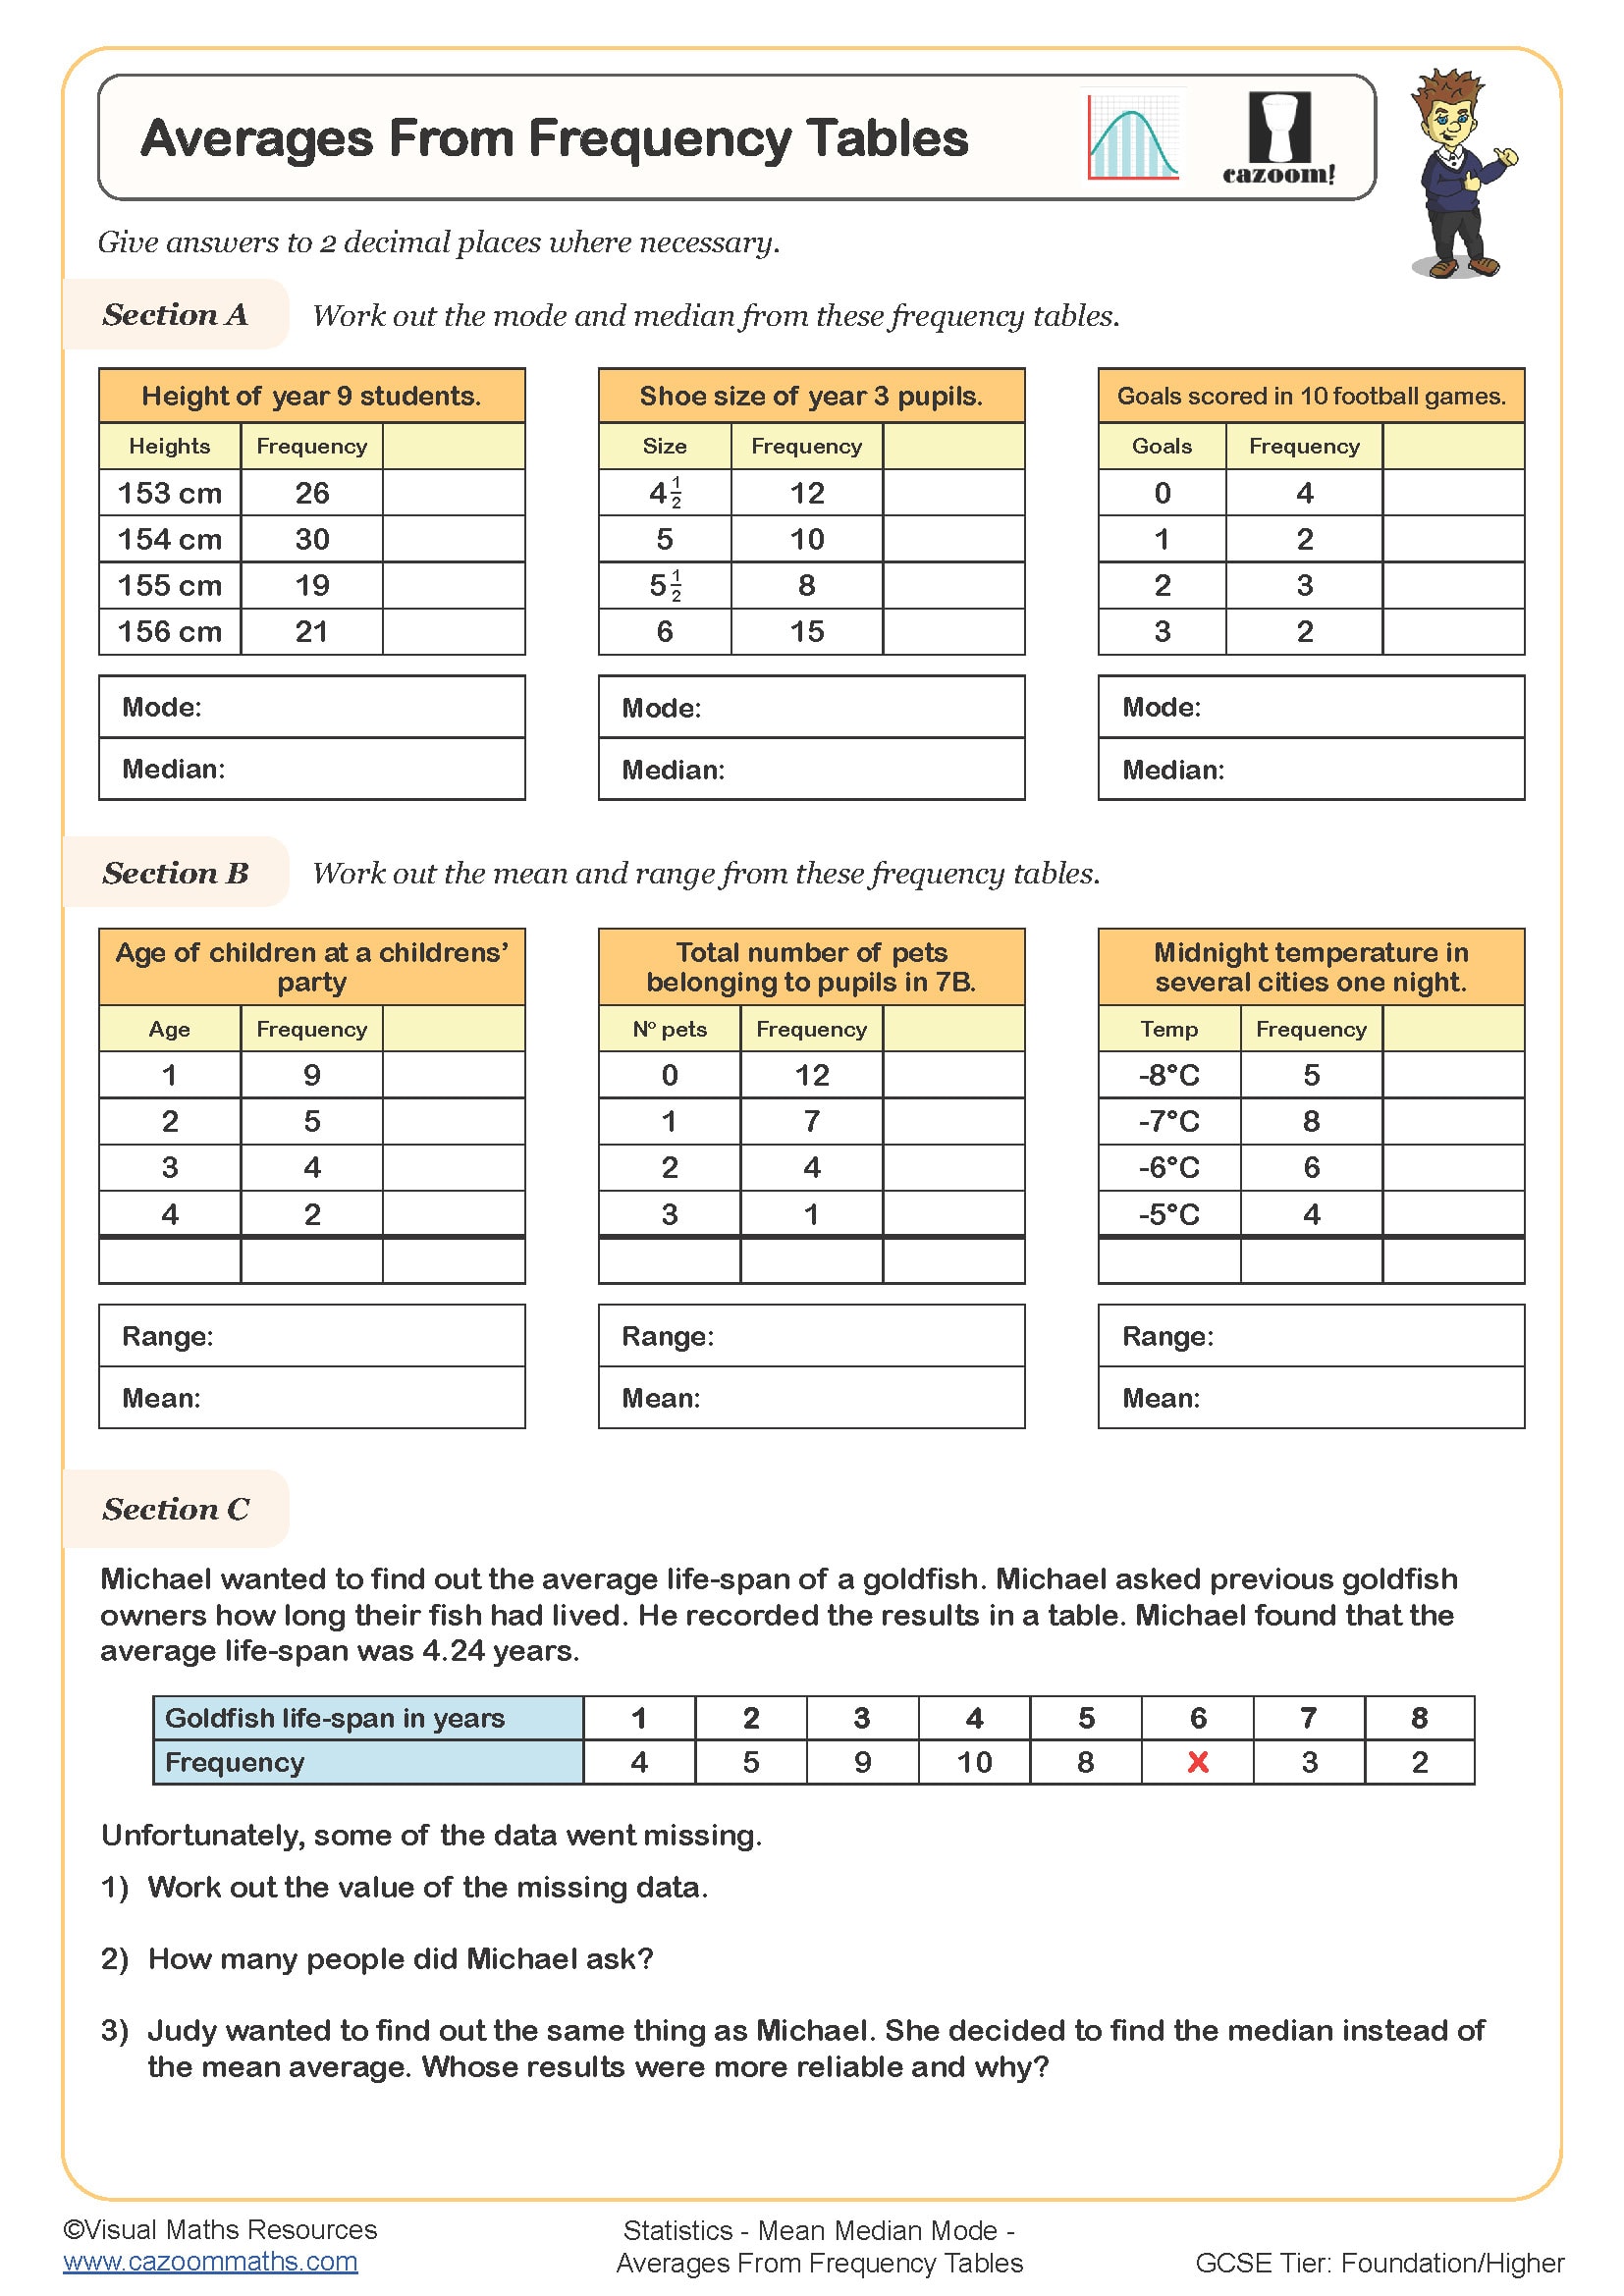
Averages from Frequency Tables
Year groups: 8, 9
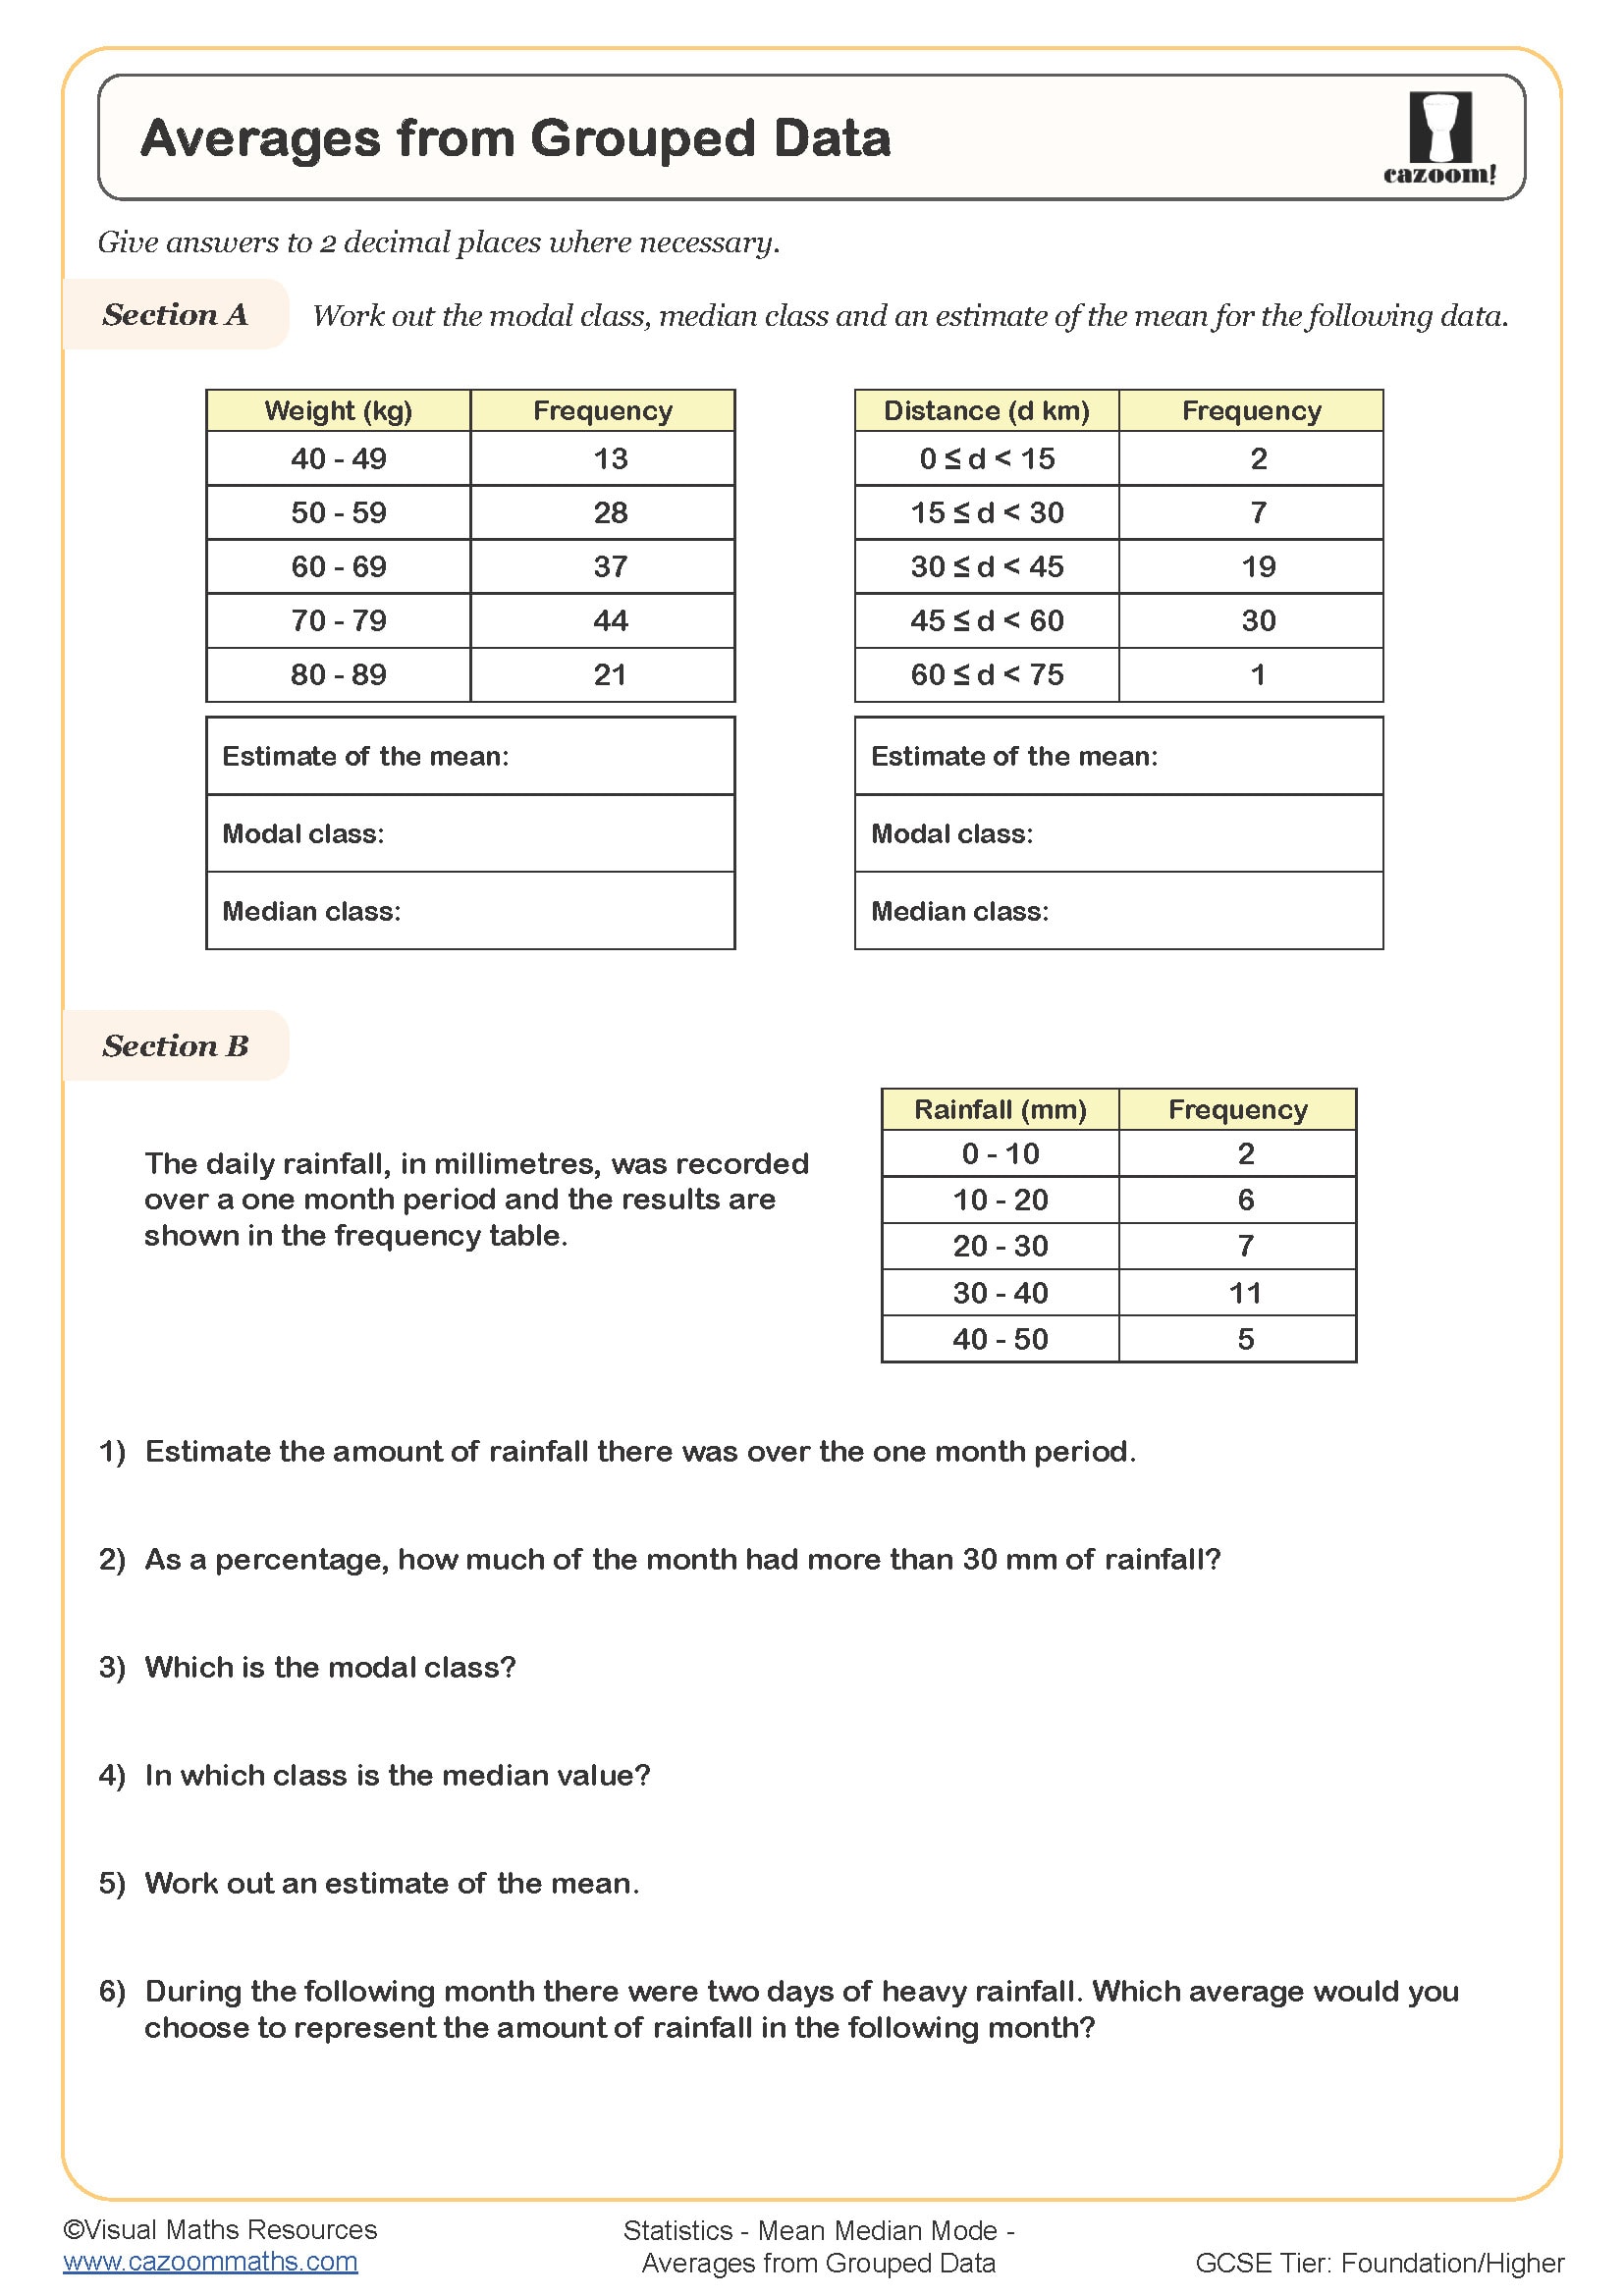
Averages from Grouped Data
Year groups: 8, 9
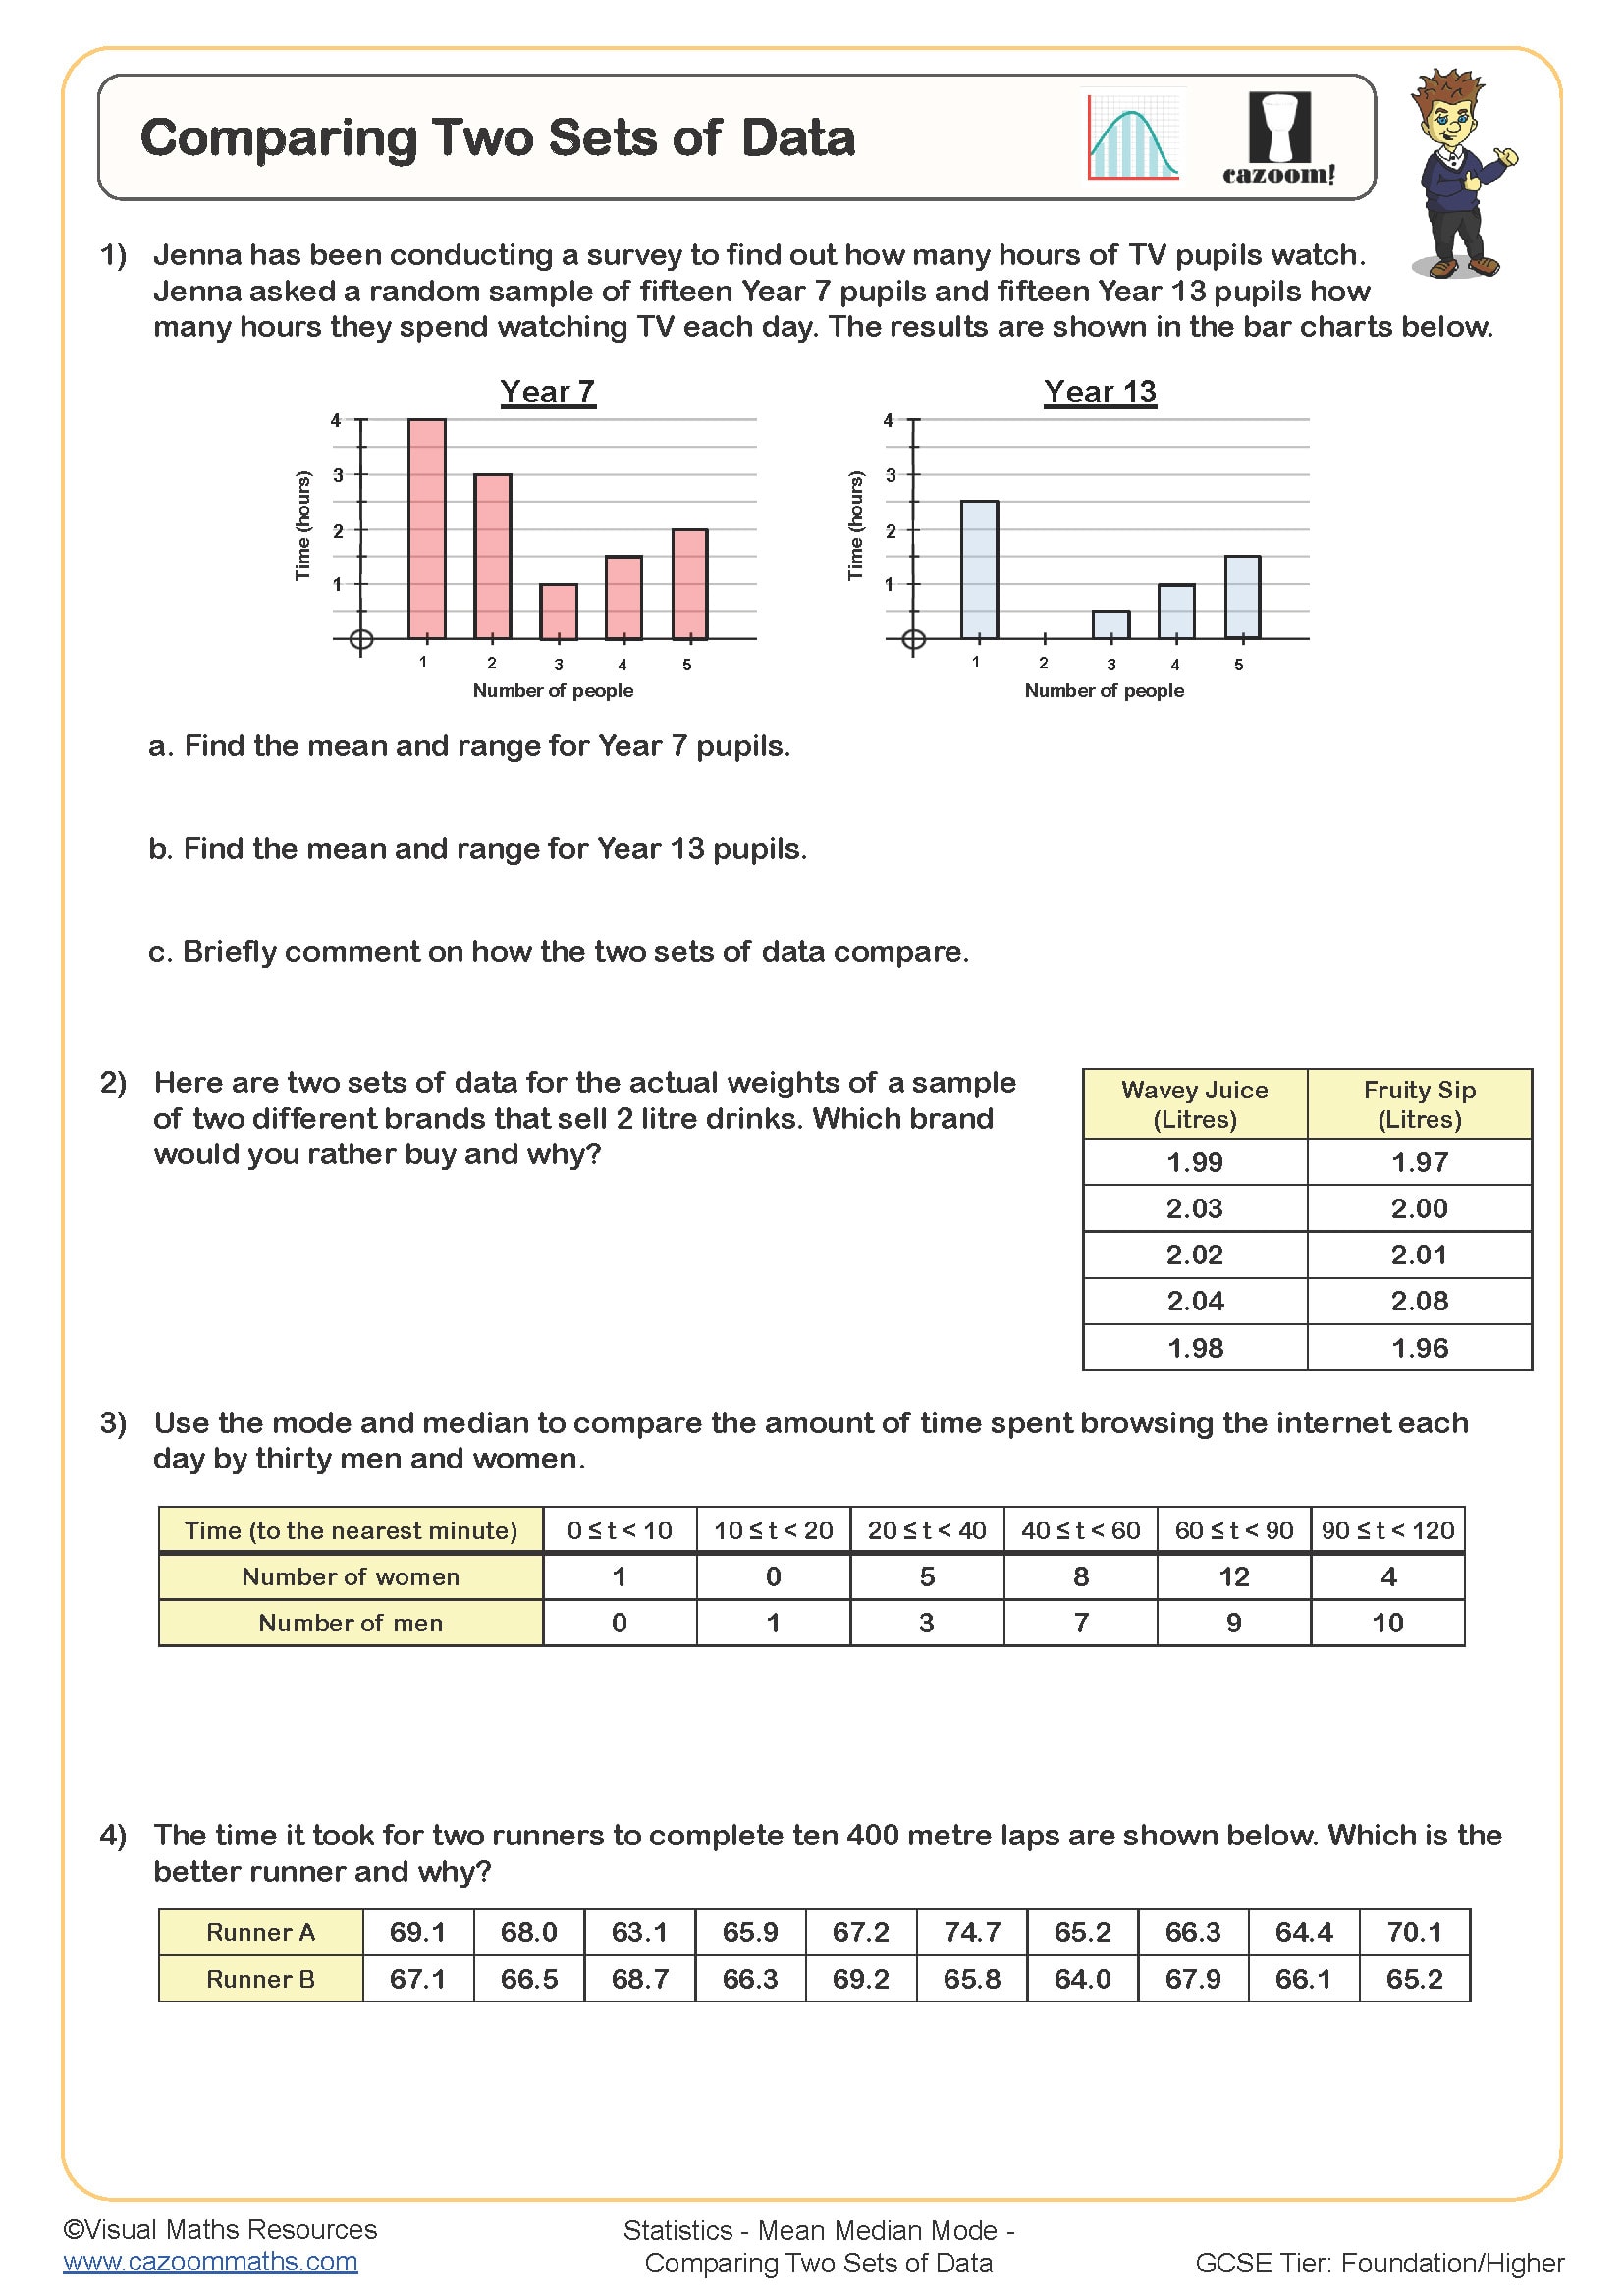
Comparing Two Sets of Data
Year groups: 8, 9
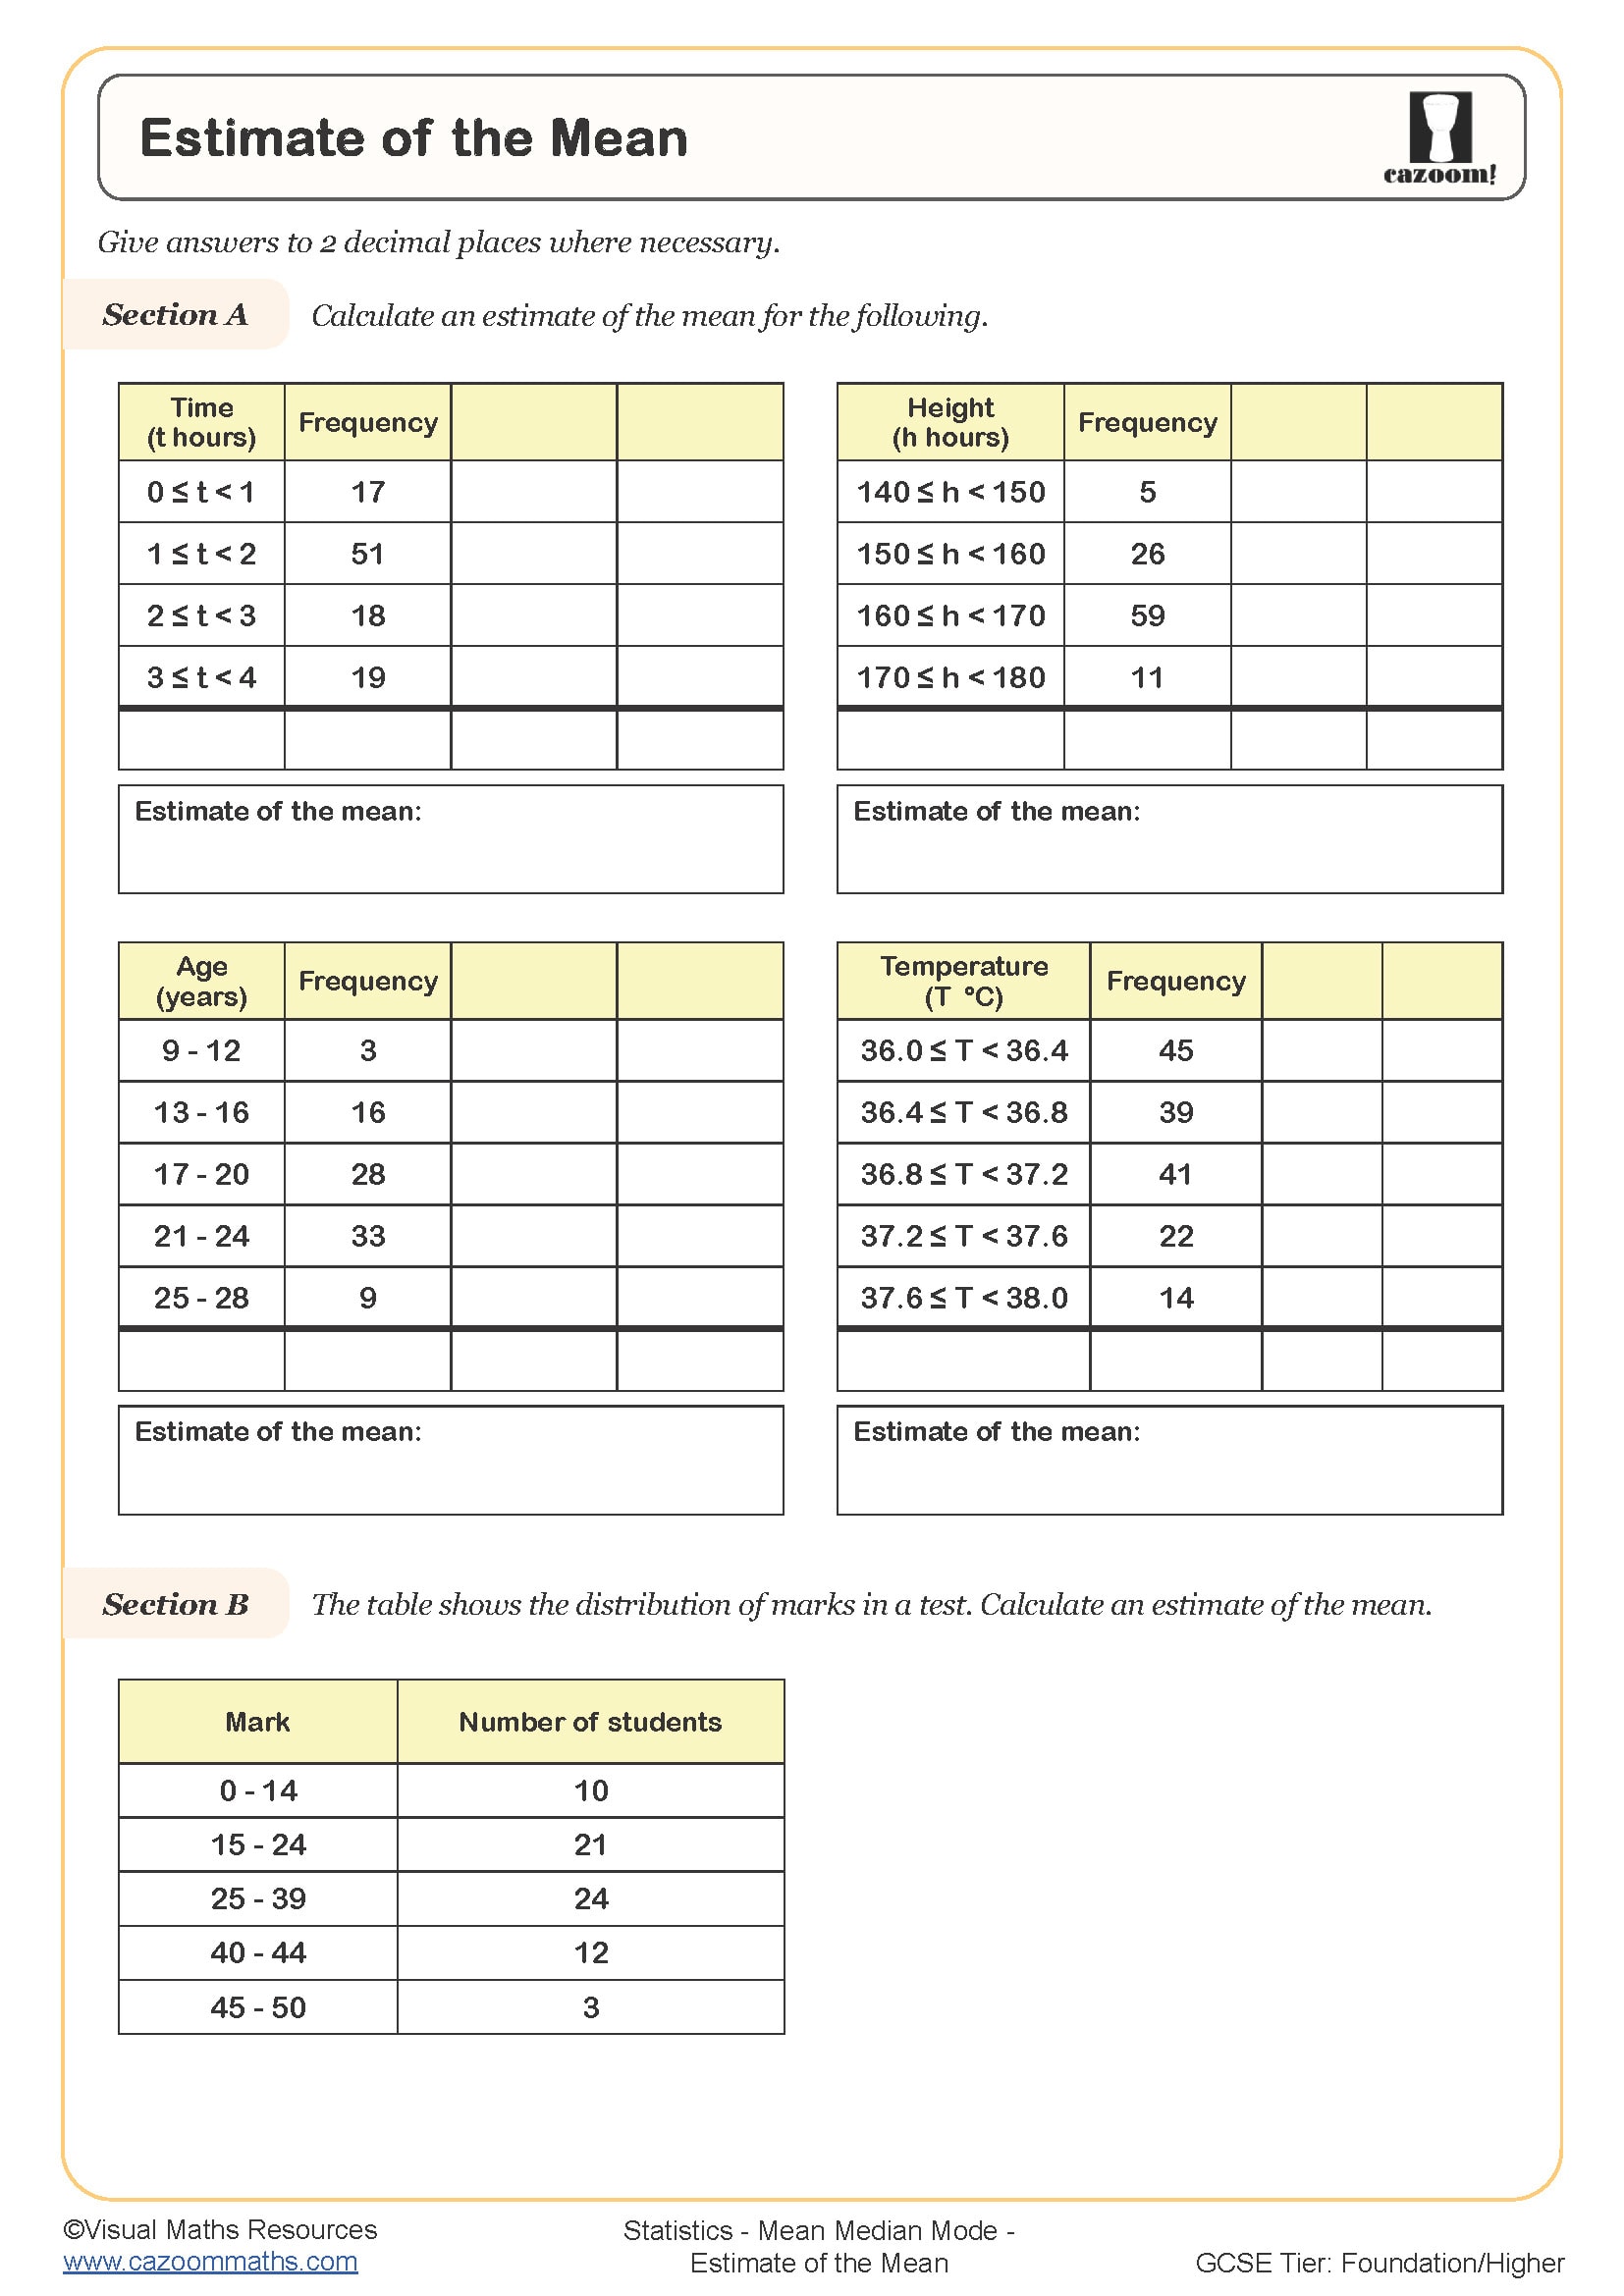
Estimate of the Mean
Year groups: 8, 9
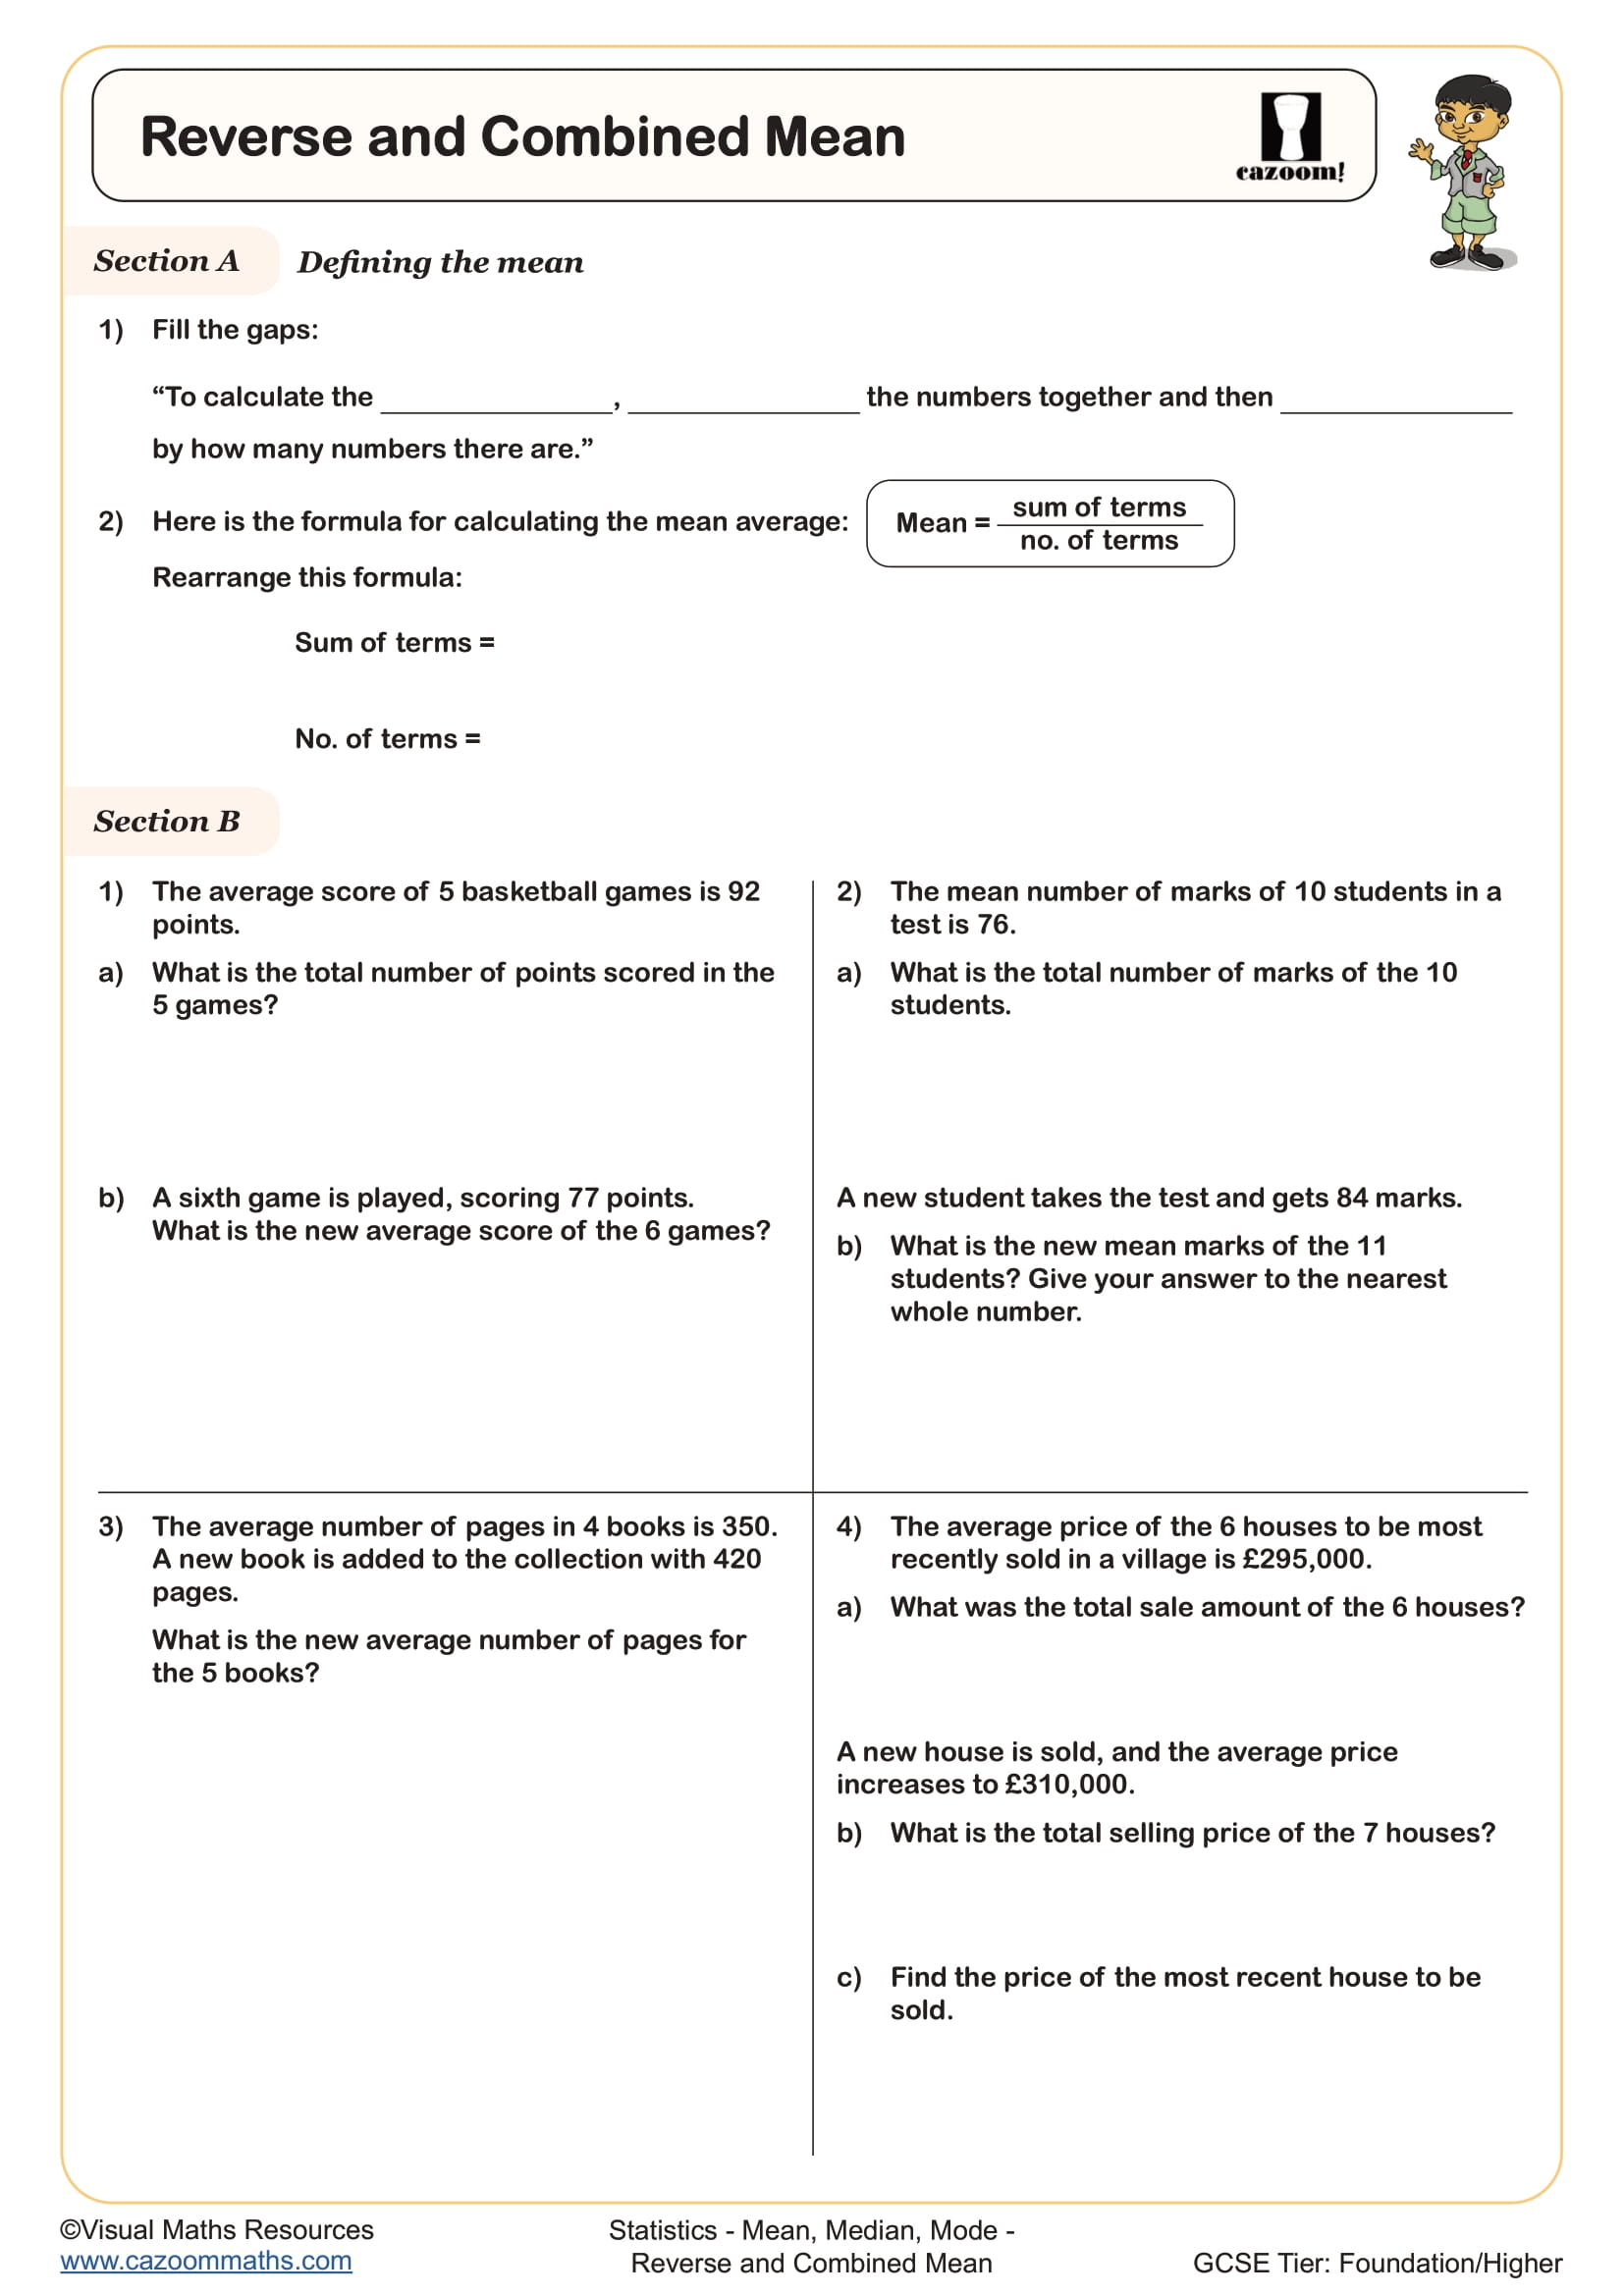
Reverse and Combined Mean
Year groups: 9, 10
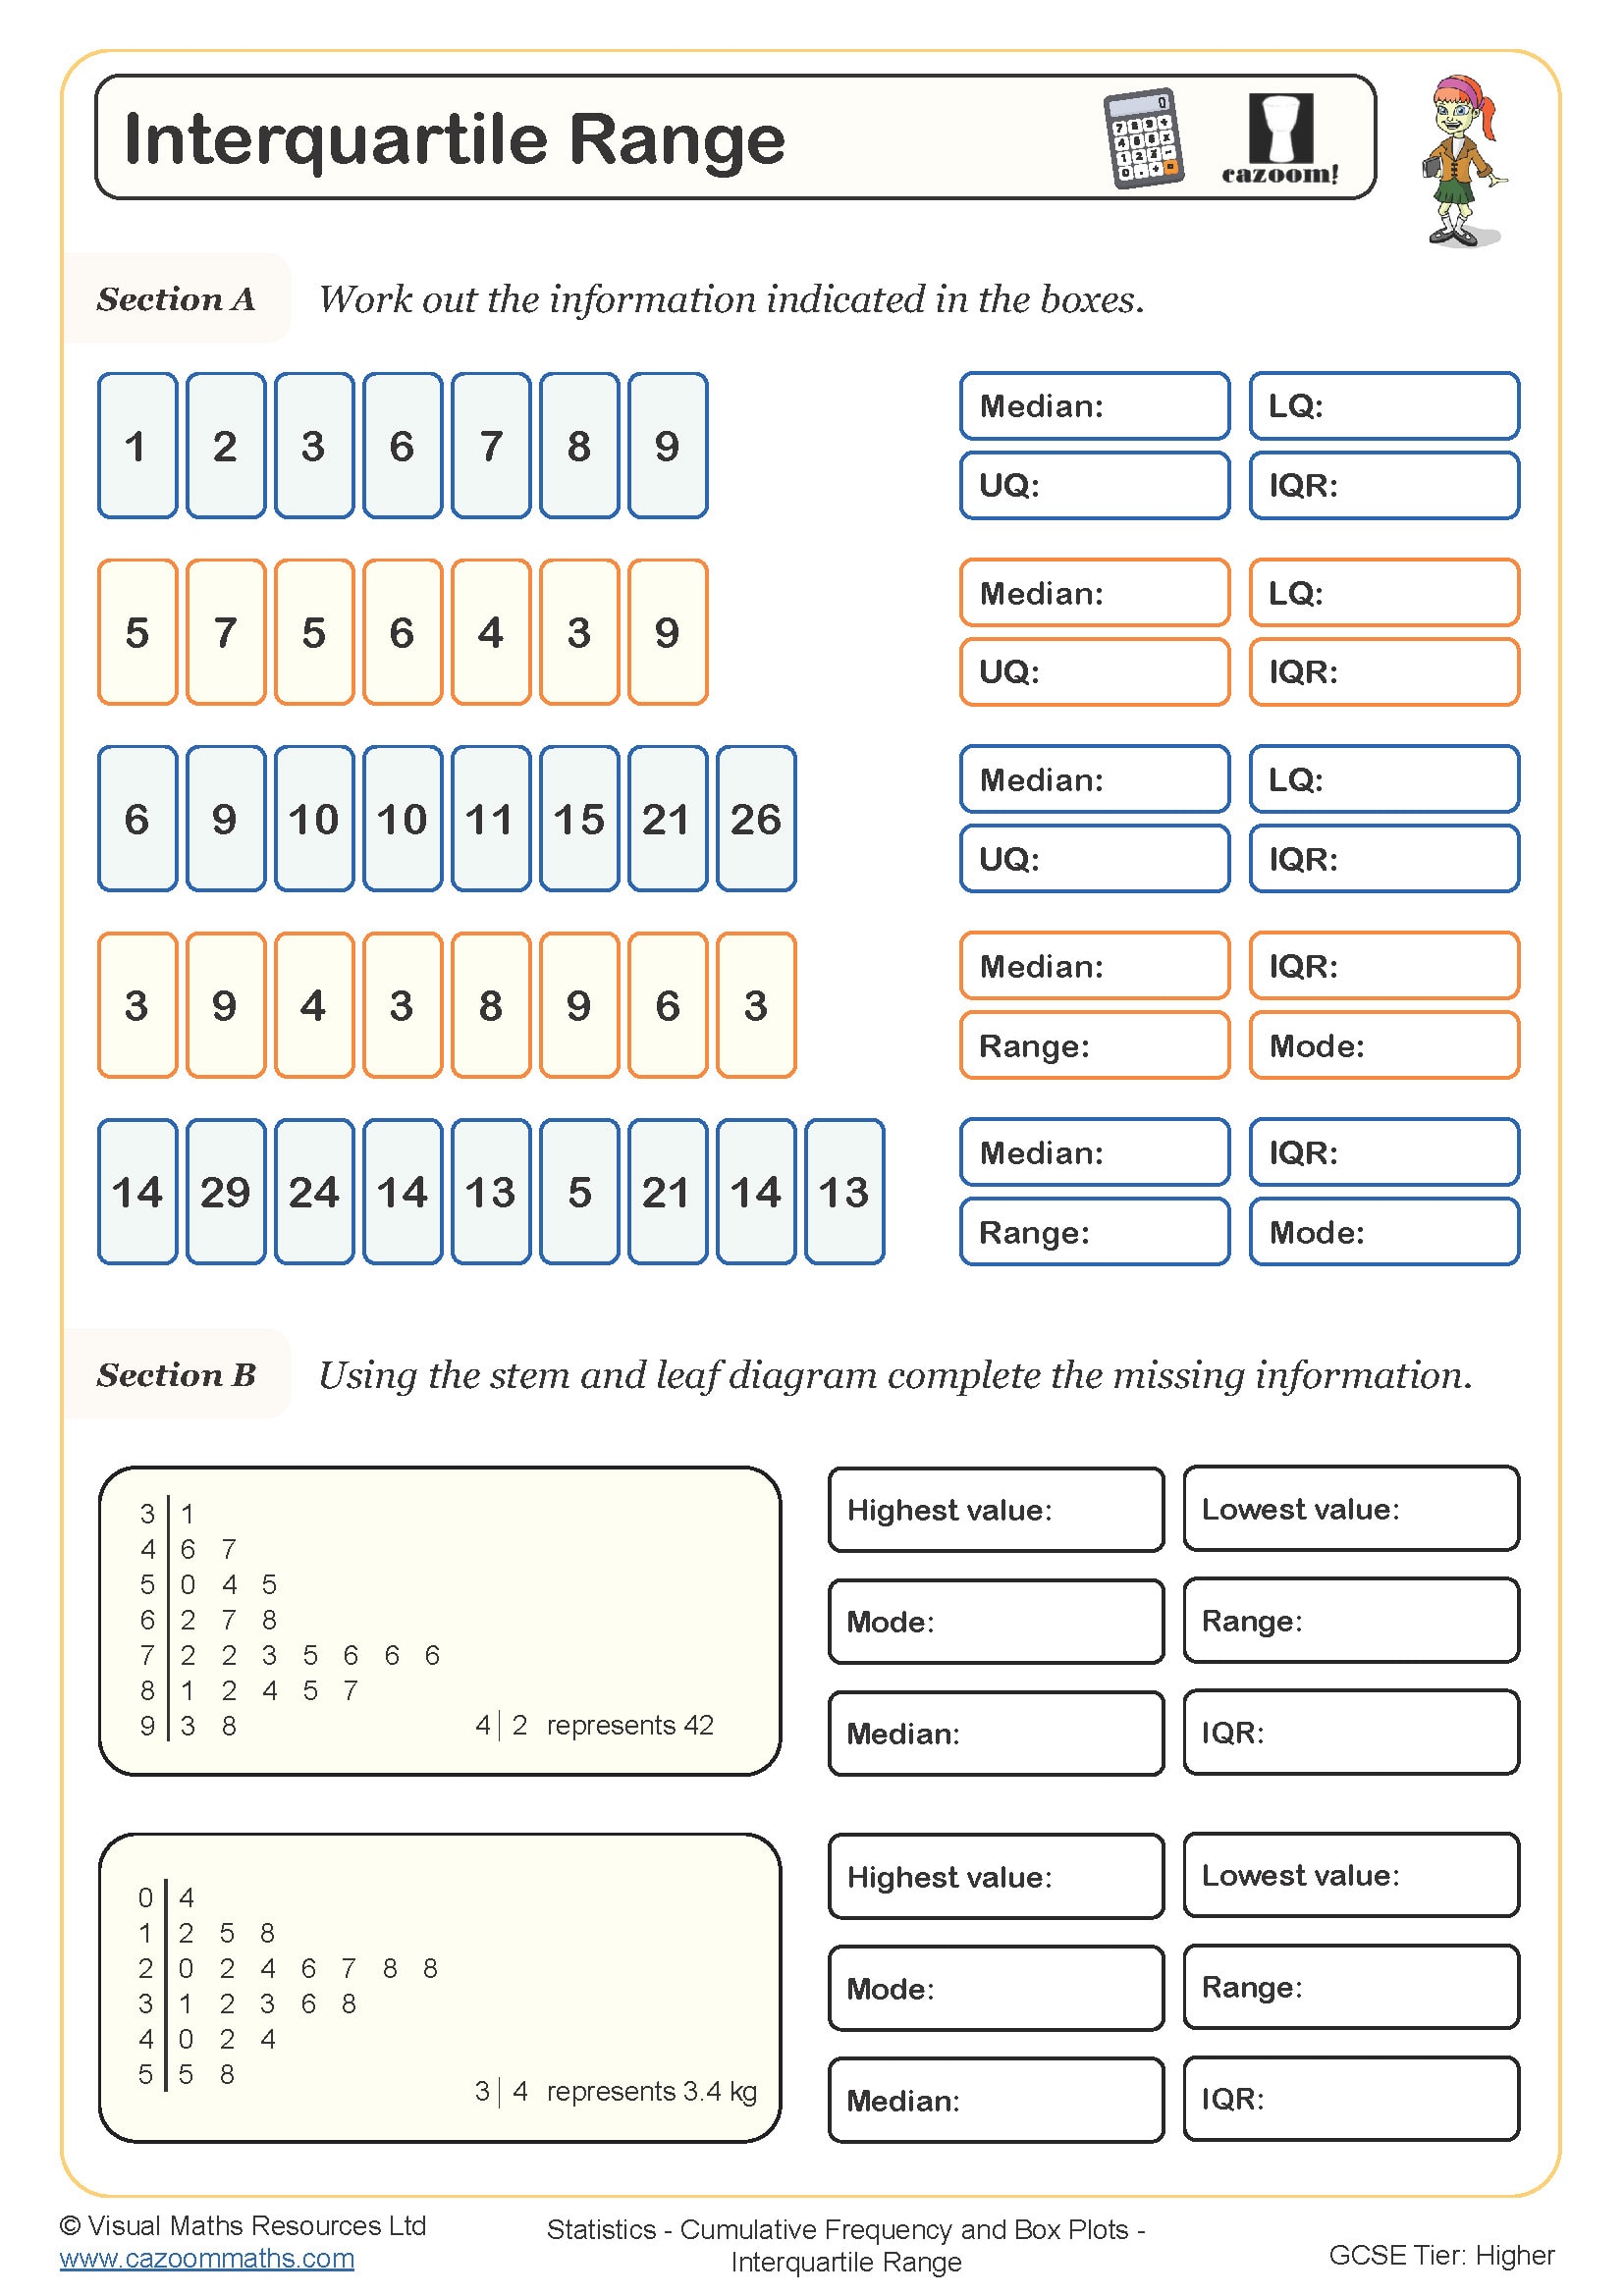
Interquartile Range
Year groups: 10, 11
All worksheets are created by the team of experienced teachers at Cazoom Maths.
Download KS3-KS4 Maths Worksheets: Averages and Range Collection with Instant Solutions
Statistical thinking develops when learners discover how each average reveals different information about their data. Initially, pupils treat mean, median, and mode as interchangeable rather than recognising their distinct purposes. These resources show how outliers distort the mean while leaving the median unchanged. Detailed examples enable students to tackle complex problems using direct solution techniques. Teachers use them to introduce concepts, set homework and provide targeted support. The sequence builds precision first, then develops reasoning methods essential for GCSE success. Download our ready-to-use printable statistics activities right away to make the whole learning process fun and engaging for your pupils!
Complete Topic Map: What Skills Do Secondary School Students Master?
What are Averages and Range?
Averages are different ways to find the typical or central value in a set of numbers—the mean (adding up and dividing), median (middle value), and mode (most common value). The range tells you how spread out the data is by measuring the gap between the highest and lowest values.
Cazoom Maths has a wide variety of secondary school Averages and Range activities. This activity collection develops statistical fluency through five complementary worksheets that progress from basic concepts to comparatively complex ones. The Mode and Range introduces categorical data analysis and spread measurement through accessible examples. The Median and Range builds ordering skills and helps pupils understand positional averages. Mean, Median, Mode, and Range (A) combines all three averages with simpler datasets, establishing calculation routines. Mean, Median, Mode, and Range (B) increases complexity with decimal values and larger datasets.
How These Averages and Range Worksheets Build Mathematical Confidence
Visual representations help pupils see data patterns before calculating. Bar charts and tables scaffold the transition from counting to abstract thinking. Teachers introduce concepts through structured examples, then select worksheets based on readiness. The progression from mode through median to mean follows natural cognitive development. Paired work on choosing appropriate averages generates rich mathematical discussion. By connecting calculations to real scenarios like sports statistics, pupils see mathematics as a practical tool. This transforms statistical work from rote calculation into genuine data analysis.
From Weather Patterns to Market Research: Where These Skills Appear
Statistical measures shape decisions across every field requiring data analysis. Weather forecasters use mean temperatures to identify climate trends while considering the range to predict extreme conditions. Medical researchers rely on these tools to evaluate treatment effectiveness and identify unusual results that warrant investigation.
•Engineers use mean and range for quality control
•Sports analysts evaluate performance through averages
•Scientists track median pollution levels
•Market researchers identify modes in consumer data