Frequency Tables and Diagrams Worksheets
All worksheets are created by the team of experienced teachers at Cazoom Maths.
Download Statistics Resources: Frequency Tables and Diagrams Collection with Instant Solutions.
Your Key Stage 3 and Key Stage 4 students might struggle with two-way tables because they must read information in both the horizontal and vertical directions. Along with that, executing proper mathematical calculations. Your young students will understand the solution when they learn that organized tables reveal relationships between data points that single data points cannot. The resources demonstrate step-by-step methods for filling missing table cells using row and column totals, while providing detailed scaffolding to reveal the calculation process. The resources help students prepare for tests through targeted practice of statistical representation and support homework completion with detailed solutions for parents, and address specific calculation deficits in intervention sessions.
Curriculum Coverage: What Skills Do Your Secondary School Students Master?
Frequency tables show how often each piece of data appears by organising information into simple lists. On the other hand, Diagrams (like bar charts or pictograms) turn that data into easy-to-read visuals so students can spot patterns quickly.
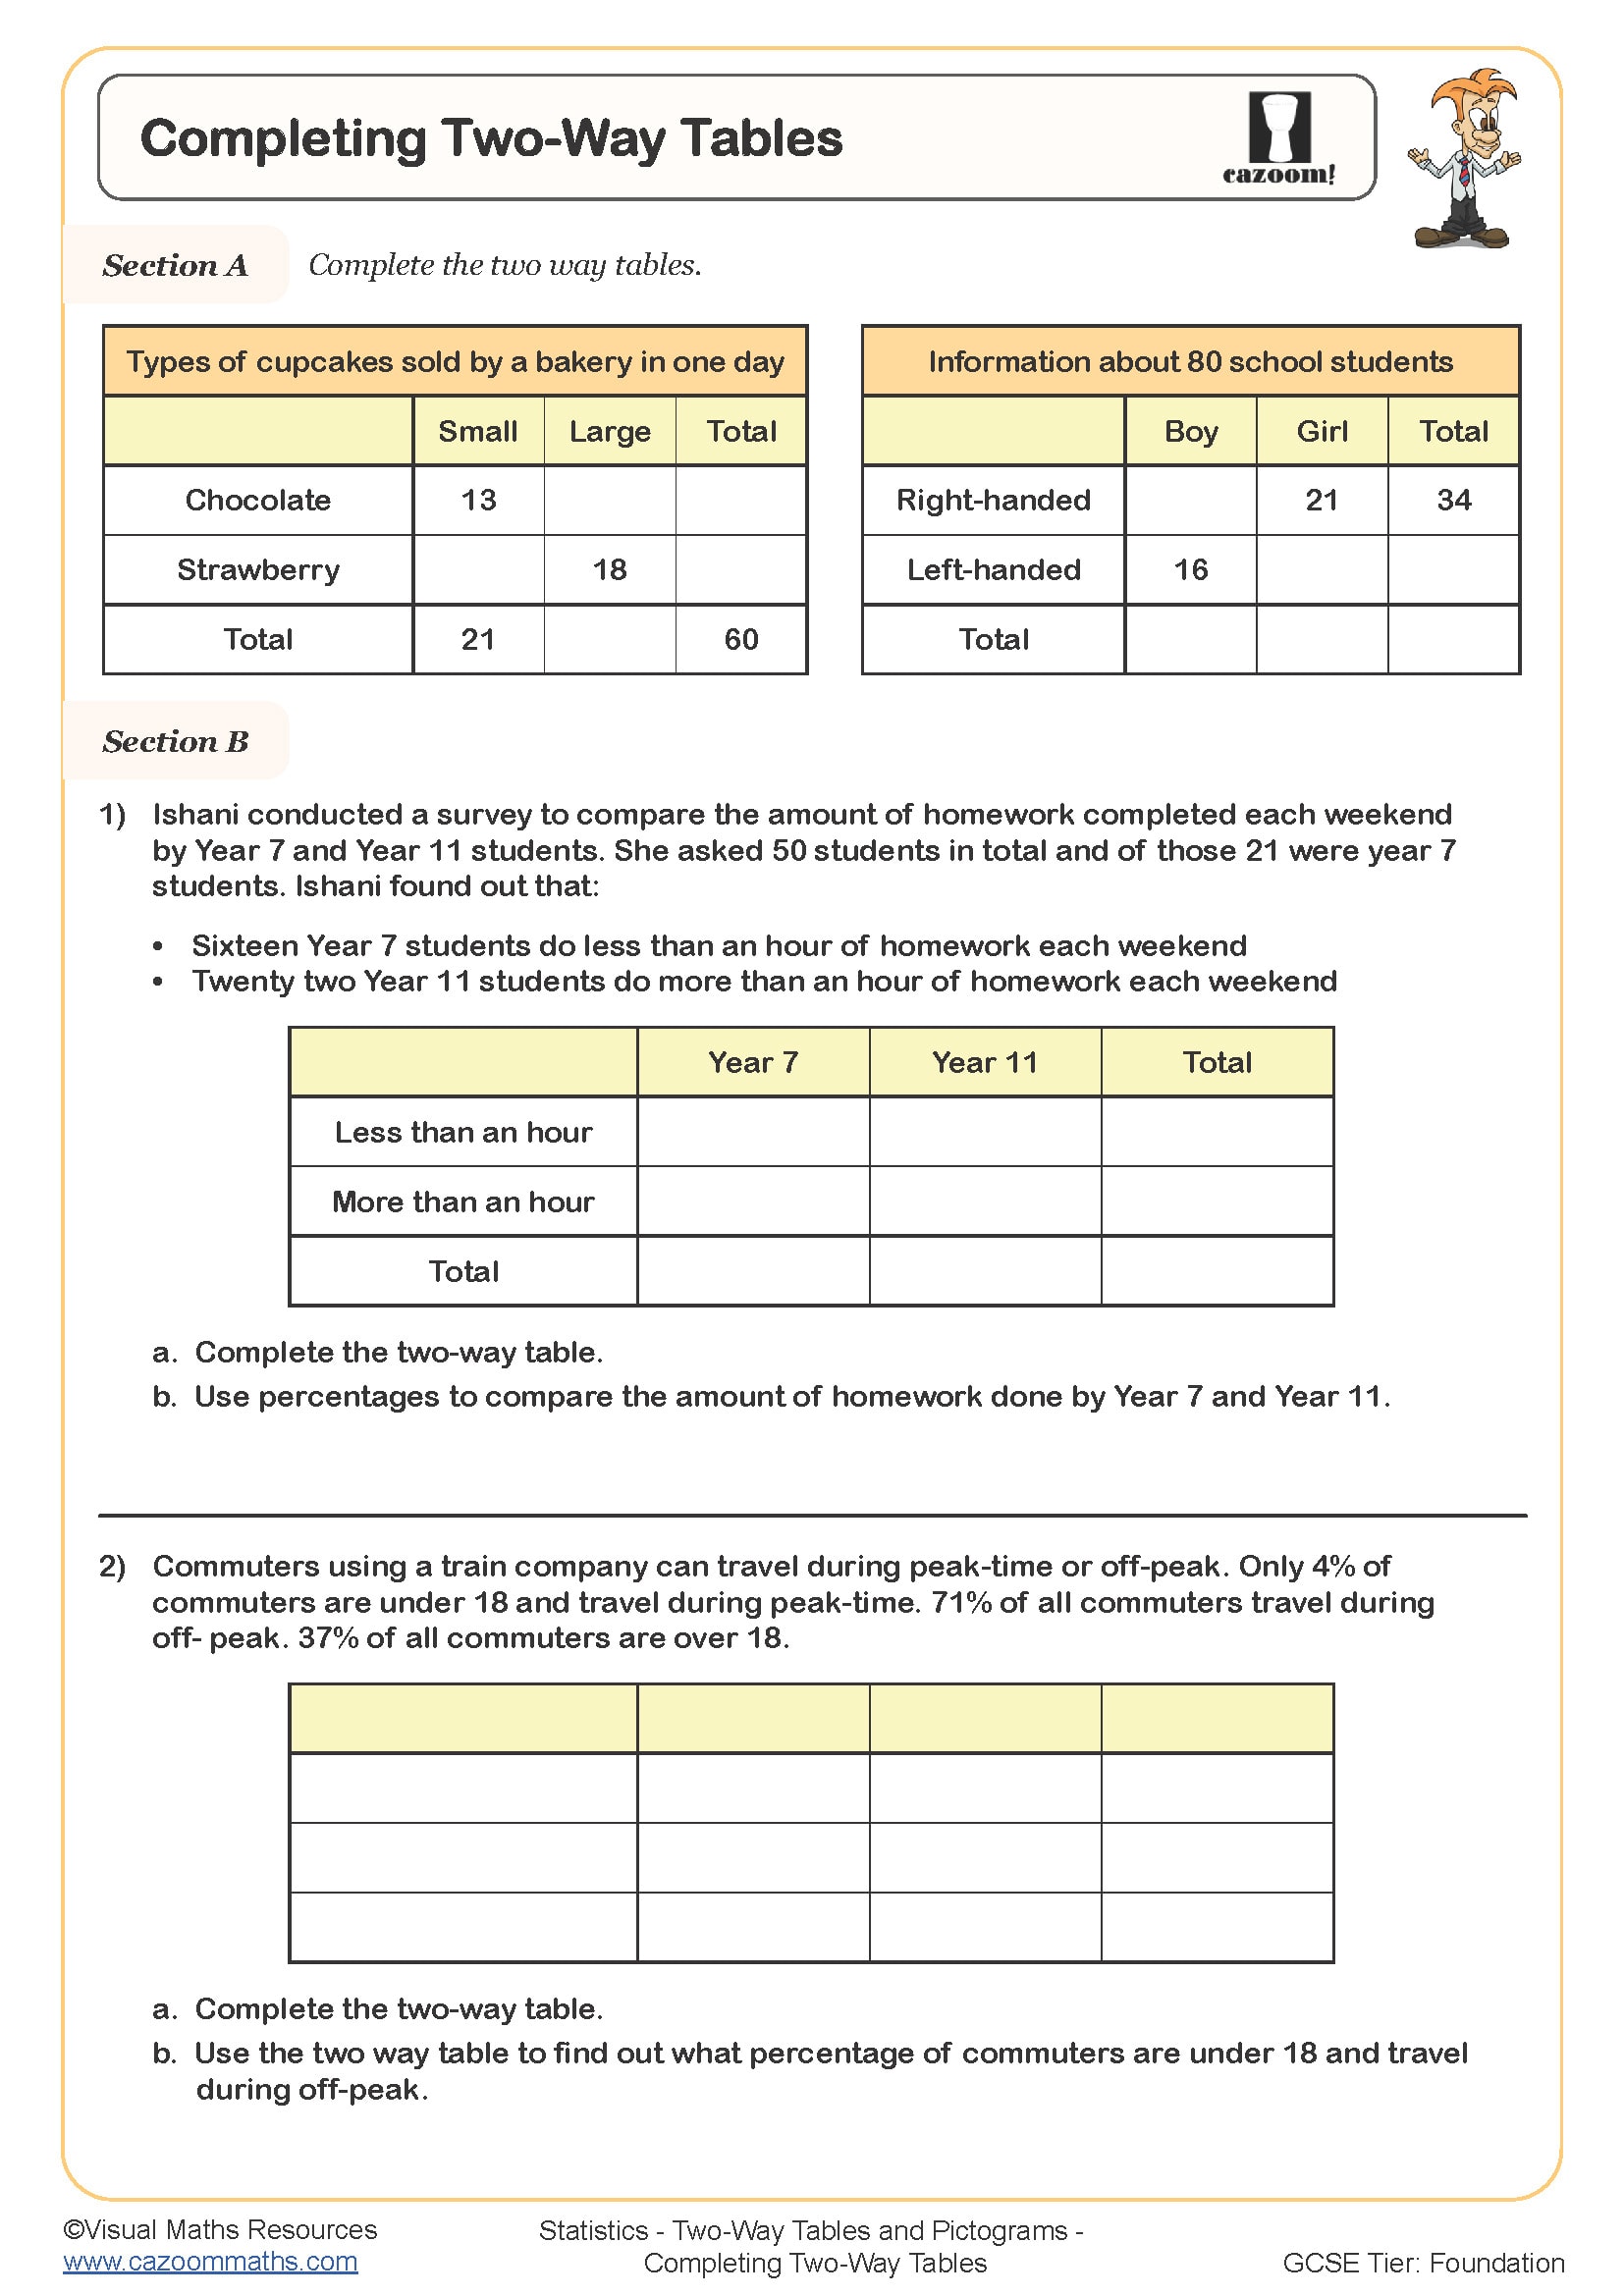
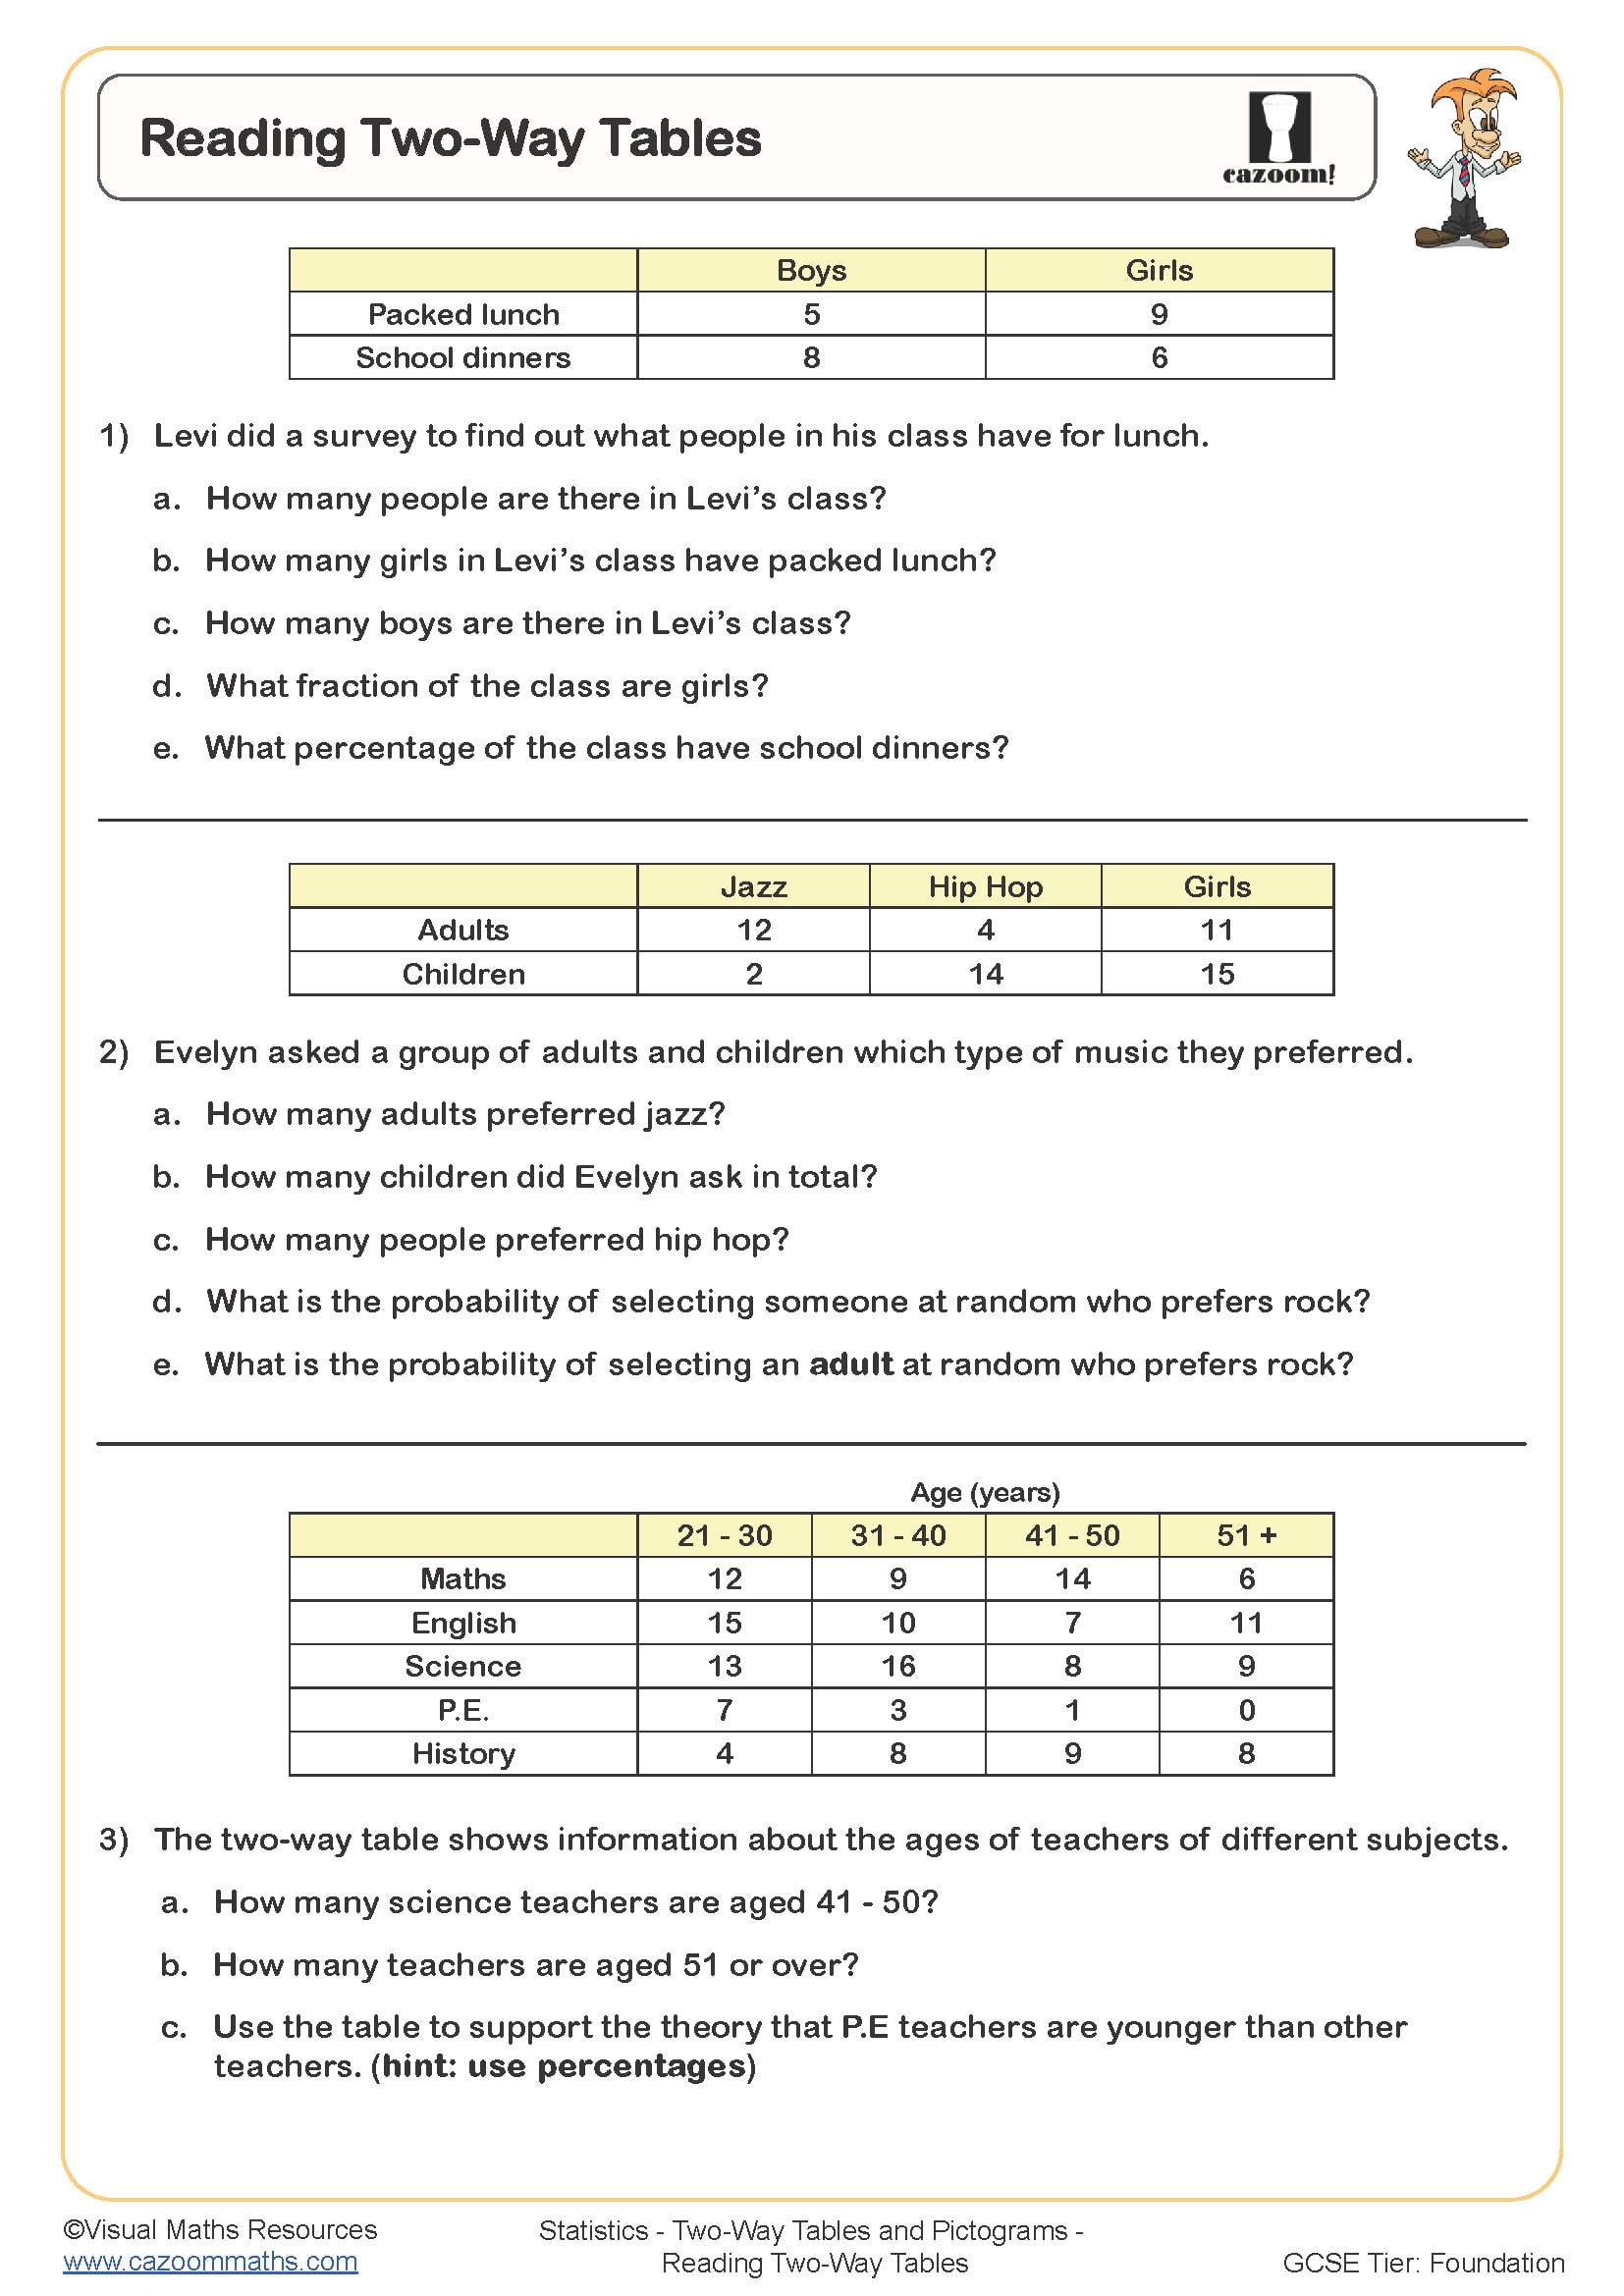
The Cazoom Maths team of UK curriculum experts has created a variety of statistical activity collections that build understanding through three carefully sequenced worksheets. Completing Two-way Tables develops the foundational skill of using given totals to calculate missing frequency values and establishes with students extracting specific values and comparing the arithmetic relationships between cells, rows, and columns. Two-Way Tables extends this by asking pupils to construct complete tables from described data sets, requiring them to organise information systematically before filling cells. Reading Two-way Tables focuses on interpretation, having students extract specific values and compare frequencies across categories to answer written questions. Together, they take pupils from mechanical calculation through construction to analytical reading, ensuring they can both create and interrogate statistical tables with confidence.
Why Teachers Choose Cazoom Maths Key Stage 3 and Key Stage 4 Frequency Tables Resources
The Cazoom Maths statistical resources include visual clarity through well-structured tables to help your secondary school pupils see mathematical relationships that feel abstract when described verbally. Teachers can use the worksheets during starter activities to recap previous learning, in paired work where students explain their reasoning to partners, or as a targeted intervention for pupils who struggle with data handling questions. The gradual, methodical progression from completing existing tables to constructing new ones mirrors the scaffolding approach that supports effective mixed-ability teaching. Worked solutions provide models that pupils can study independently. That way, these resources are valuable for revision lessons before assessments or homework tasks where immediate teacher support isn't available. This combination of structured practice and accessible examples builds the procedural fluency students need whilst developing their capacity to reason about data patterns and make justified interpretations.
From Survey Analysis to Market Research: Where These Skills Appear
Understanding frequency tables underpins how we make sense of categorical data across education, business, and scientific research. For example-
•Healthcare teams track patient outcomes across treatment groups
•Engineers monitor product defects by type and shift
•Social scientists compare survey responses across demographics
•Researchers record species observations across habitats