Line Graphs Worksheets
All worksheets are created by the team of experienced teachers at Cazoom Maths.
Finding Statistics Hard? See How Our Printable Line Graph Activities Break It Down
Your secondary school pupils often find line graphs challenging because they must coordinate multiple skills simultaneously, for example, selecting appropriate scales, plotting points precisely, and drawing smooth connections that represent continuous change. The breakthrough happens only when they recognise that the line itself tells a story about how one quantity responds to another. Cazoom Maths Line Graphs resources provide worked examples demonstrating scale selection and accurate plotting techniques, alongside step-by-step scaffolding that makes graph interpretation explicit. Instant solutions allow teachers to model reading strategies during whole-class instruction whilst giving pupils immediate feedback during independent work. Our fun and engaging statistics activity collection supports classwork introducing graphical representation, homework requiring clear visual models for parental understanding, and revision sessions targeting exam-style questions about trends and predictions.
From Line Graphs to Time Series: What Skills Do Your KS3-KS4 Students Master?
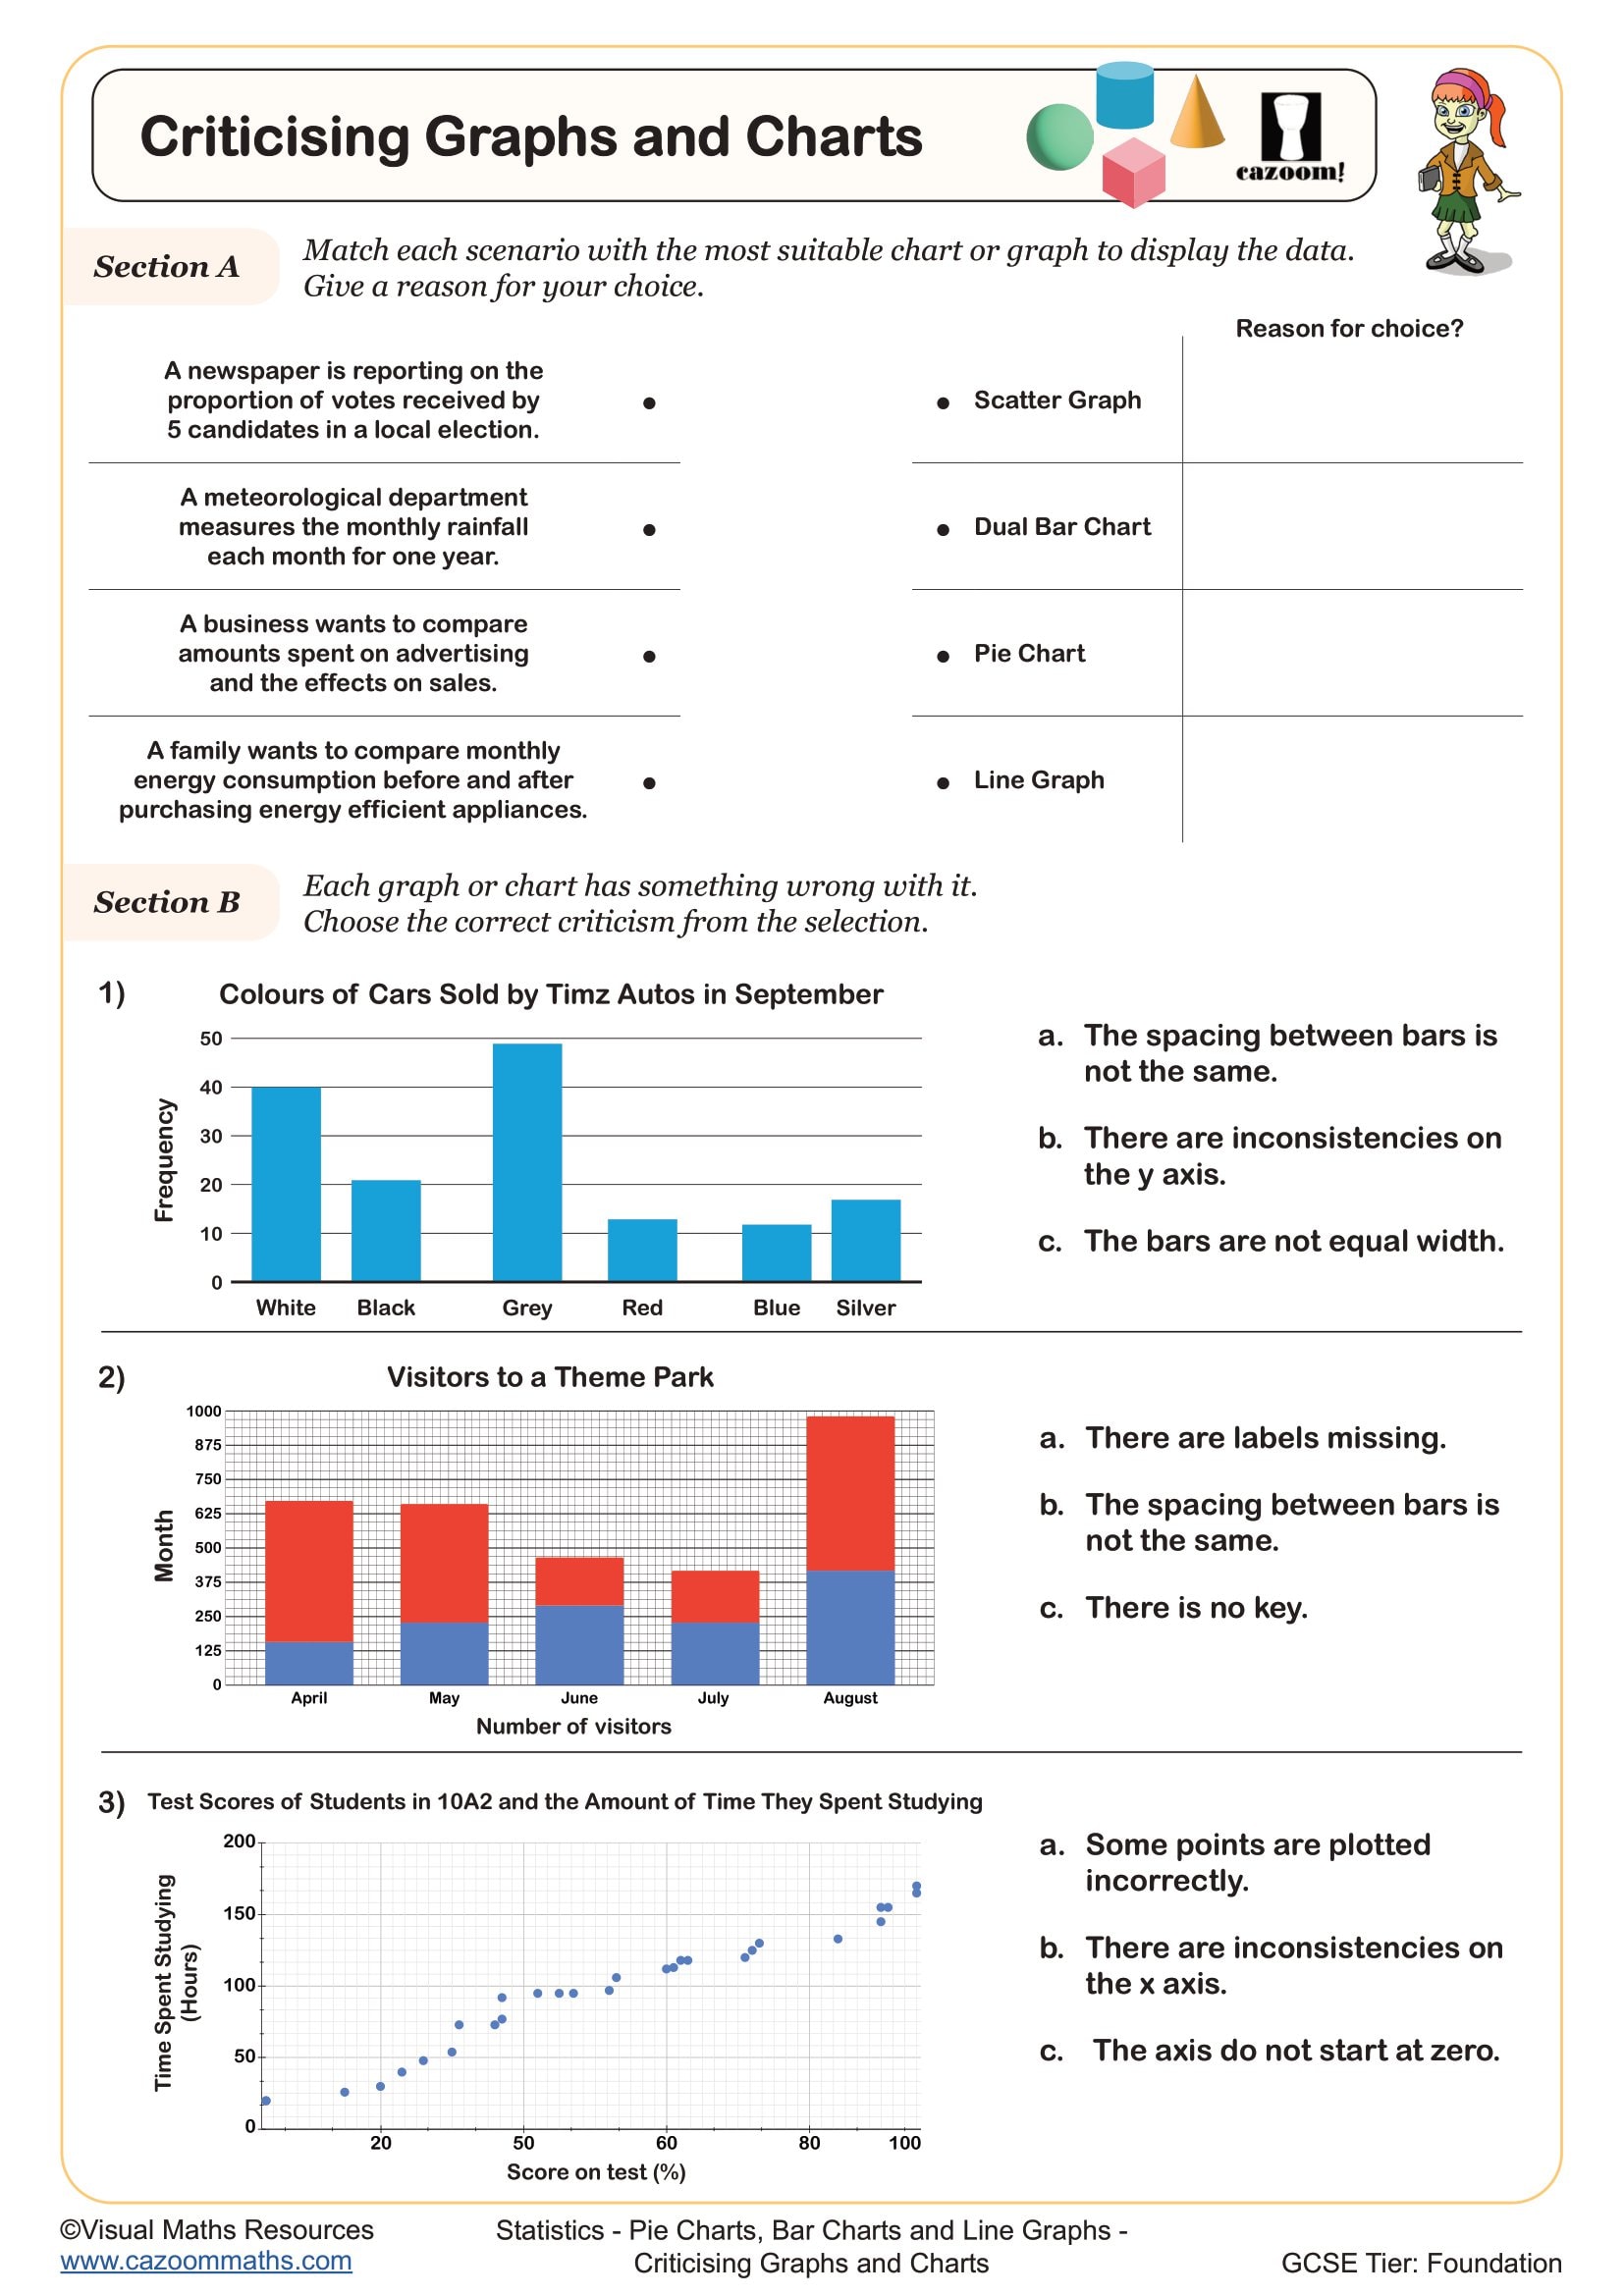
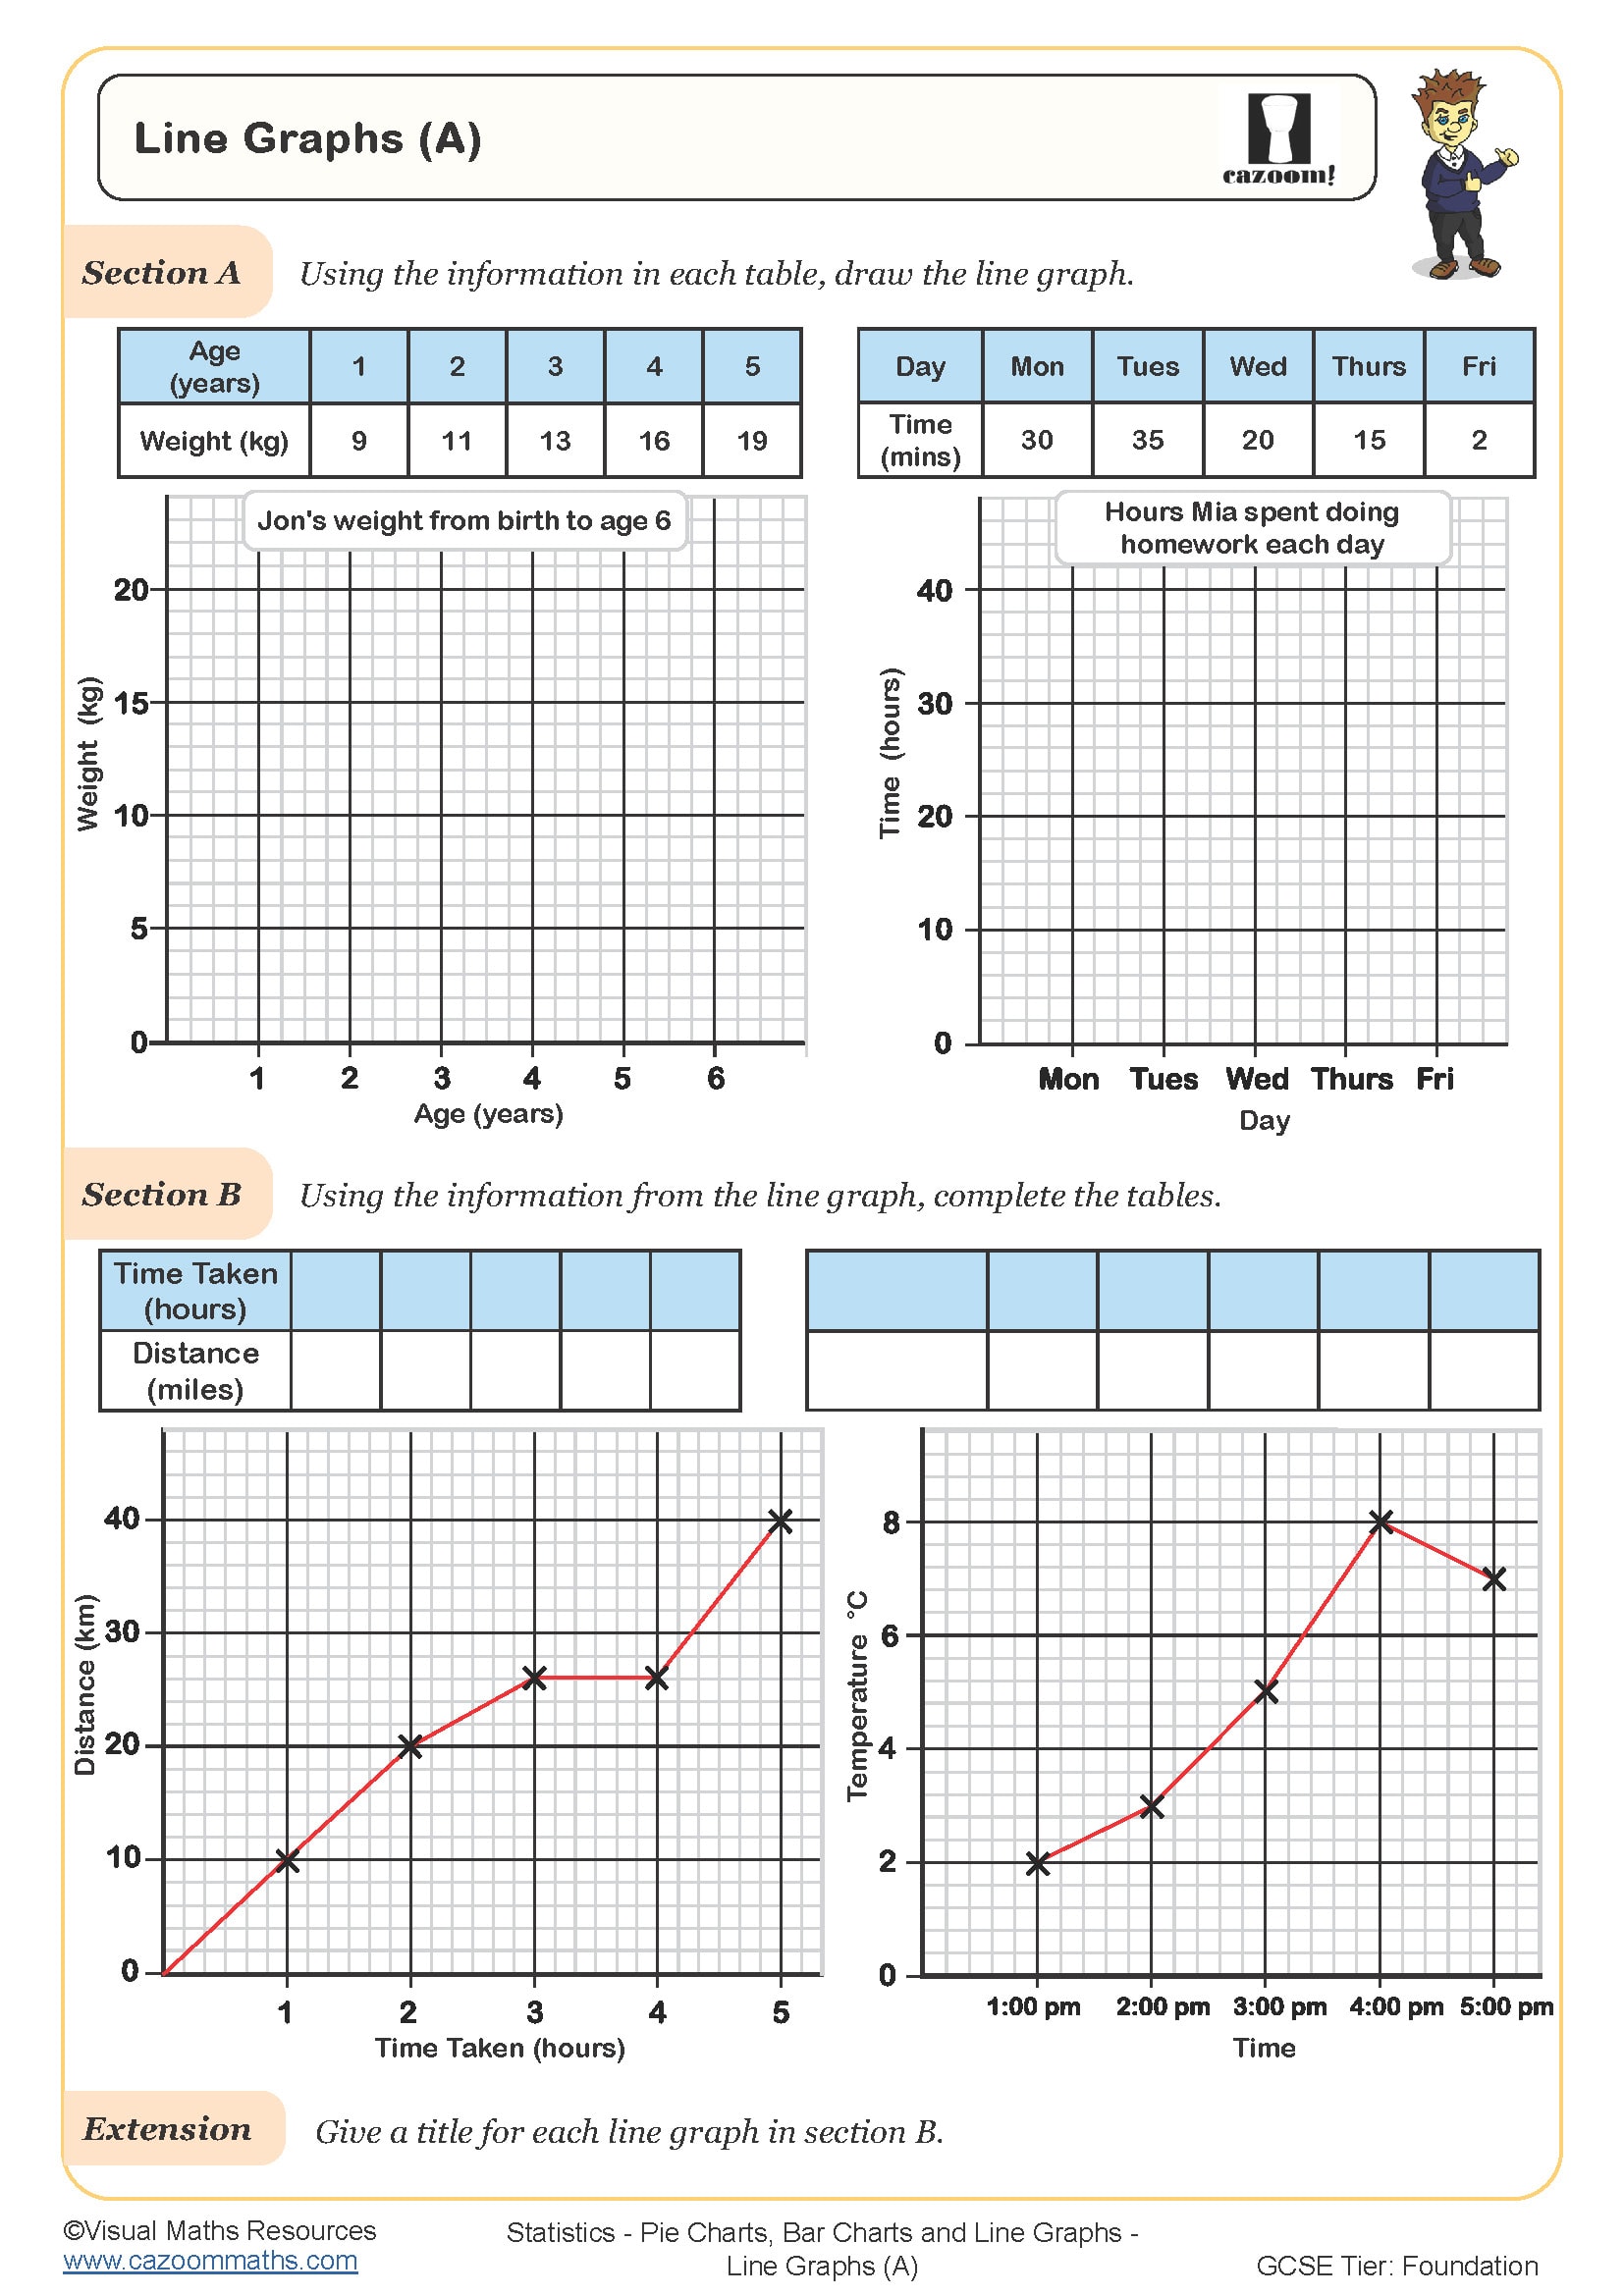
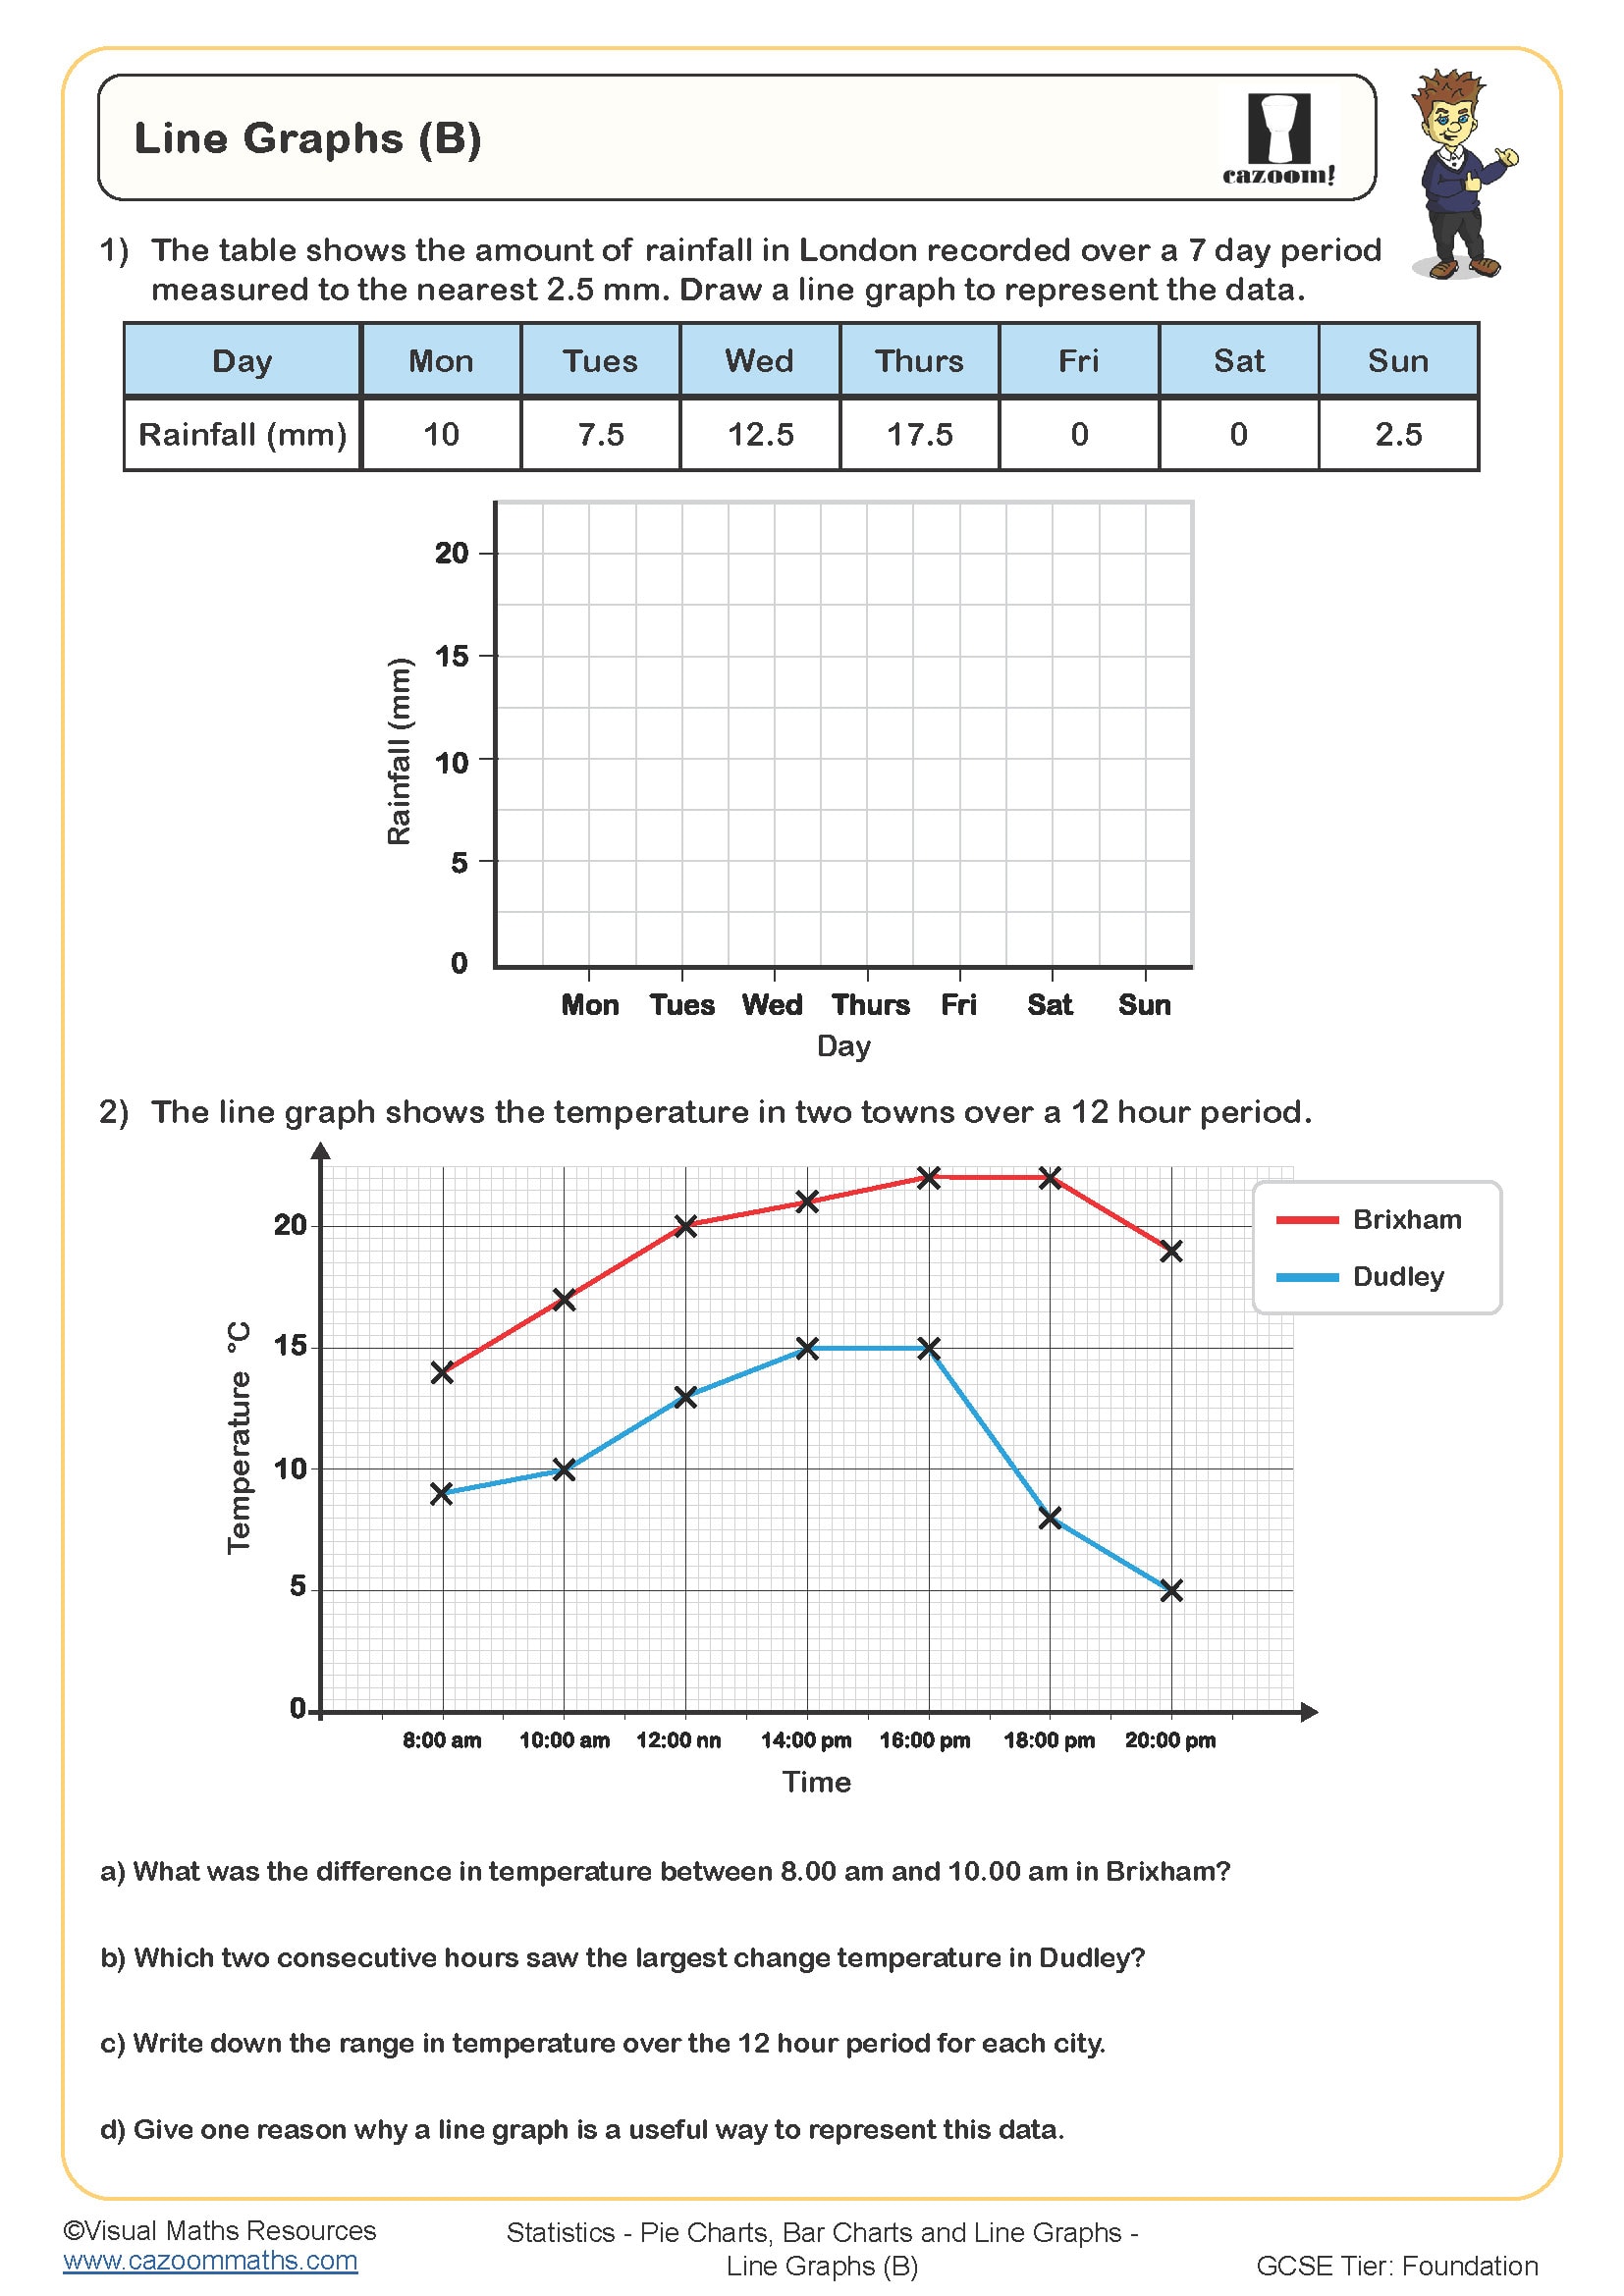
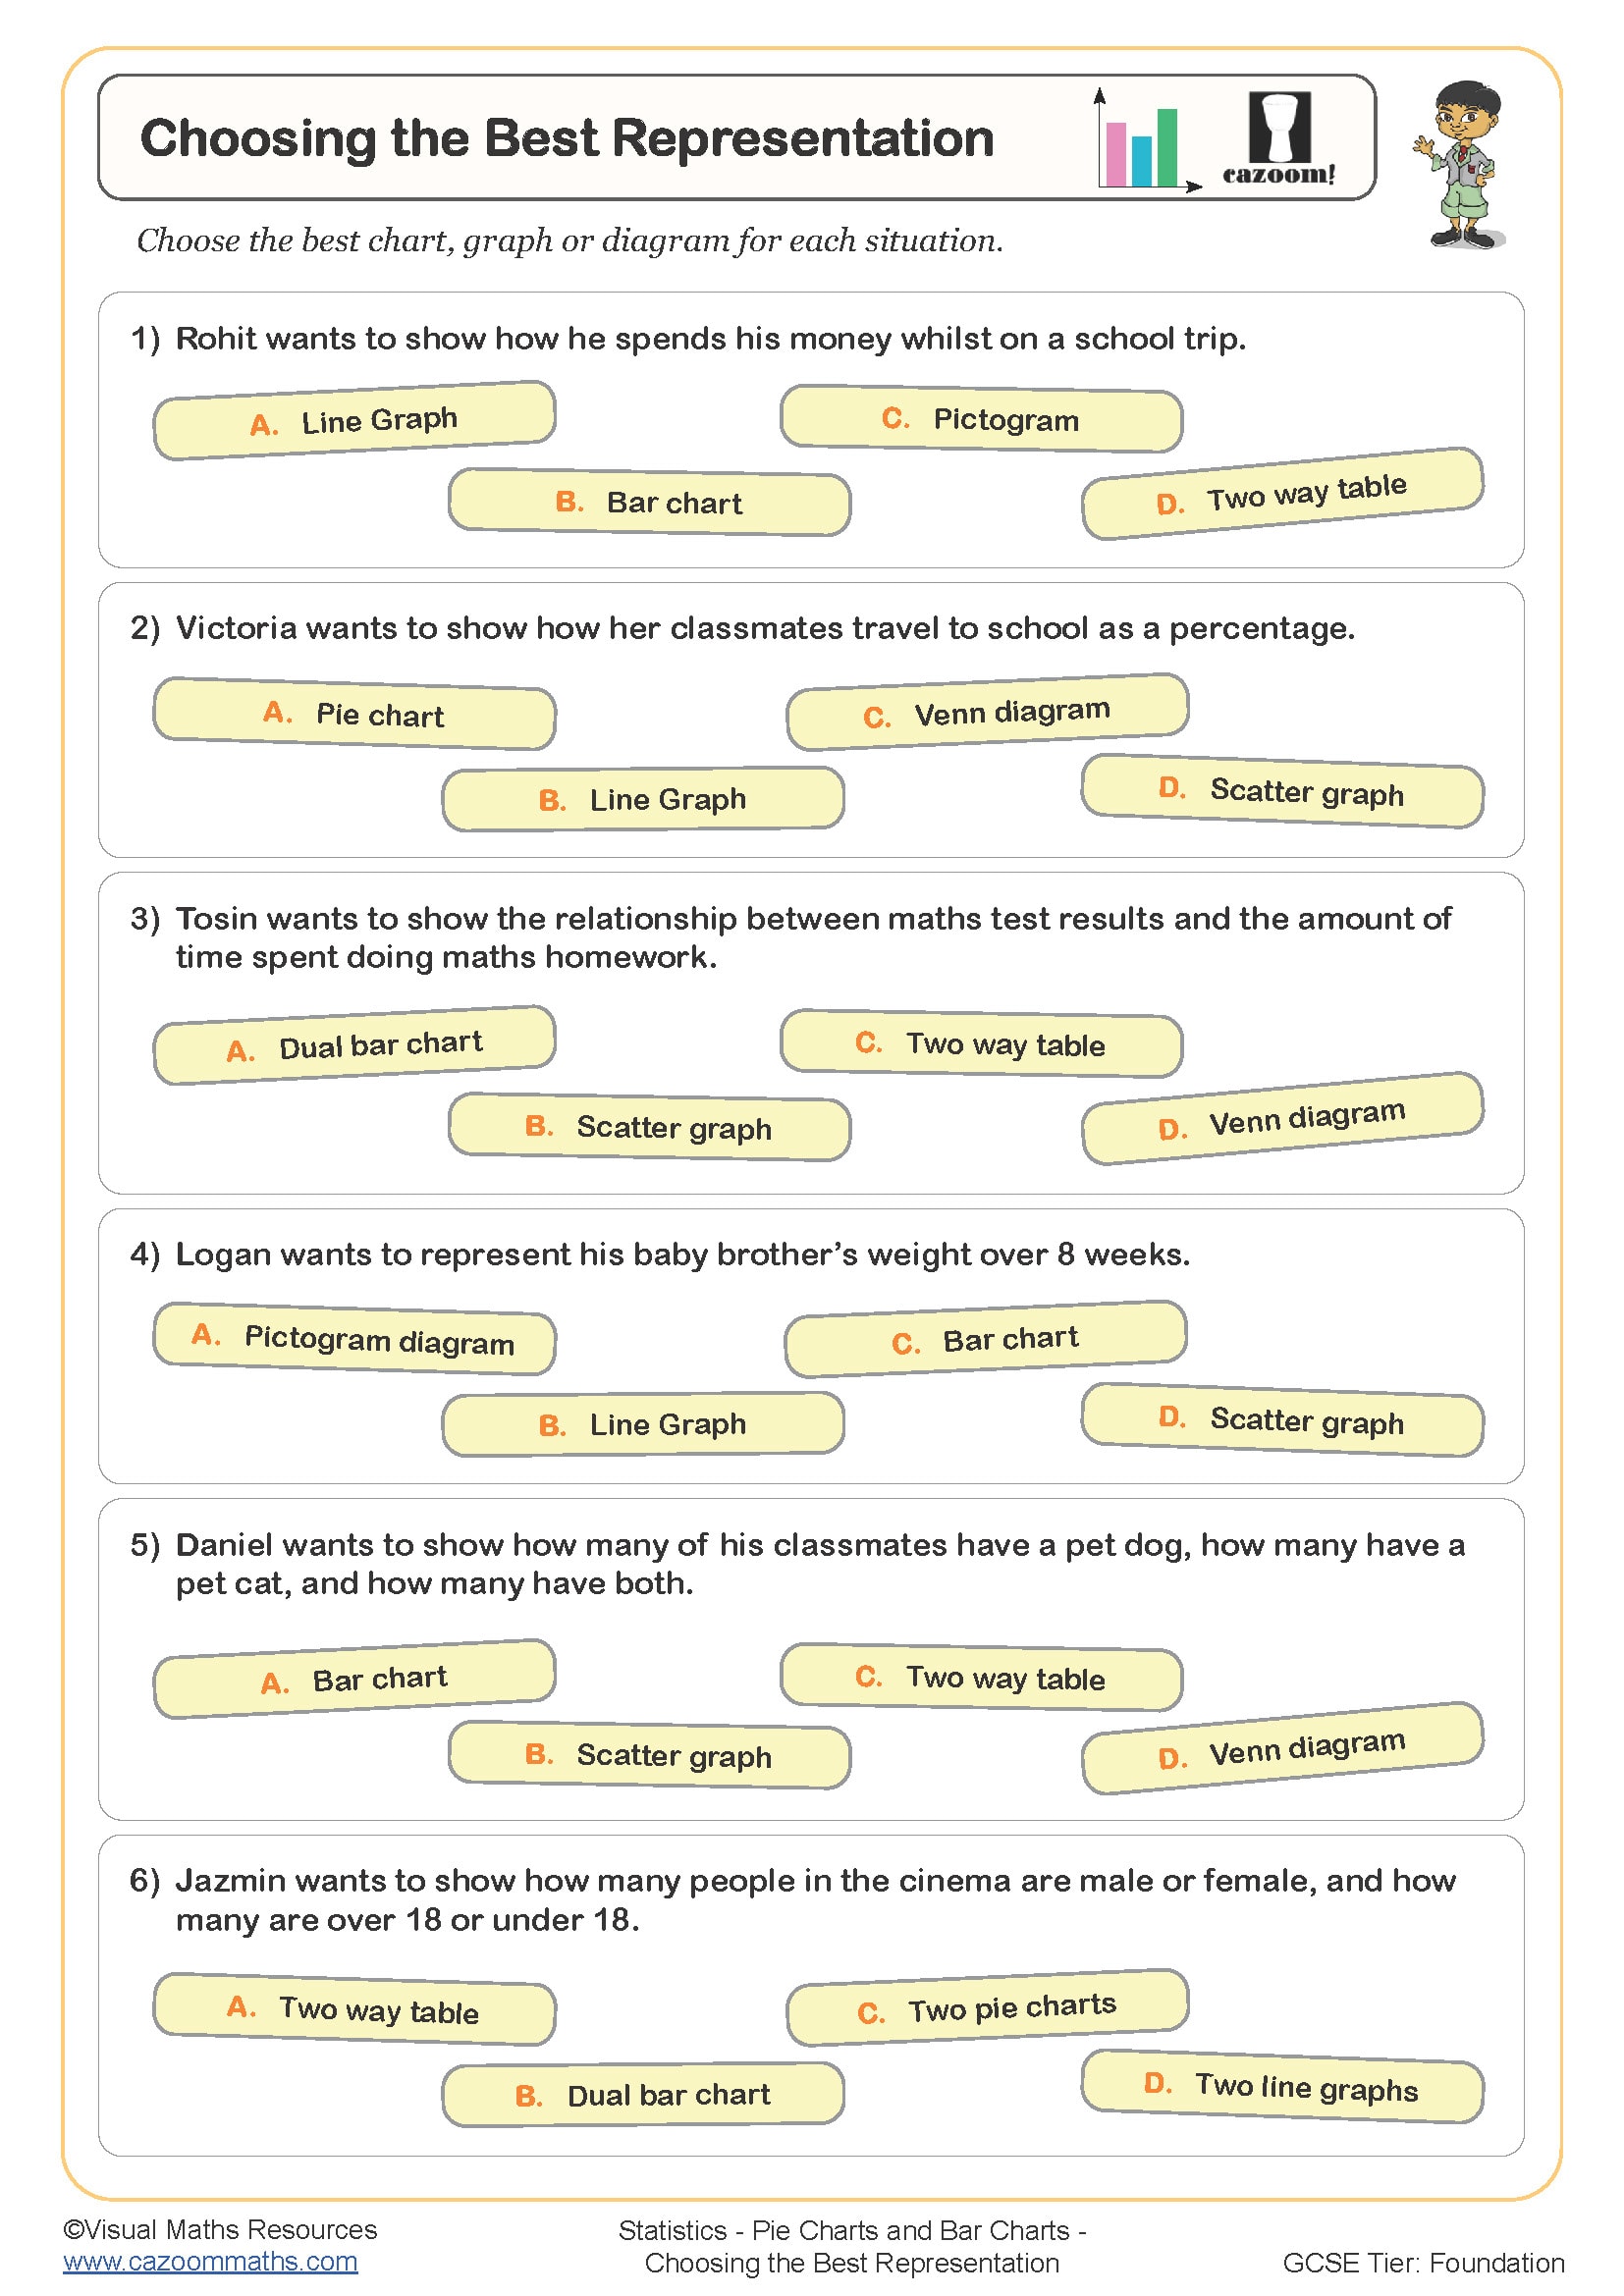
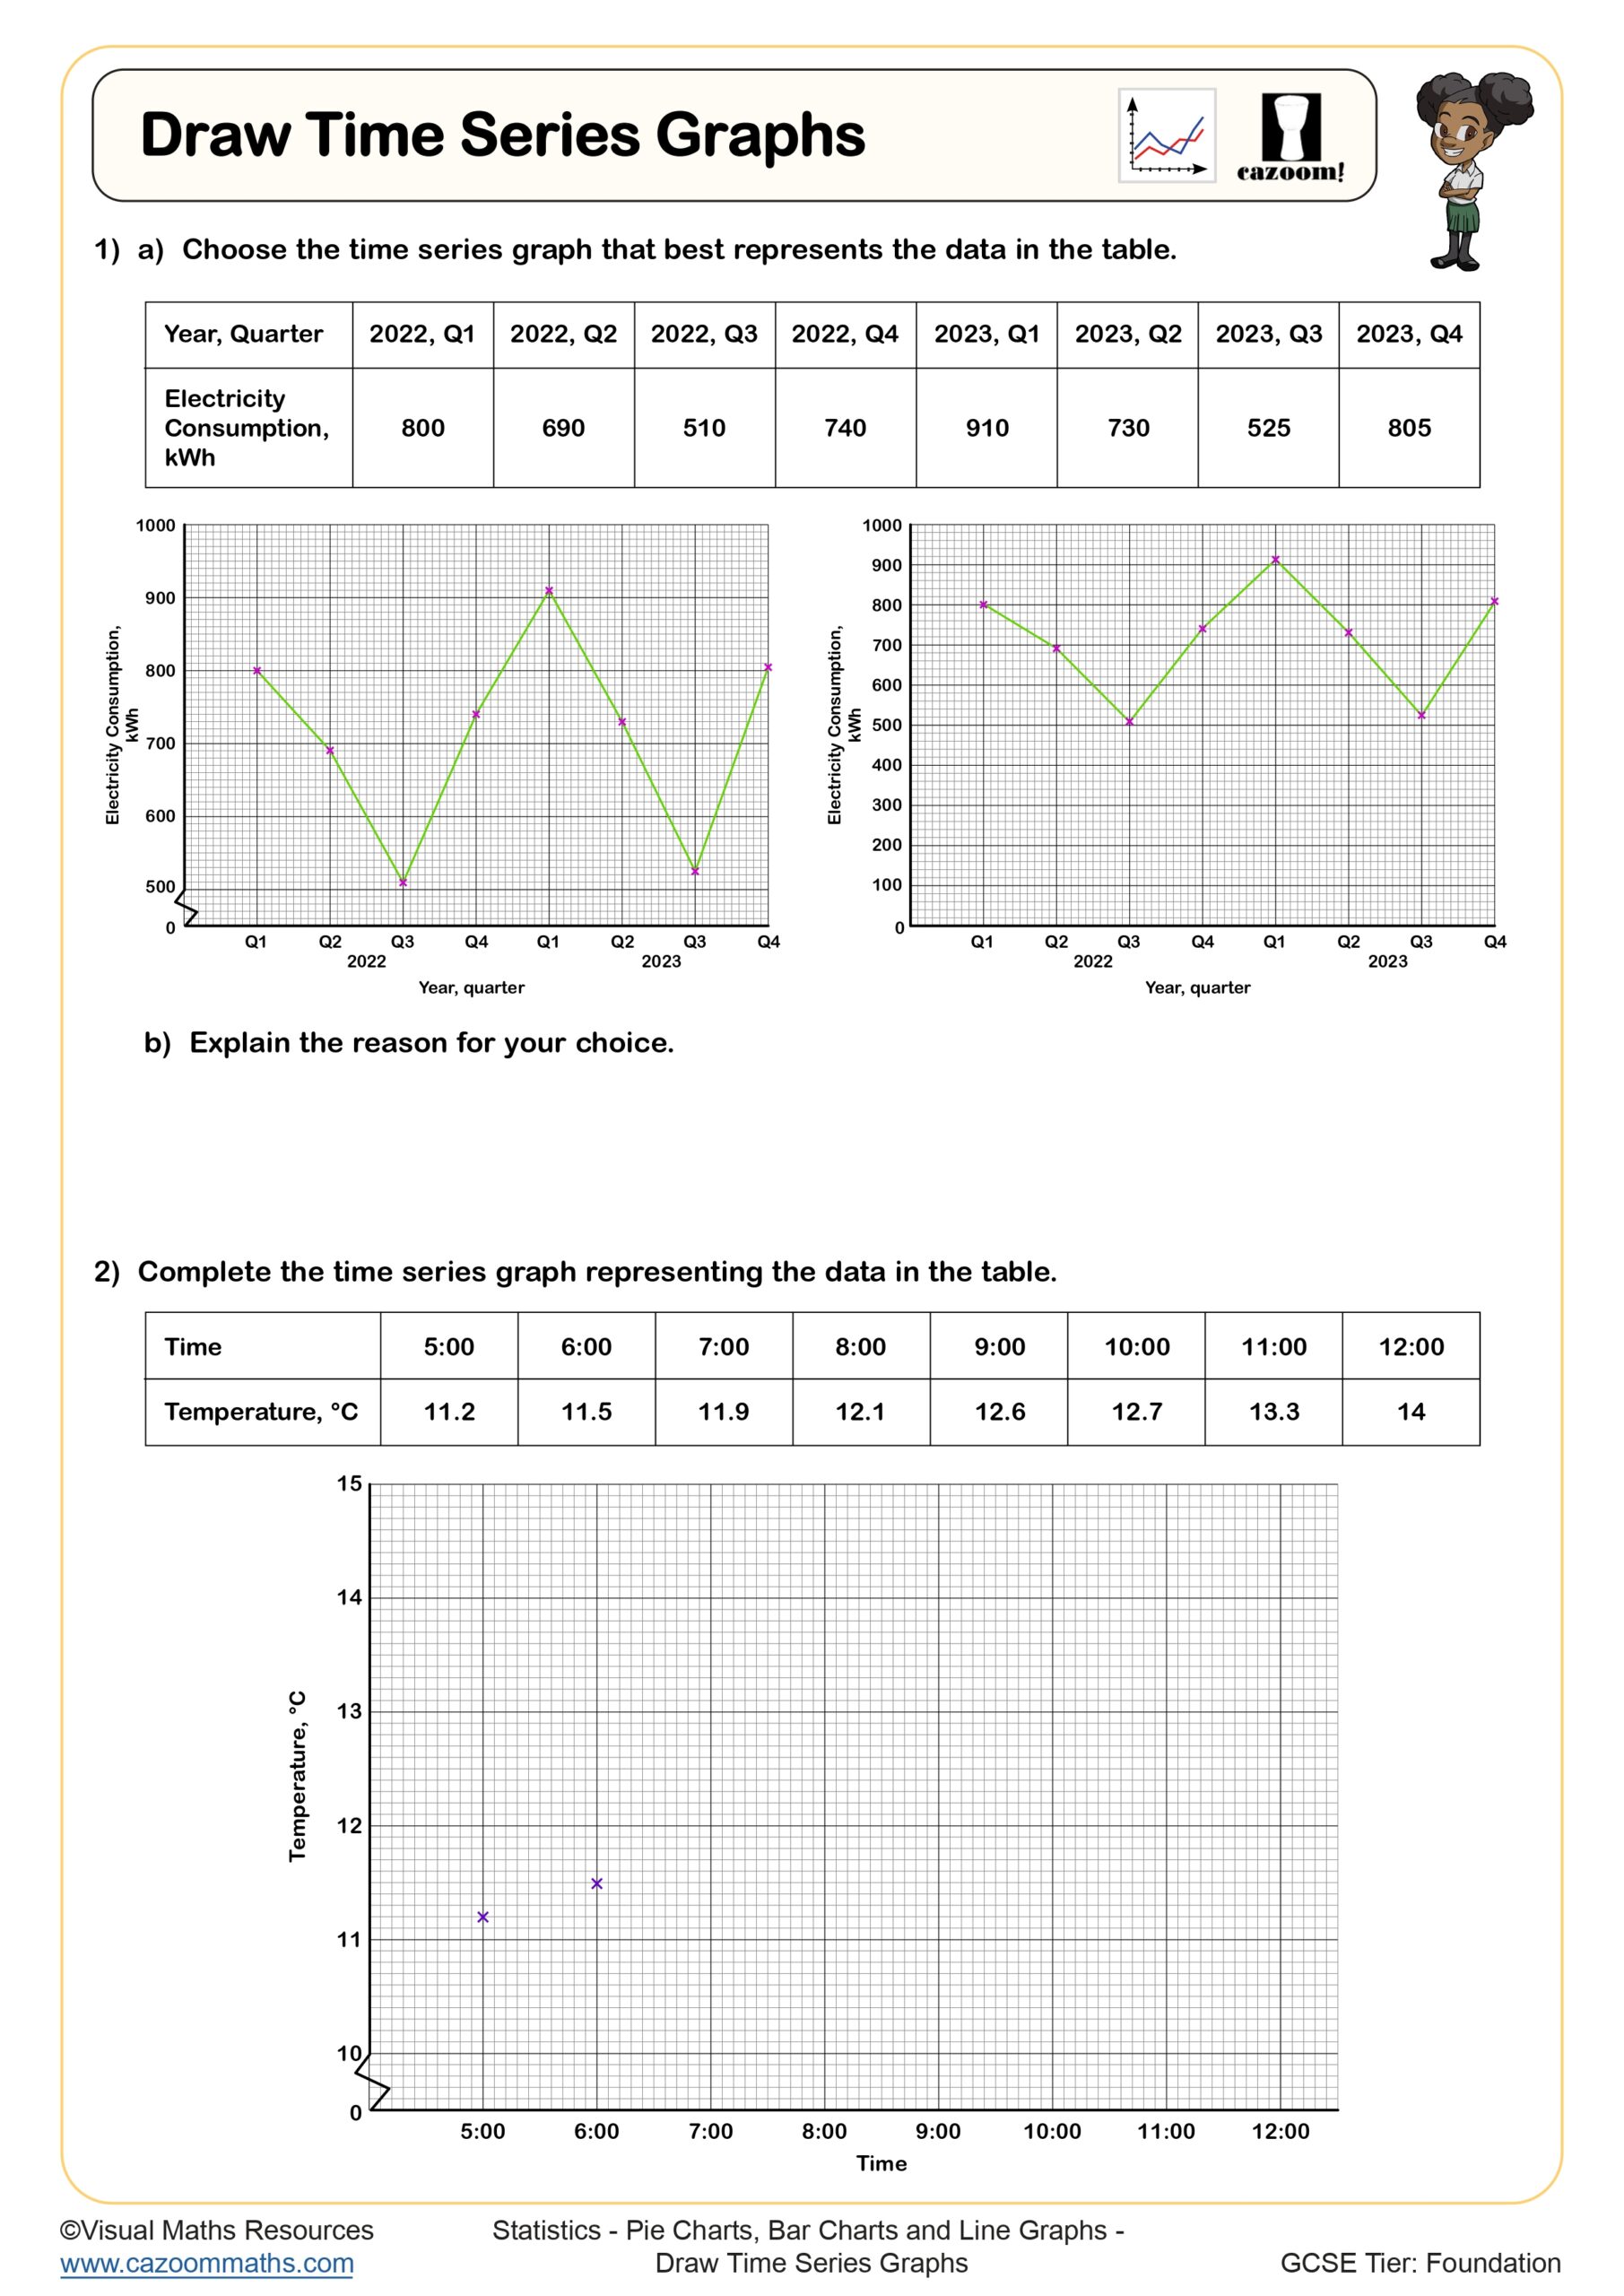
This collection develops graphical fluency through three progressive worksheets. Line Graphs (A) establishes foundational plotting skills, having pupils read values from pre-drawn graphs and extract information from given axes and scales. Line Graphs (B) extends this by requiring students to construct their own graphs from data tables, selecting appropriate scales and connecting points to show continuous relationships. Draw Time Series Graphs focuses specifically on temporal data, asking pupils to plot measurements taken at regular intervals and interpret patterns of change over time. Together, they move students from interpretation through construction to specialised time-based analysis, ensuring they can both create accurate graphs and extract meaningful information from them.
How These Line Graphs Worksheets Build Mathematical Confidence
The visual elements in the graphical work of Cazoom Maths statistics resources enable students to detect patterns that move beyond numerical data tables. This will help them to establish intricate connections that become both easy to understand and remember. Teachers can use the worksheets to support students during practical activities when they measure data for graphing and during paired activities for scale verification and accuracy assessment, and as individual support for students who need help with coordinate geometry basics. Students can learn graph creation through a natural progression, starting with reading existing graphs before they create their own. The worked solutions provide students with reference models to help them complete their homework and revision assignments, especially during assessment preparation when graphical interpretation skills are required. Students develop their ability to identify patterns and make forecasts through visual analysis while building their technical skills for accurate graph interpretation.
From Weather Tracking to Financial Forecasting: Where These Skills Appear
Understanding line graphs underpins how professionals monitor change, identify trends, and make predictions across science, business, and public services. For Example,
•Scientists track temperature changes during chemical reactions
•Financial analysts monitor stock prices across trading periods
•Medical professionals record patients' vital signs over time
•Engineers measure material stress under varying conditions