Stem and Leaf Diagrams Worksheets
All worksheets are created by the team of experienced teachers at Cazoom Maths.
What types of stem and leaf diagram questions and answers are included in these worksheets?
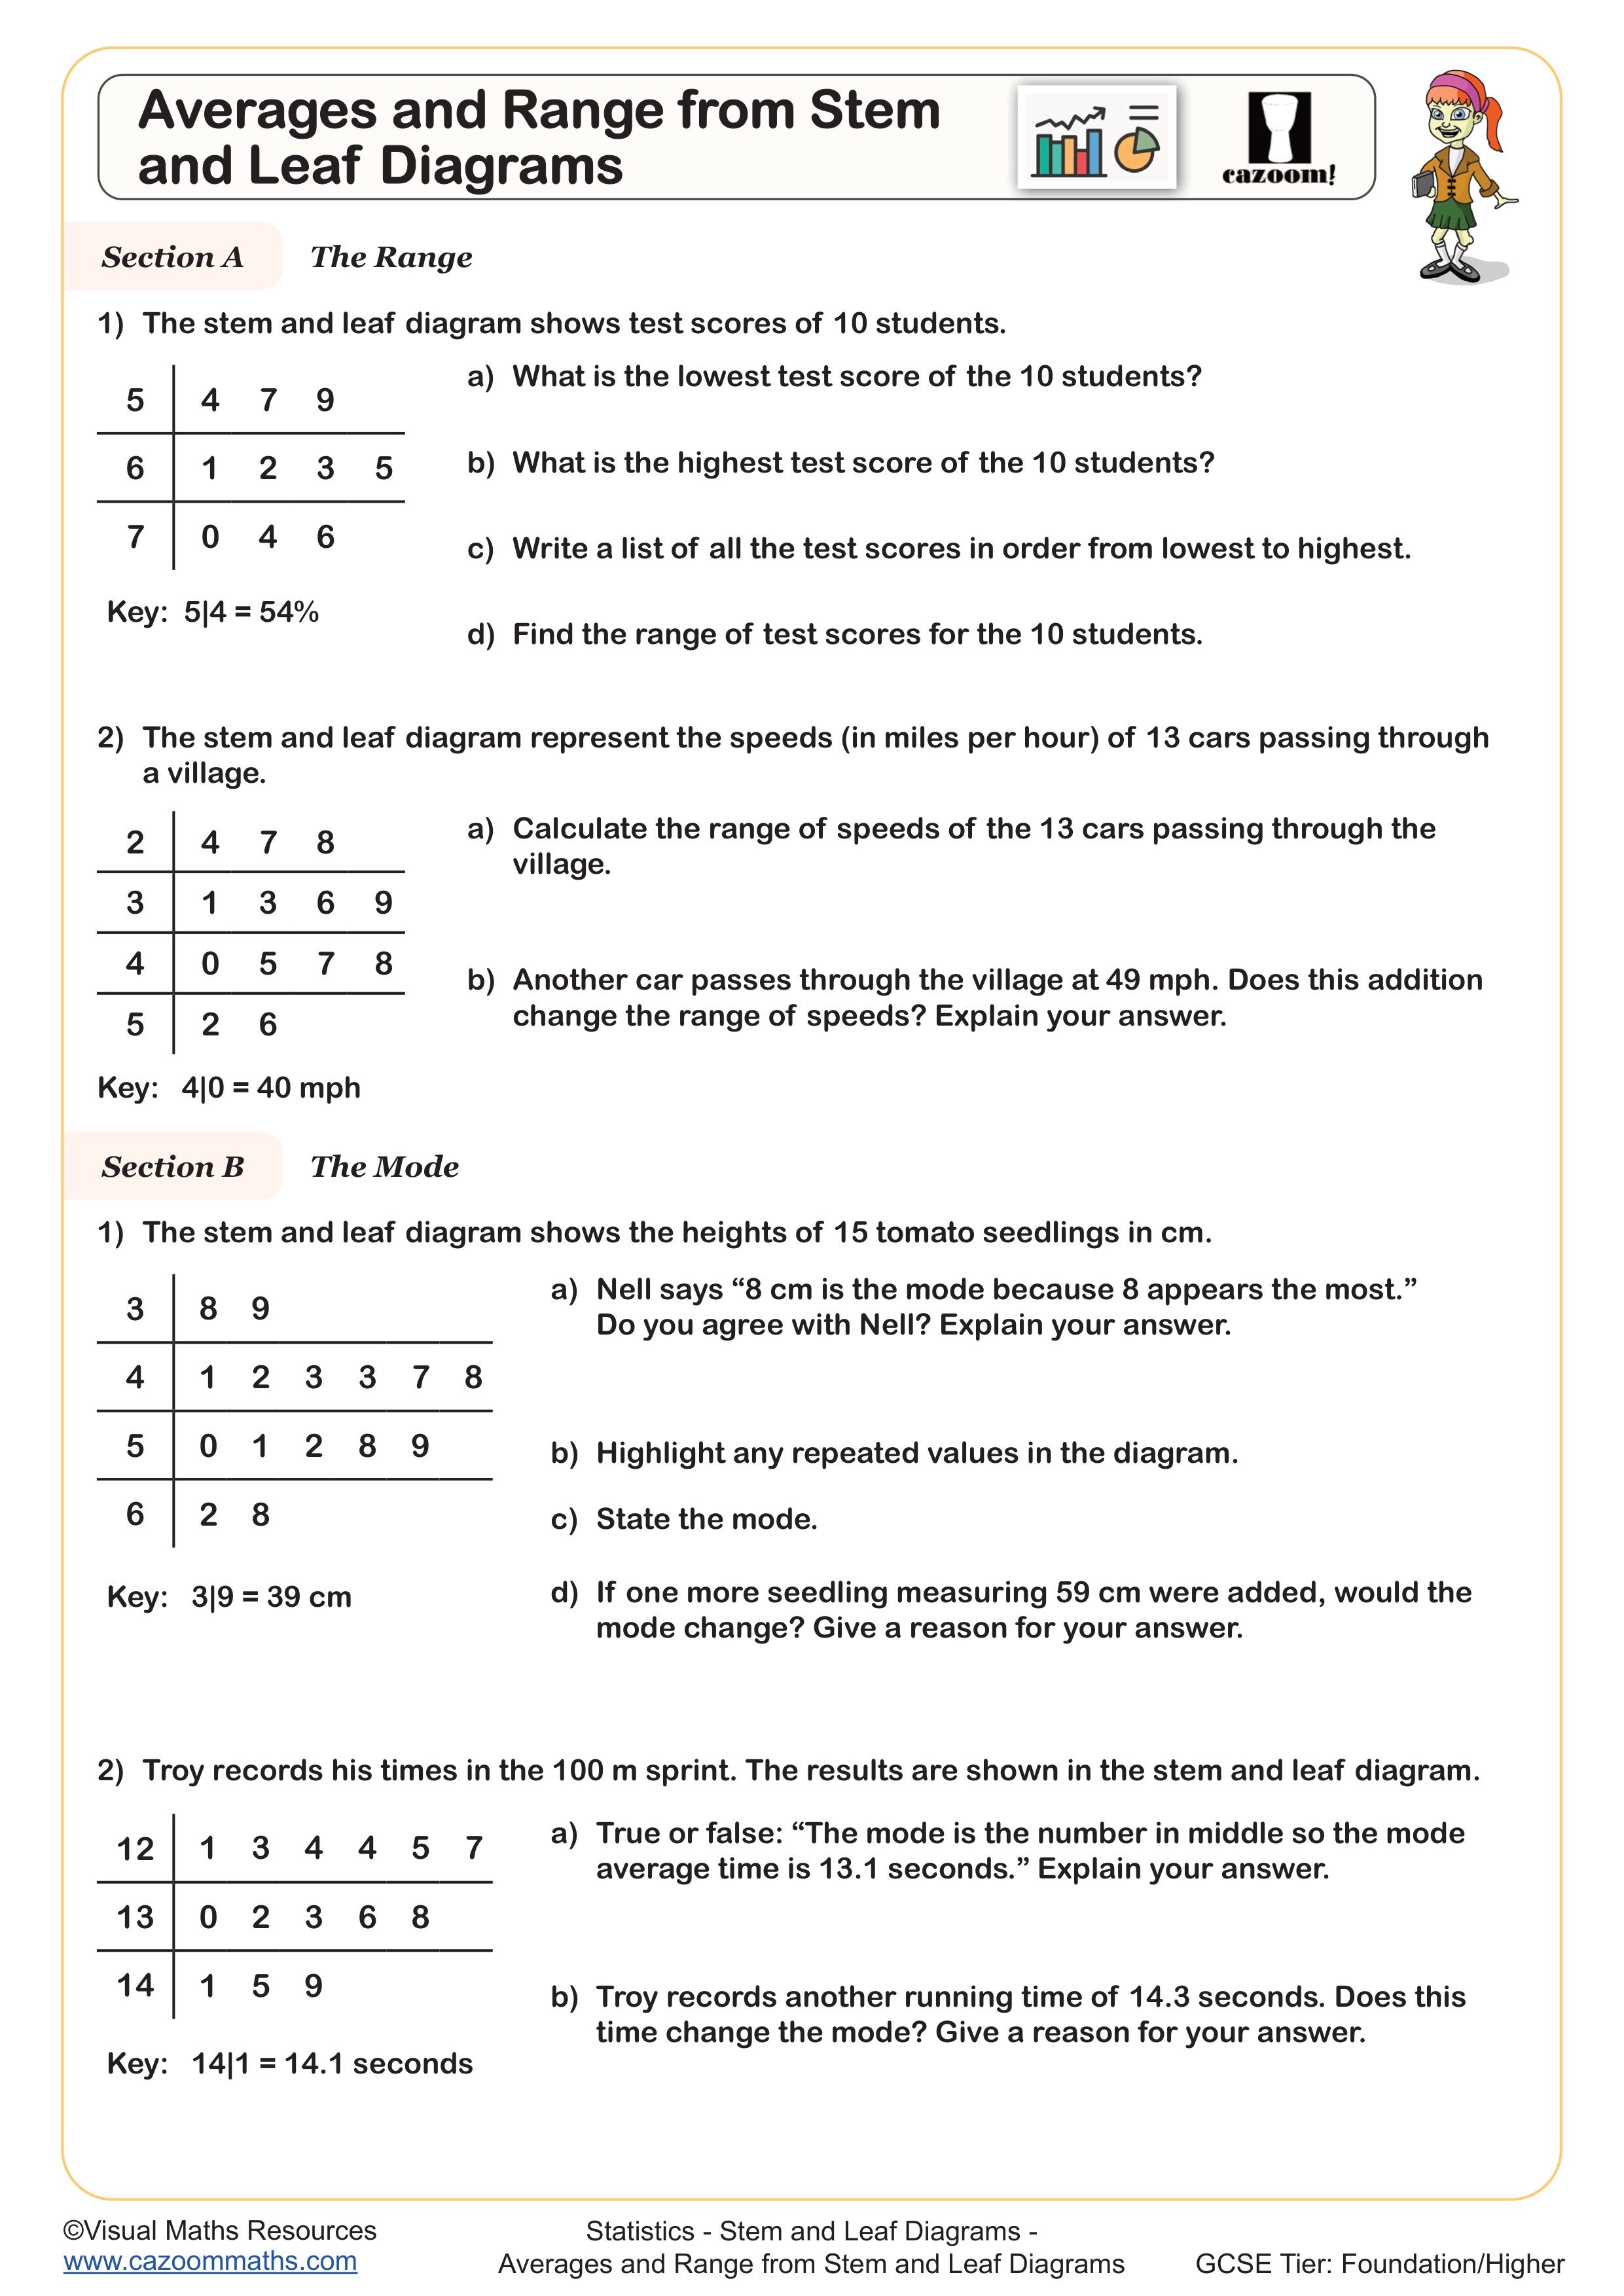
The worksheets contain construction tasks where students build diagrams from raw datasets, interpretation questions requiring statistical calculations, and comparison activities between multiple displays. Students encounter problems involving different scales, including cases where stems represent tens, hundreds, or decimal values, aligning with National Curriculum requirements for data handling at KS3 and KS4 levels.
Teachers report that students commonly make errors when the stem represents units other than tens, particularly with decimal data where 2|3 might represent 2.3 rather than 23. The answer sheets demonstrate correct scaling notation and provide step-by-step working for finding median, mode, and range values, helping teachers address these frequent misconceptions during marking and feedback sessions.
Which year groups should use these stem and leaf diagram worksheets?
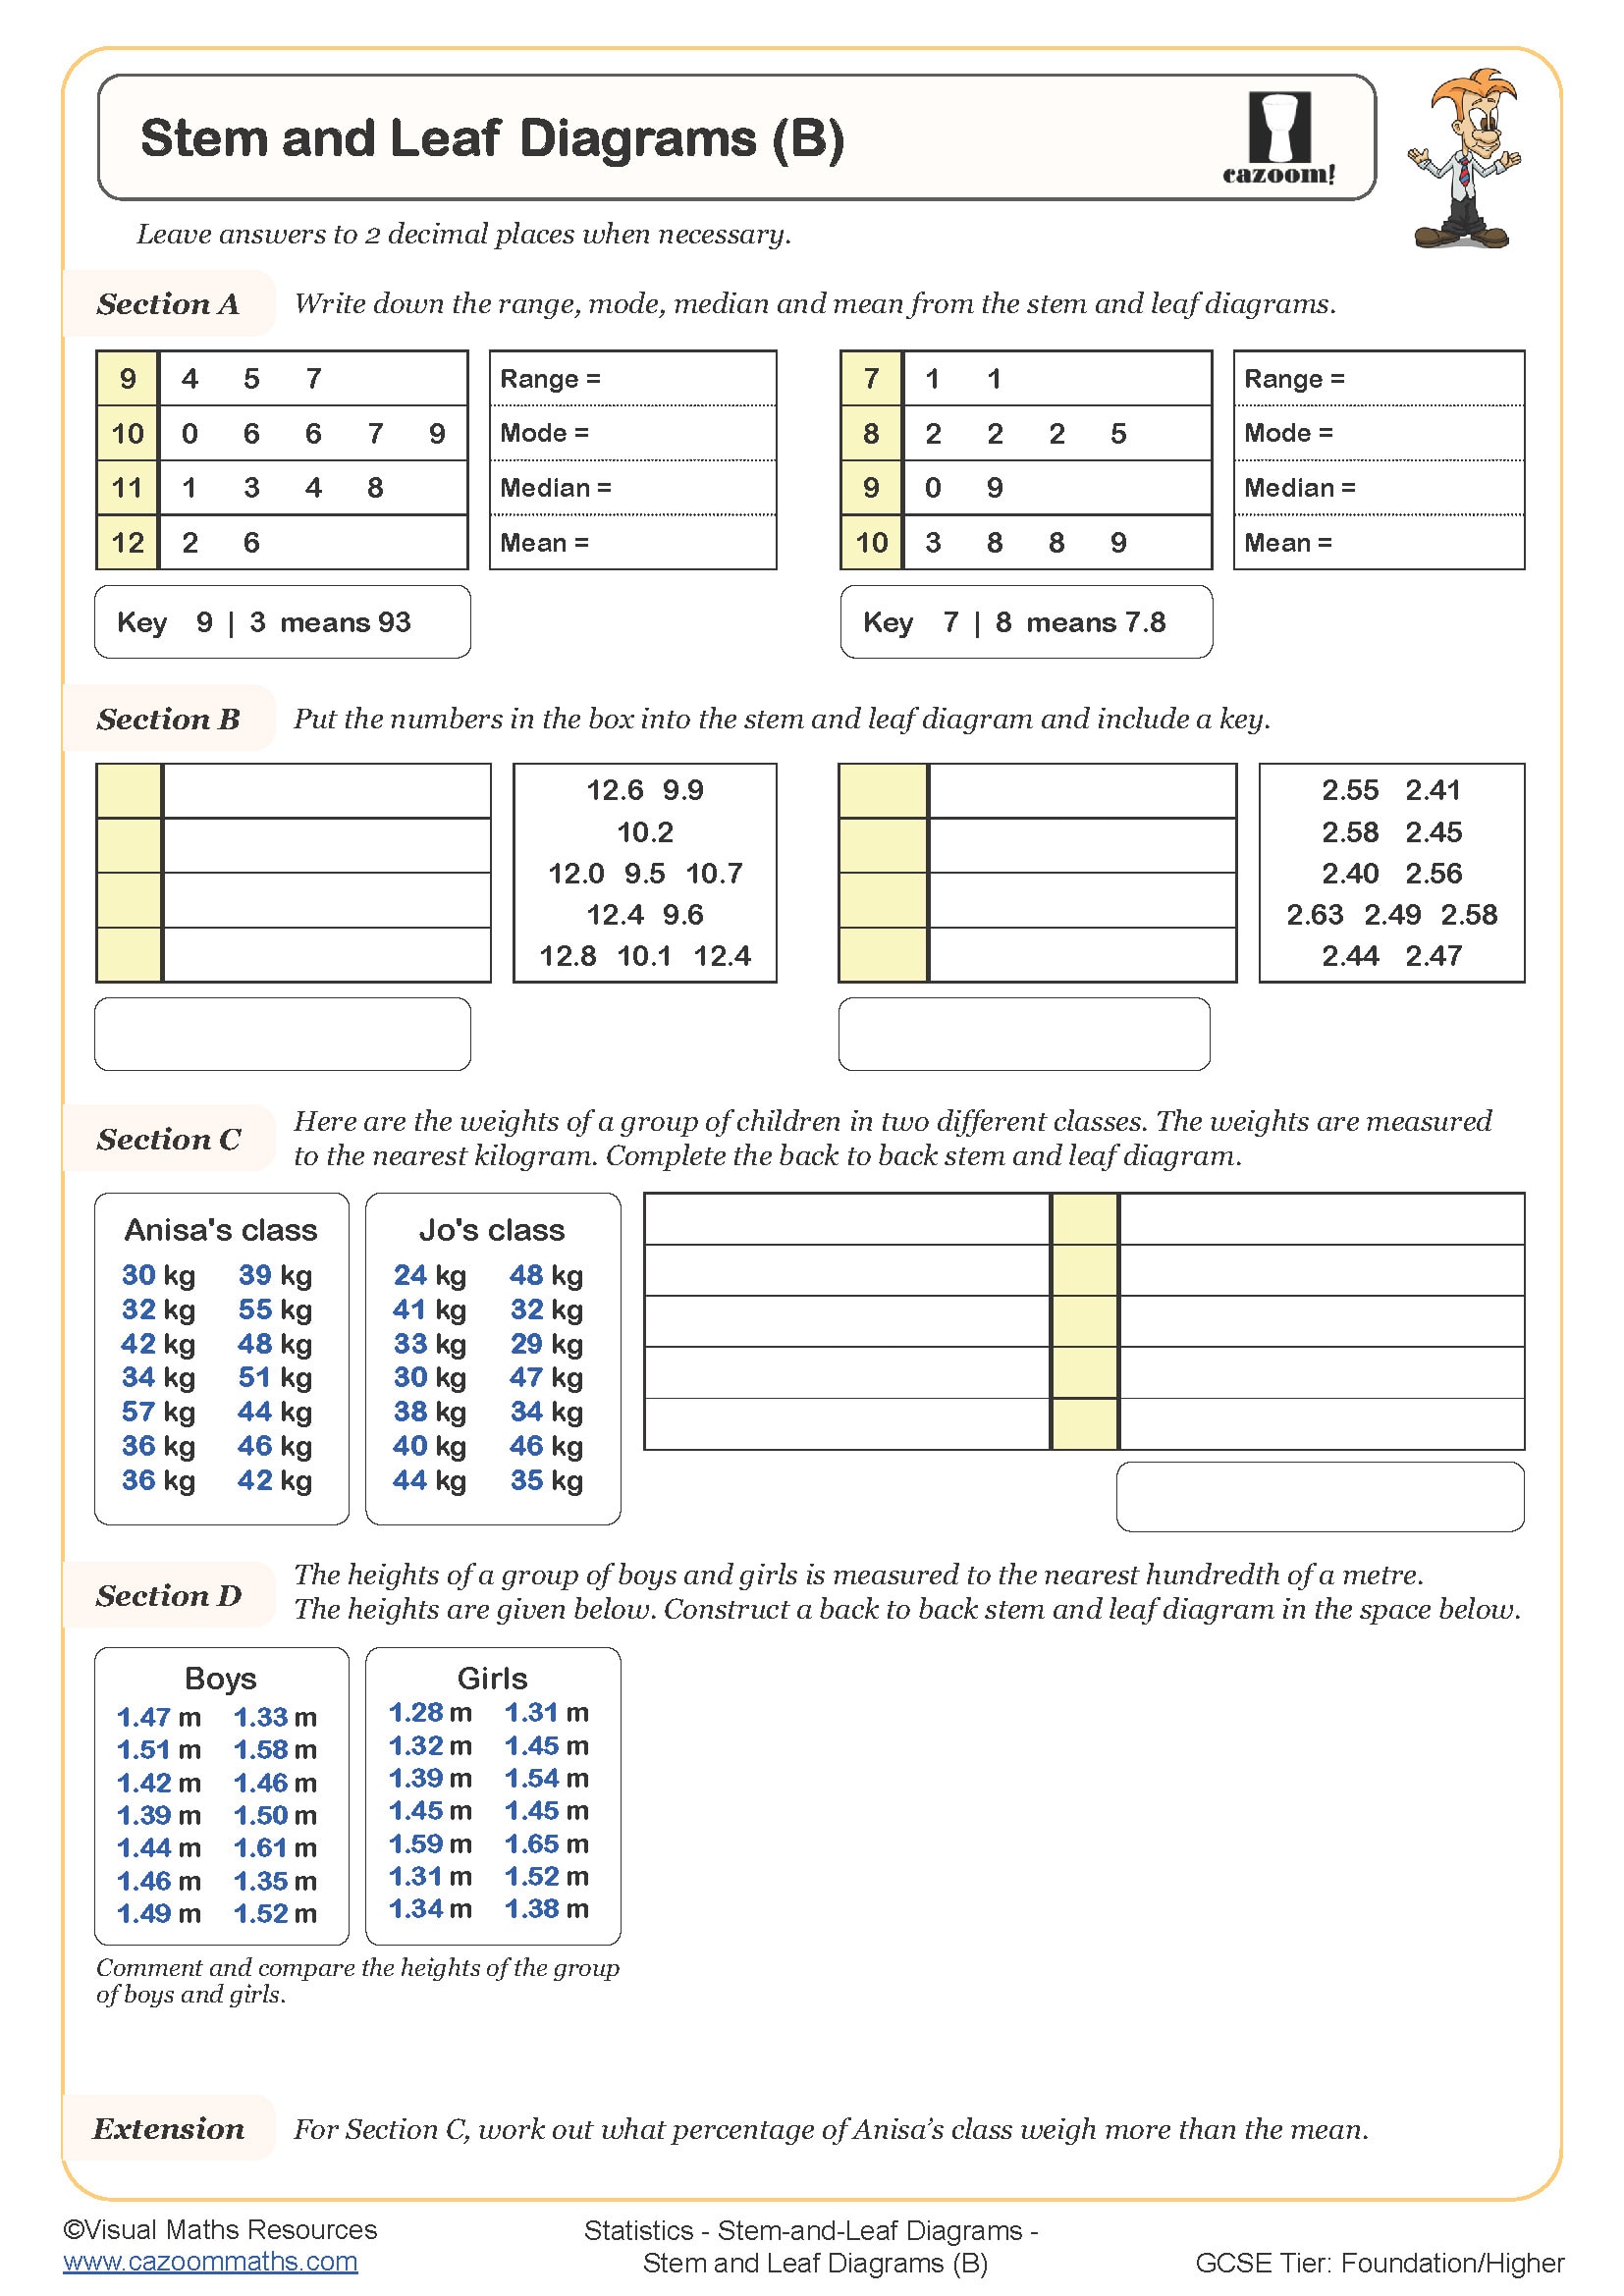
These resources suit students from Year 7 through Year 11, with content scaffolded to match developing statistical understanding. Year 7 and 8 students typically begin with simple integer datasets using standard ten-unit stems, whilst Year 9 students progress to more complex scales and larger datasets that require careful organisation skills.
GCSE students in Years 10 and 11 encounter exam-style questions involving decimal stems, back-to-back comparisons, and statistical analysis tasks that connect to probability topics. Teachers find that regular practice across these year groups builds confidence in data interpretation, particularly important as stem and leaf diagrams frequently appear in GCSE statistics papers requiring both construction and analytical skills.
How do students learn to handle different scales in stem and leaf diagrams?
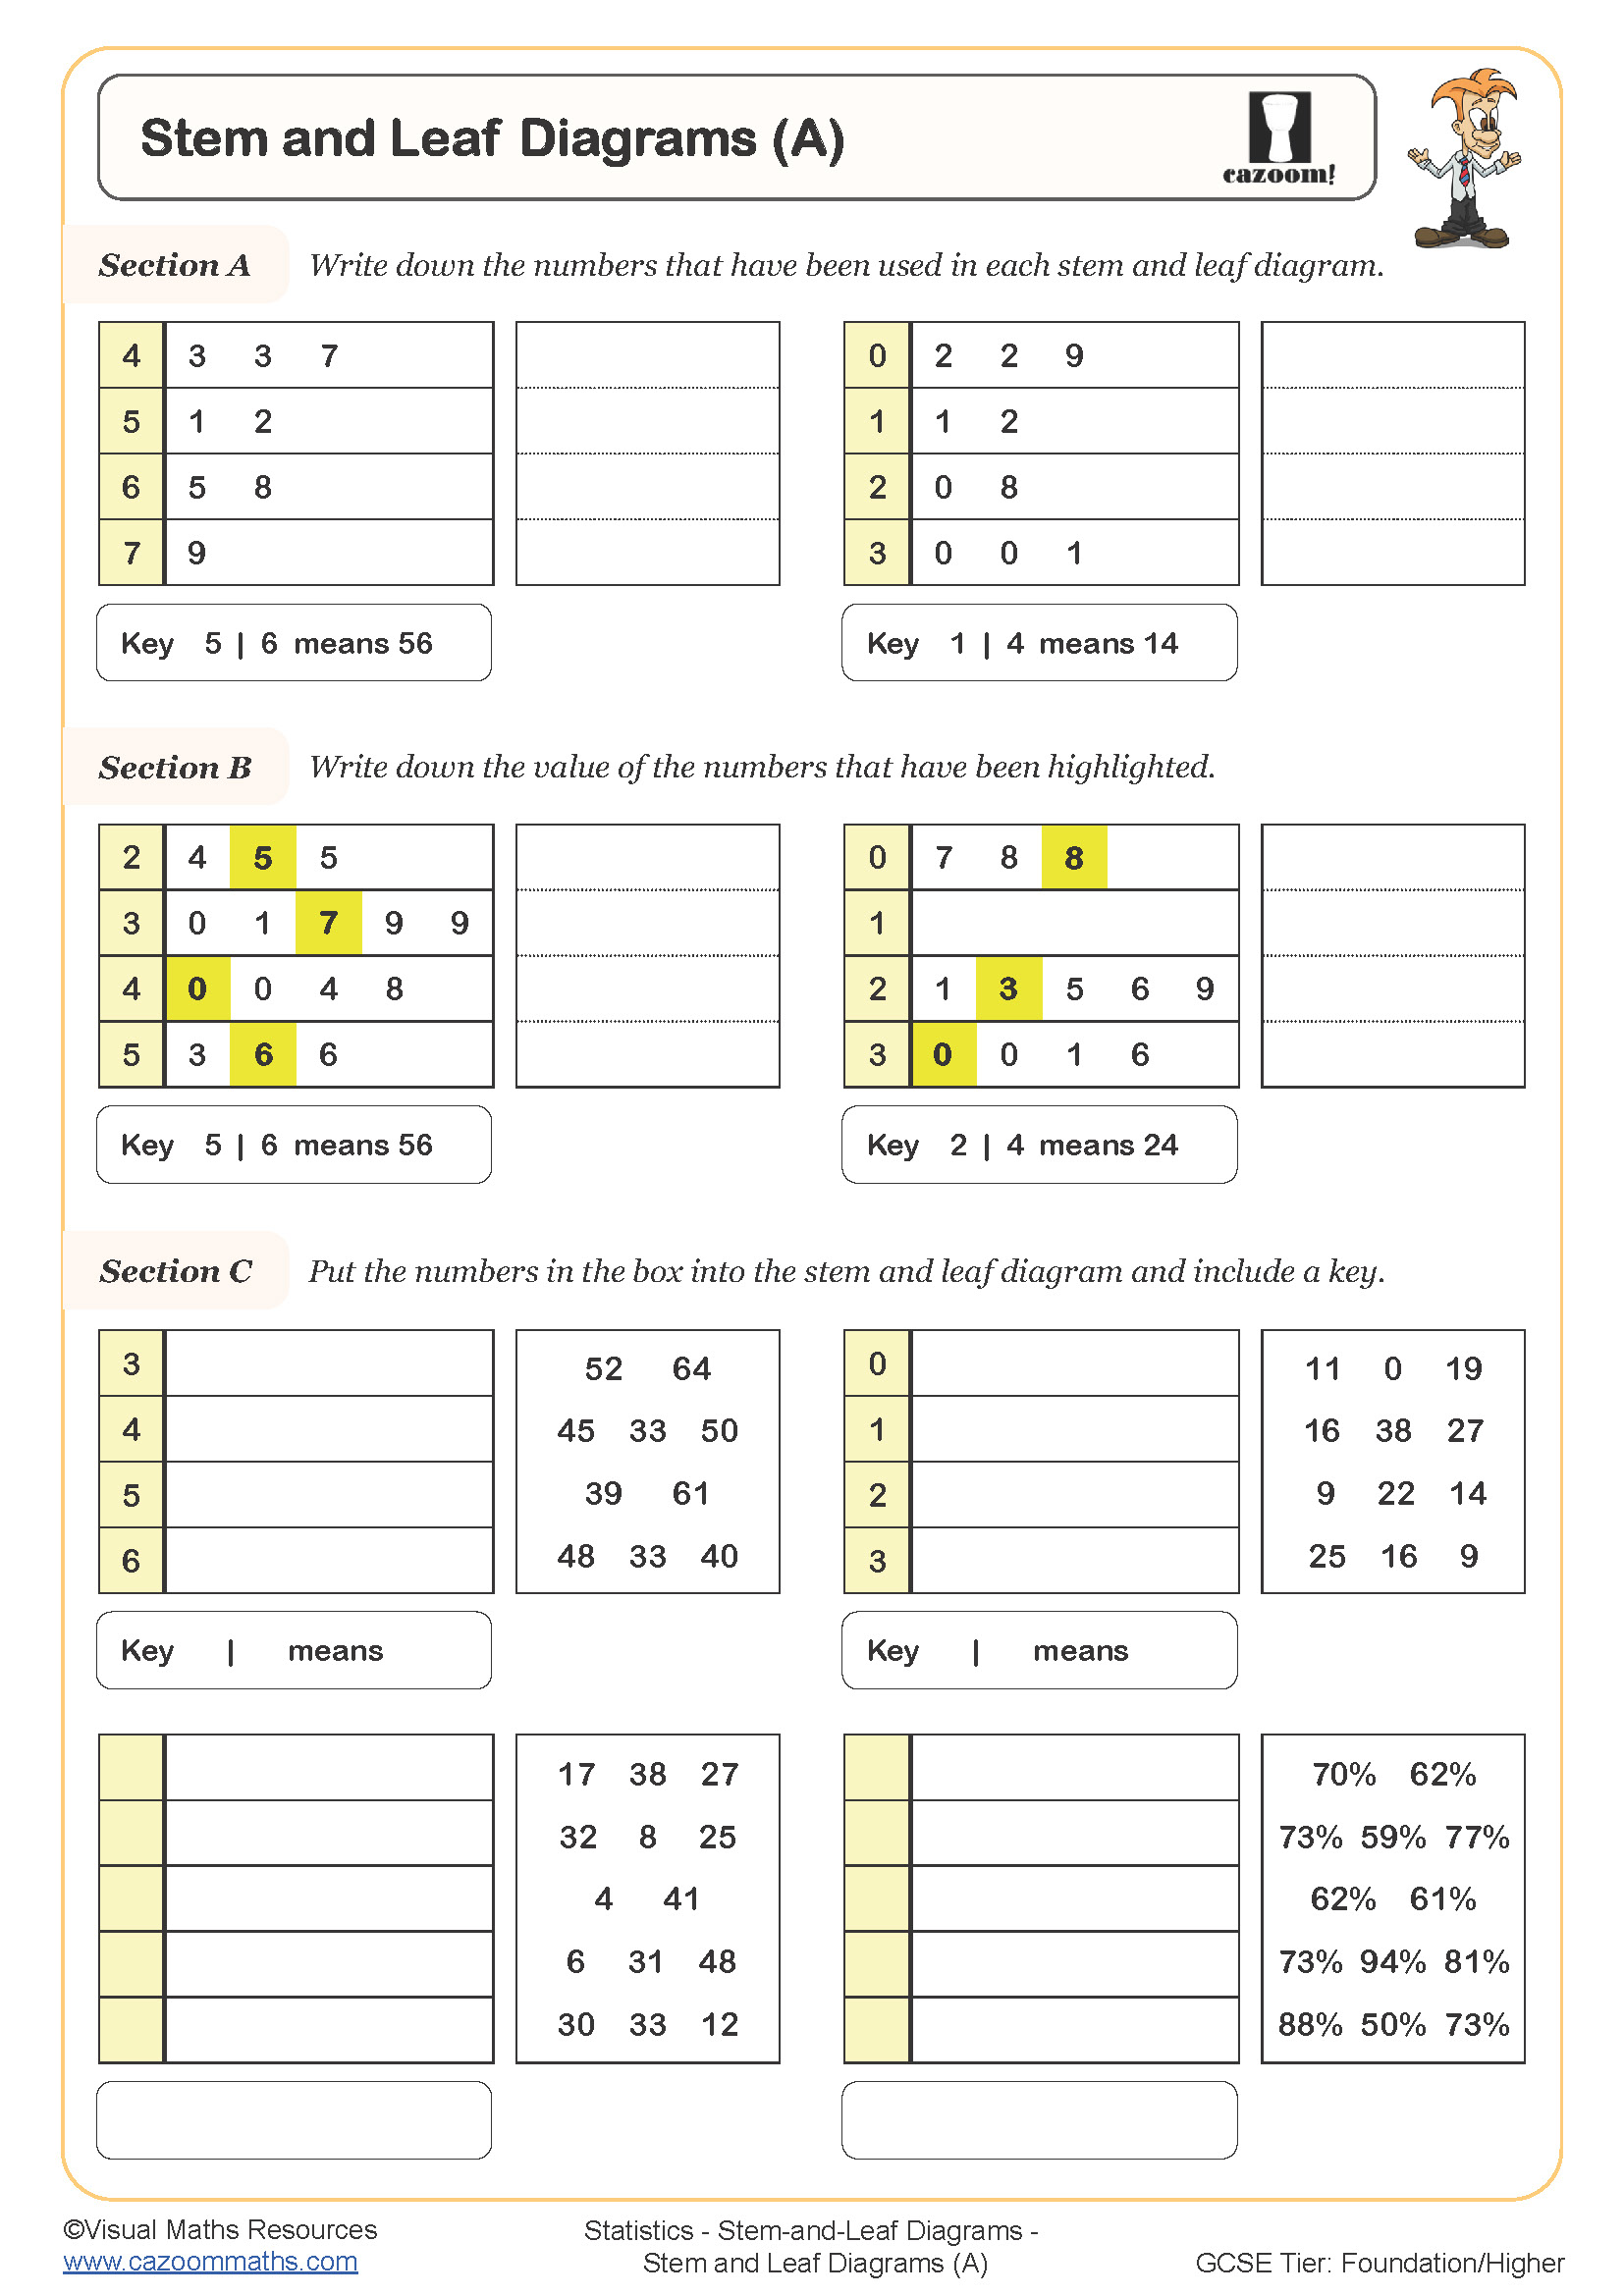
Students begin with straightforward datasets where stems represent tens and leaves represent units, then progress to scenarios where stems might represent hundreds, decimals, or other intervals. The worksheets systematically introduce scale variations with clear examples showing proper key notation, such as '3|2 represents 32' or '1|4 represents 1.4 kilograms'.
Classroom experience shows that students benefit from explicitly writing out several values in full before attempting diagram construction, particularly with decimal or large number datasets. Teachers often observe improved accuracy when students practise reading the key aloud and converting a few plotted values back to original numbers, reinforcing the connection between the visual representation and actual data values.
What teaching strategies work best when using these stem and leaf worksheets?
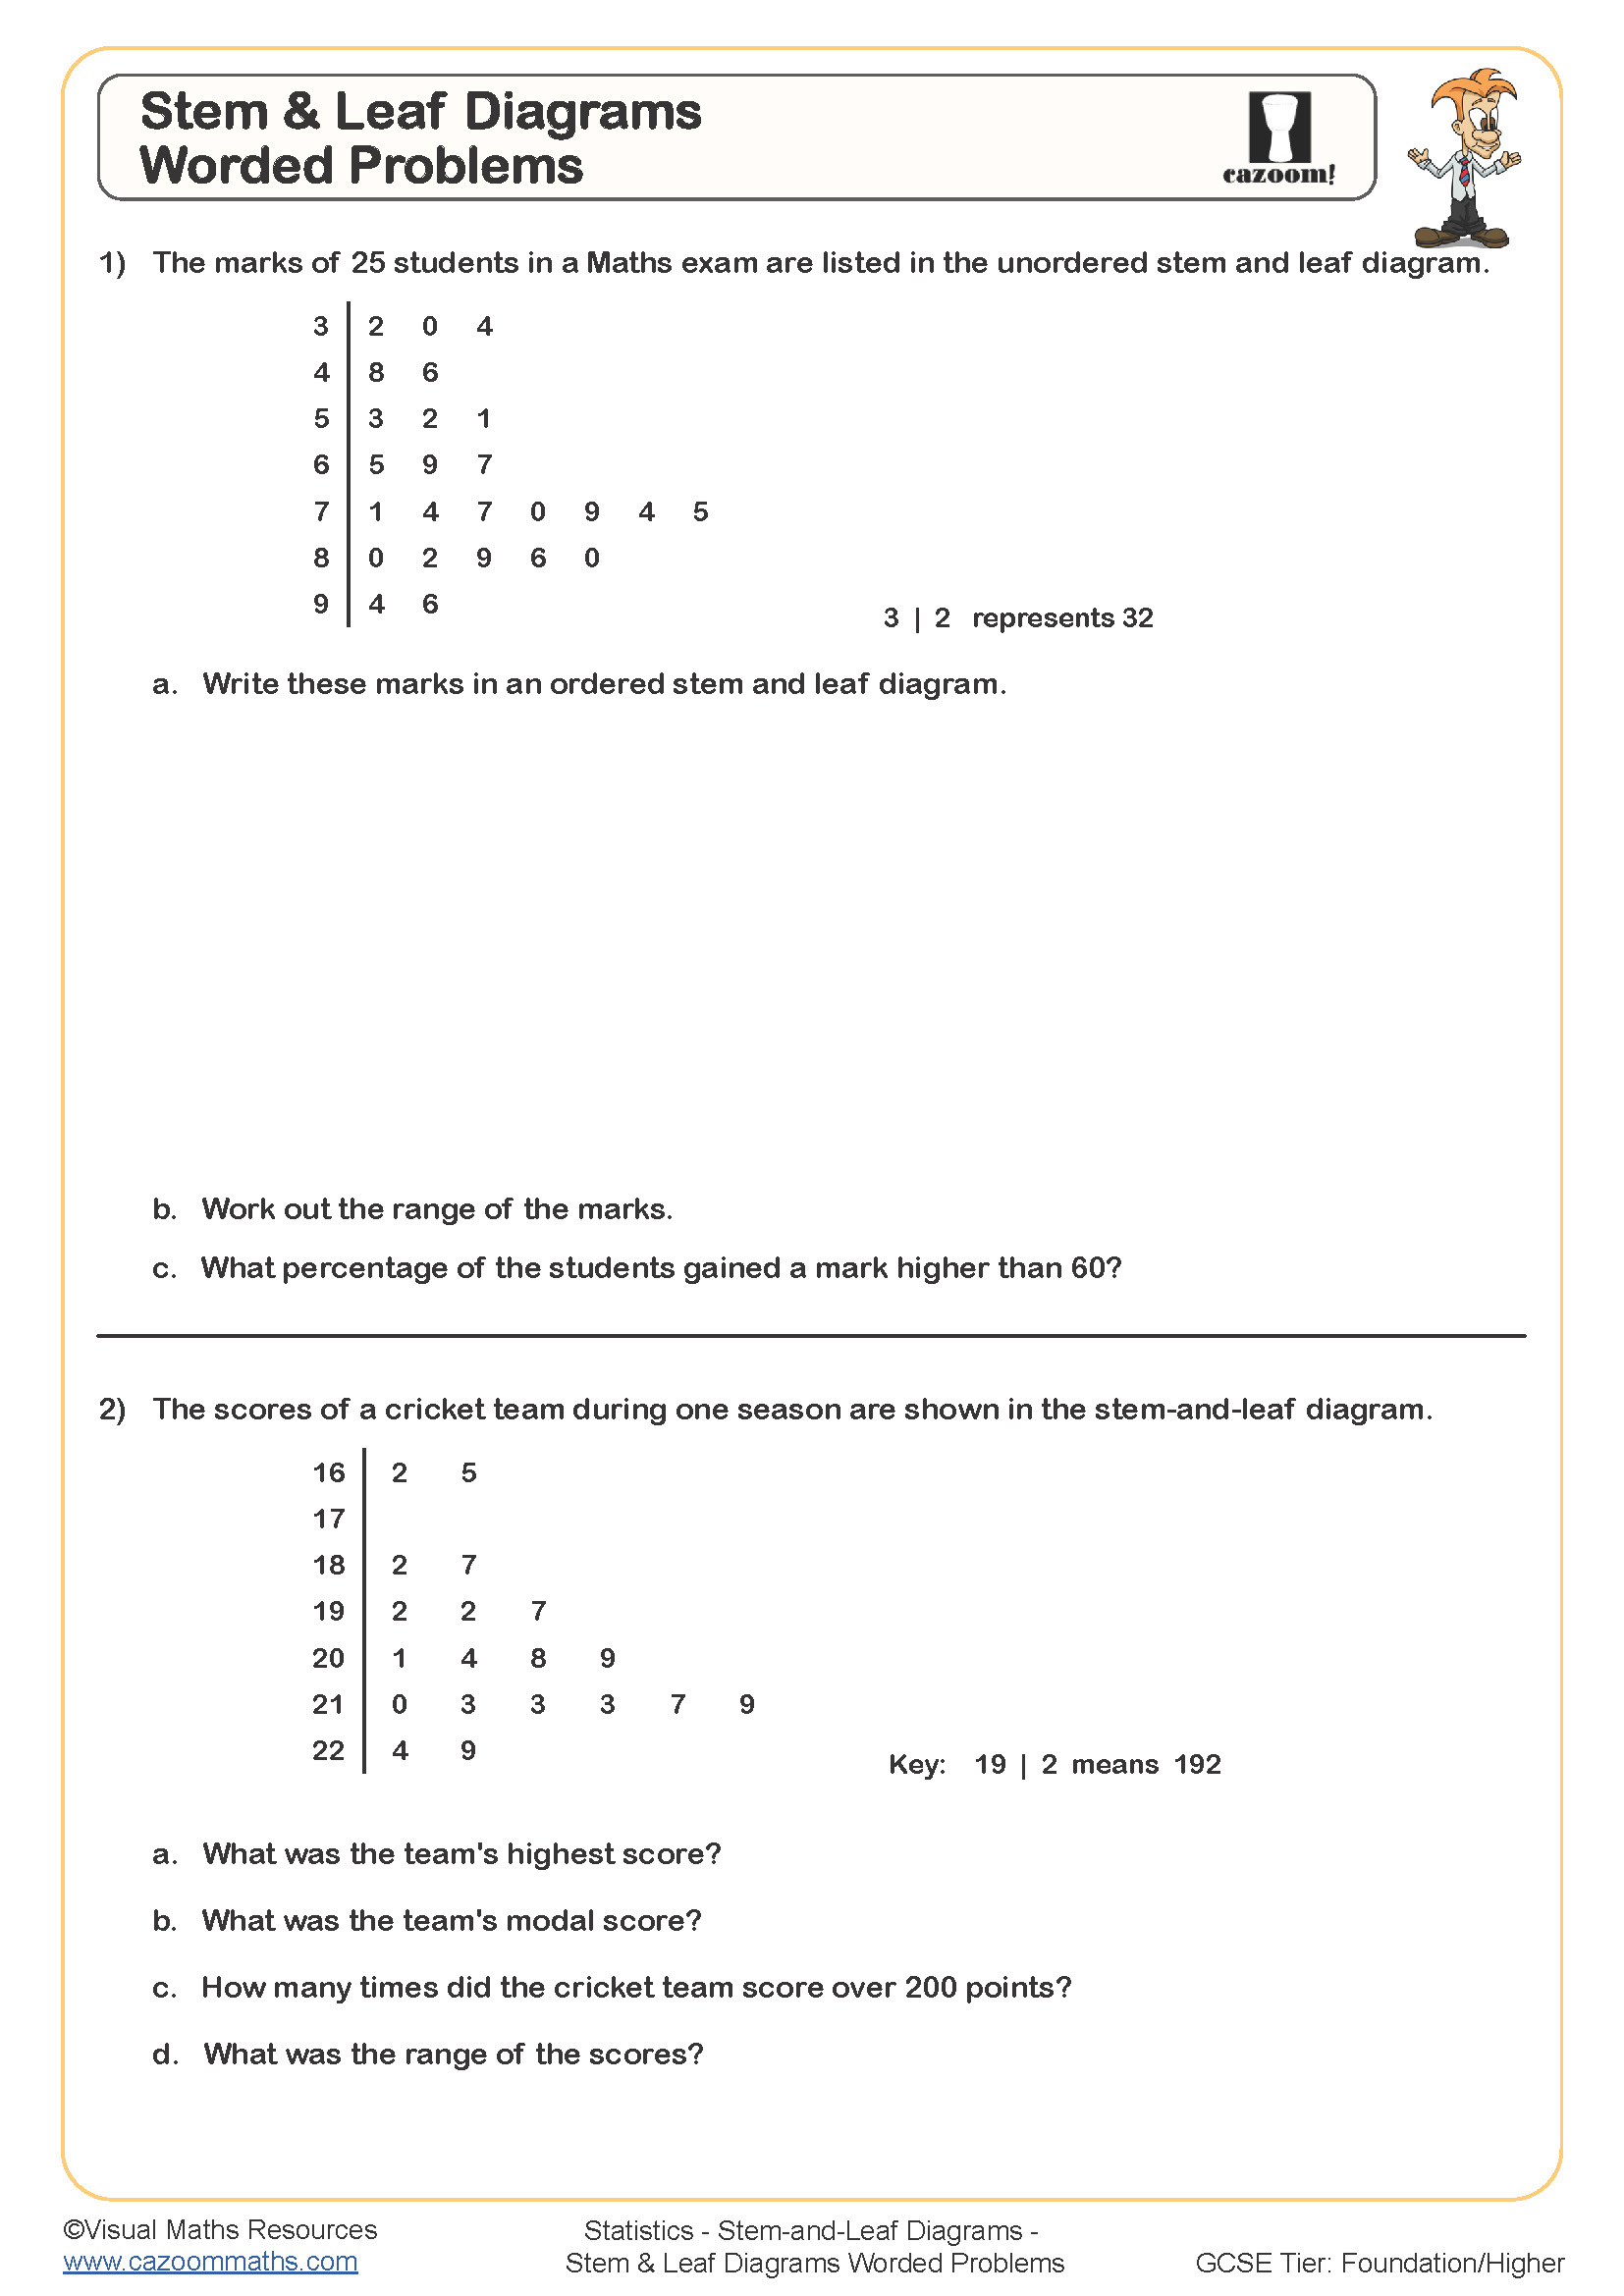
Effective approaches include starting lessons with collaborative diagram construction using class-generated data, such as test scores or reaction times from science experiments. This builds engagement whilst demonstrating real-world applications before students tackle worksheet problems independently. Teachers find that explicit modelling of the ordering process prevents common errors where leaves remain unsorted.
Many teachers use the answer sheets to create peer assessment opportunities, where students check each other's work using provided solutions. This approach develops critical evaluation skills whilst reducing marking load. The worksheets also work well for differentiation, with simpler datasets supporting struggling learners whilst more complex multi-part questions challenge higher-achieving students within the same lesson structure.