Two-Way Tables and Pictograms Worksheets
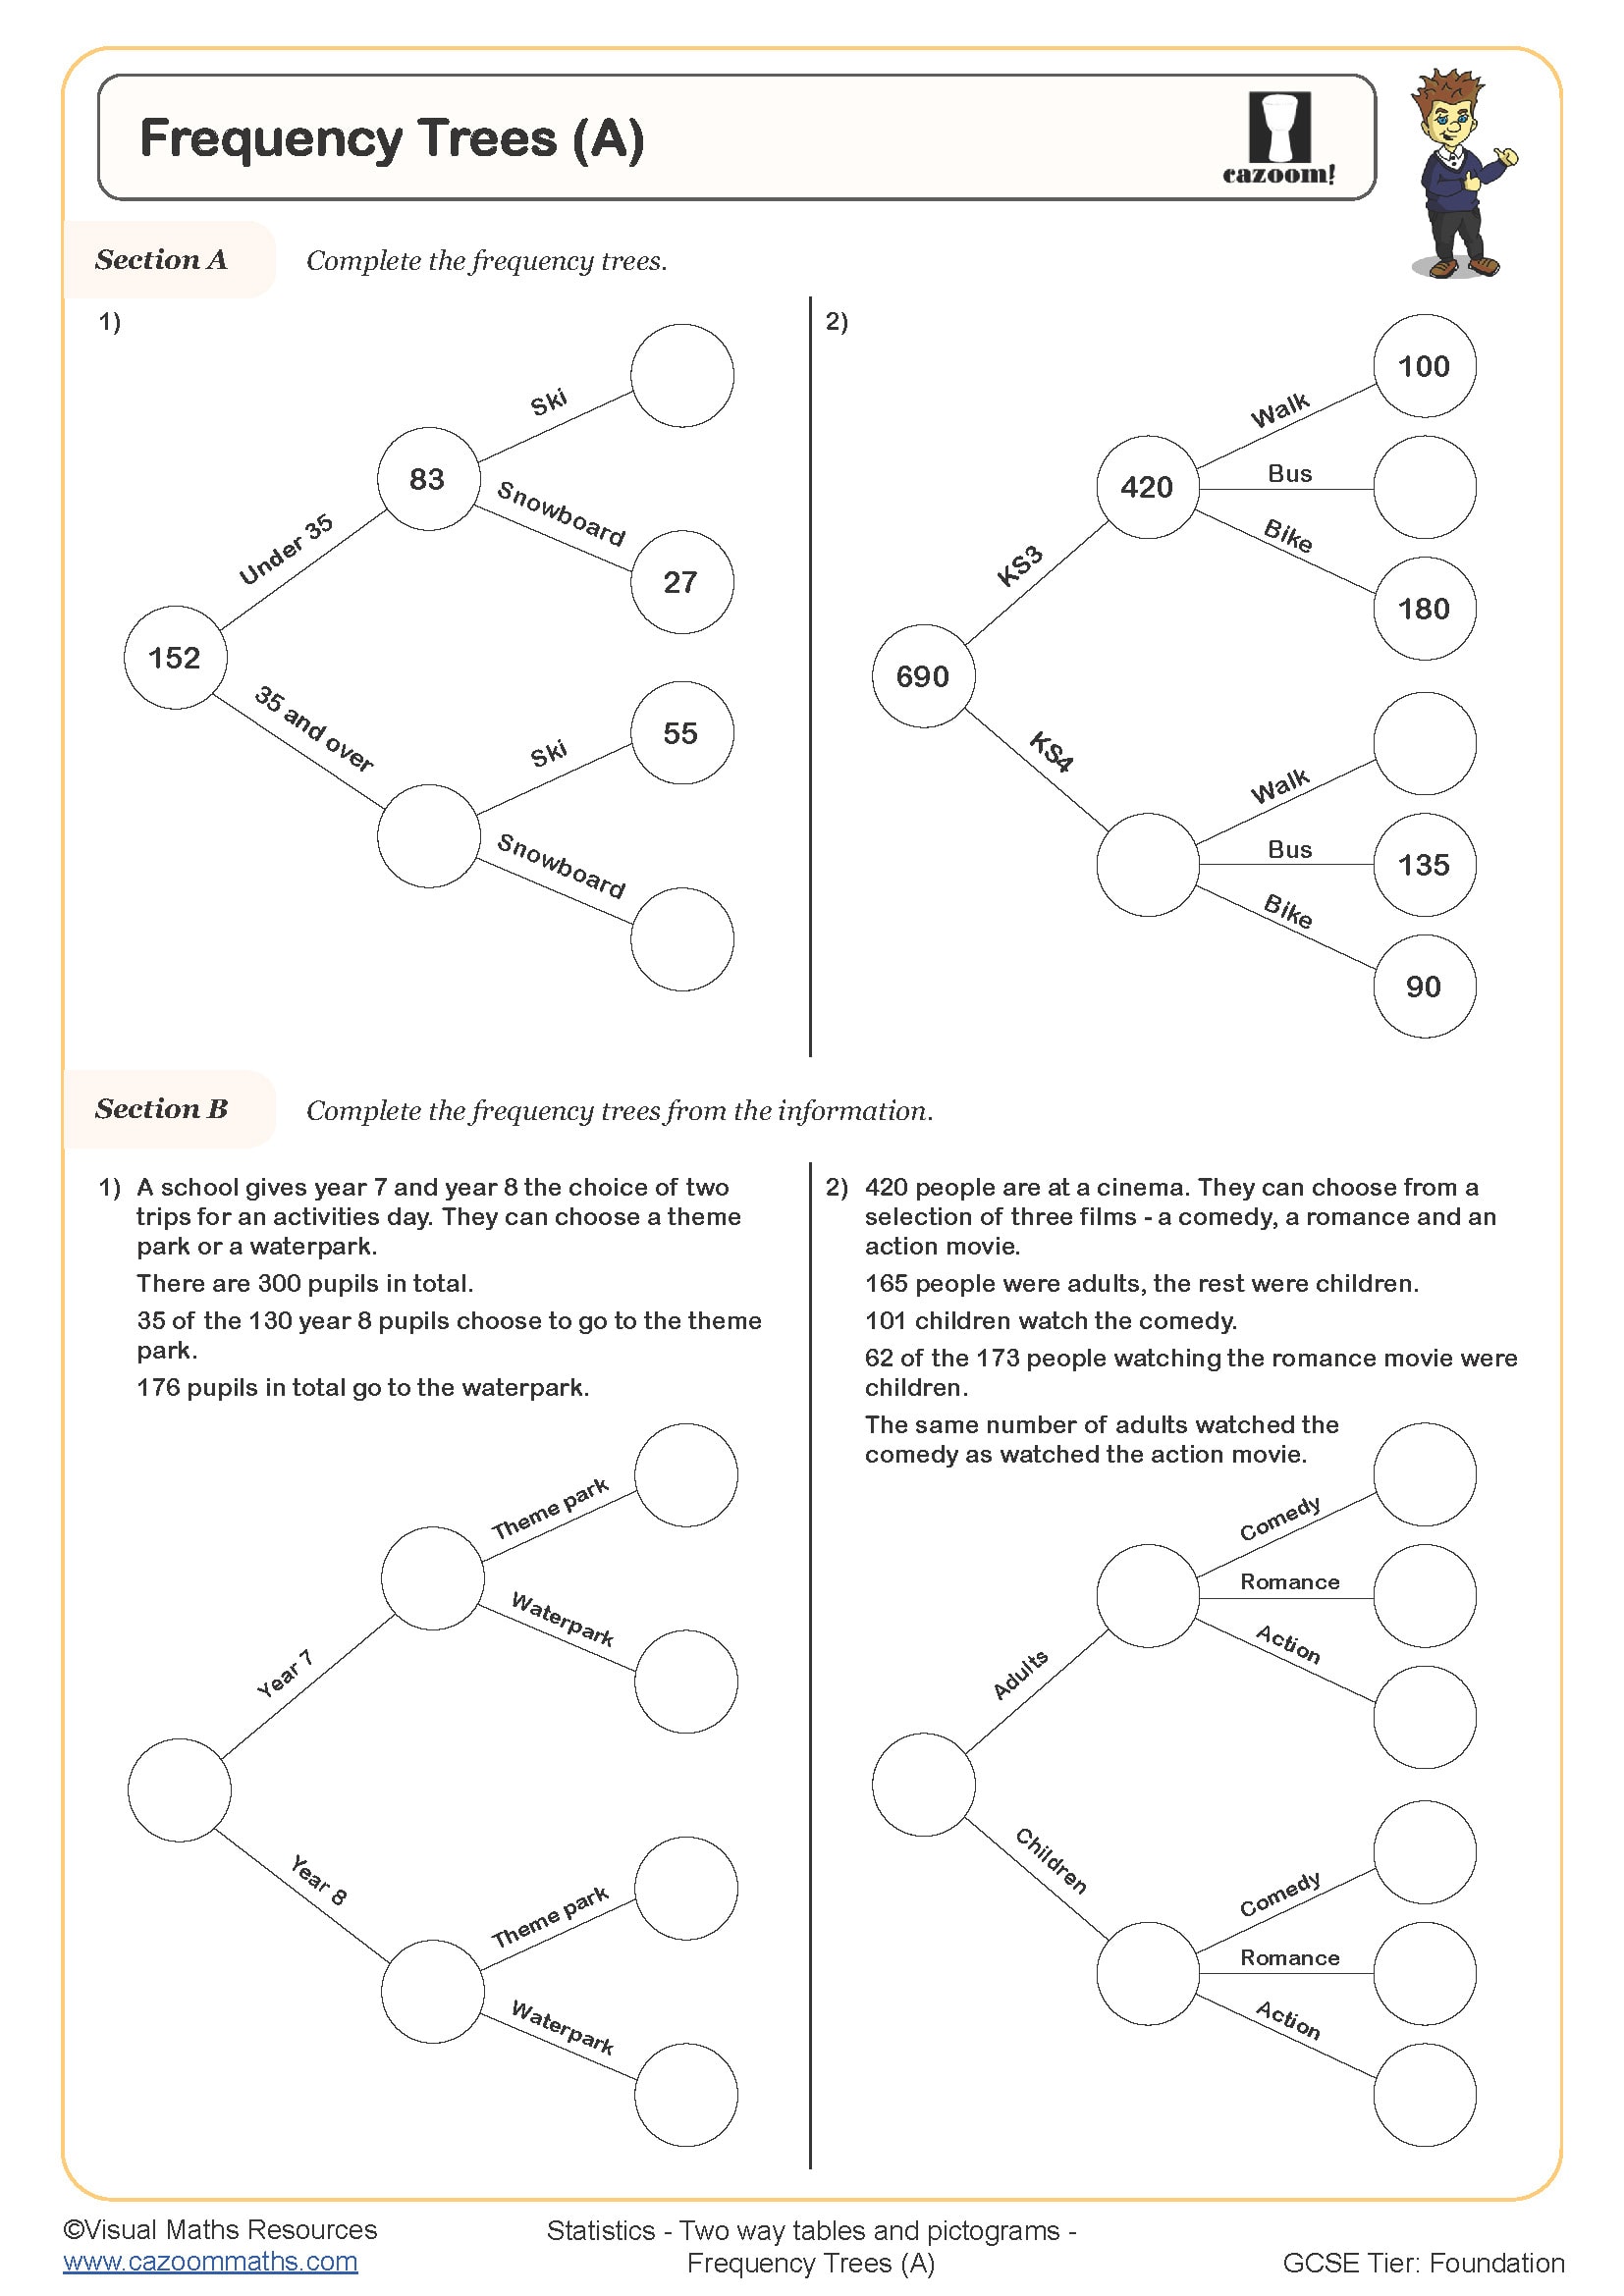
Frequency Trees (A)
Year groups: 7, 8
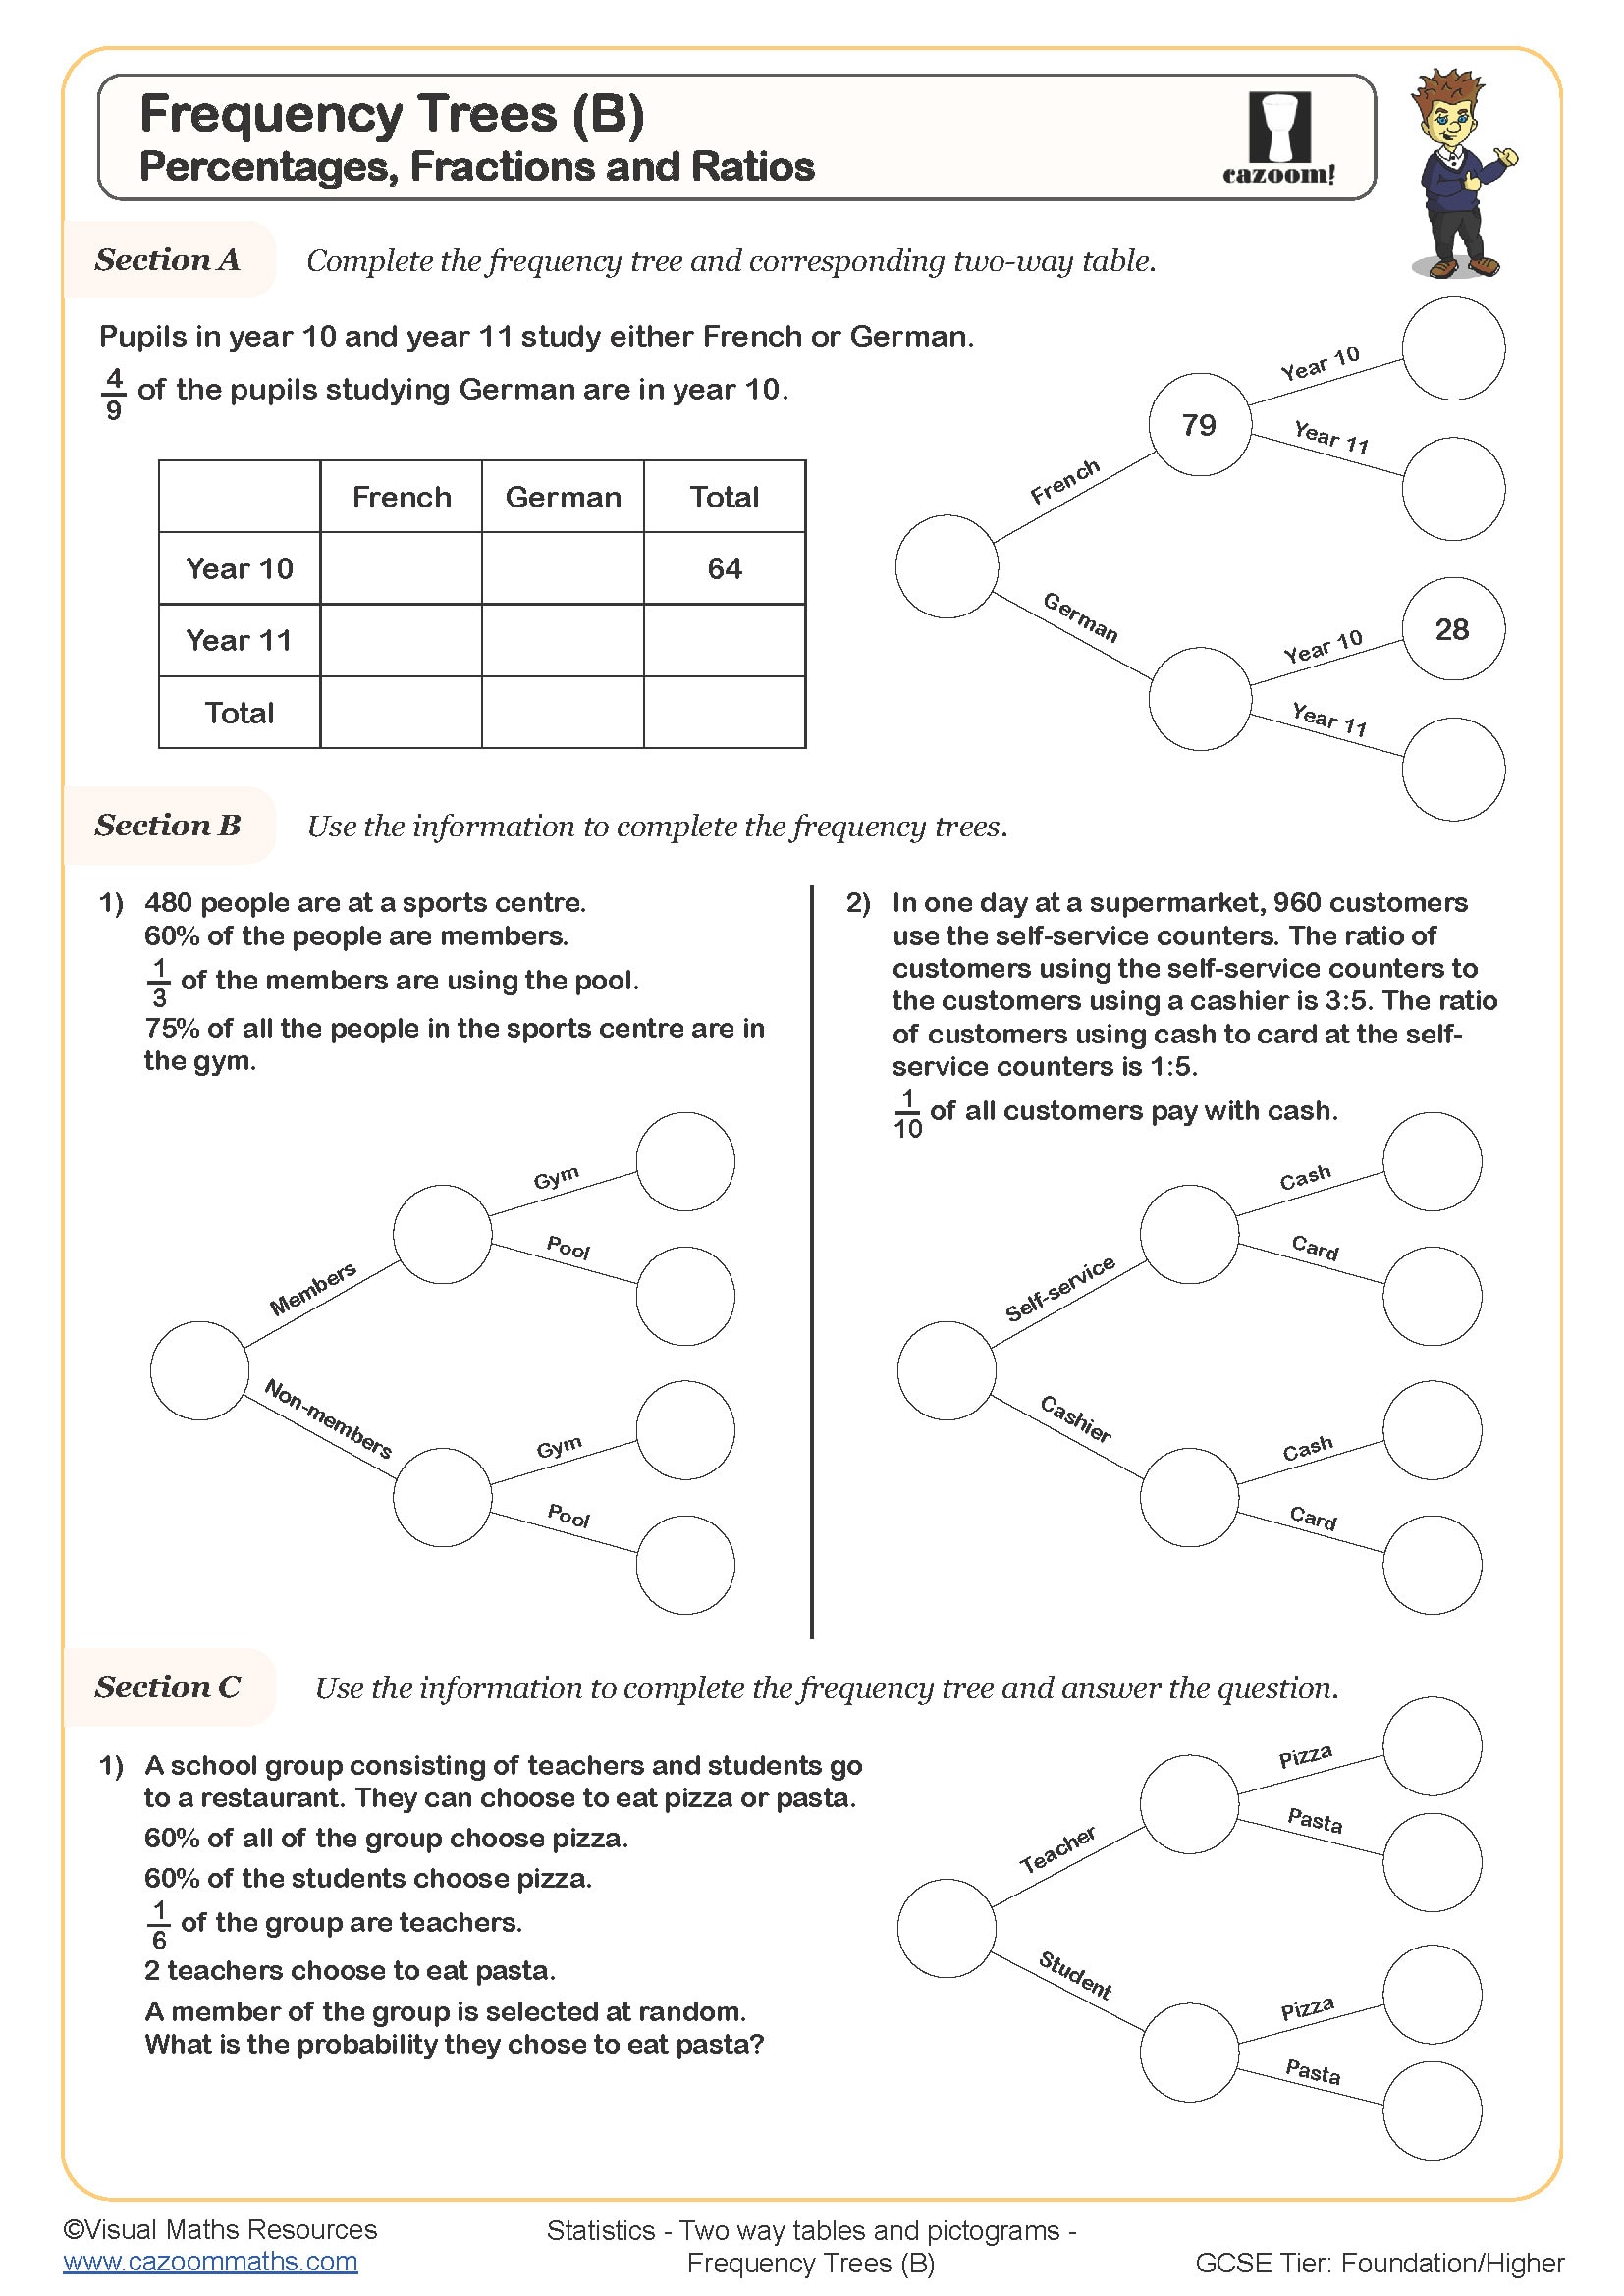
Frequency Trees (B)
Year groups: 7, 8
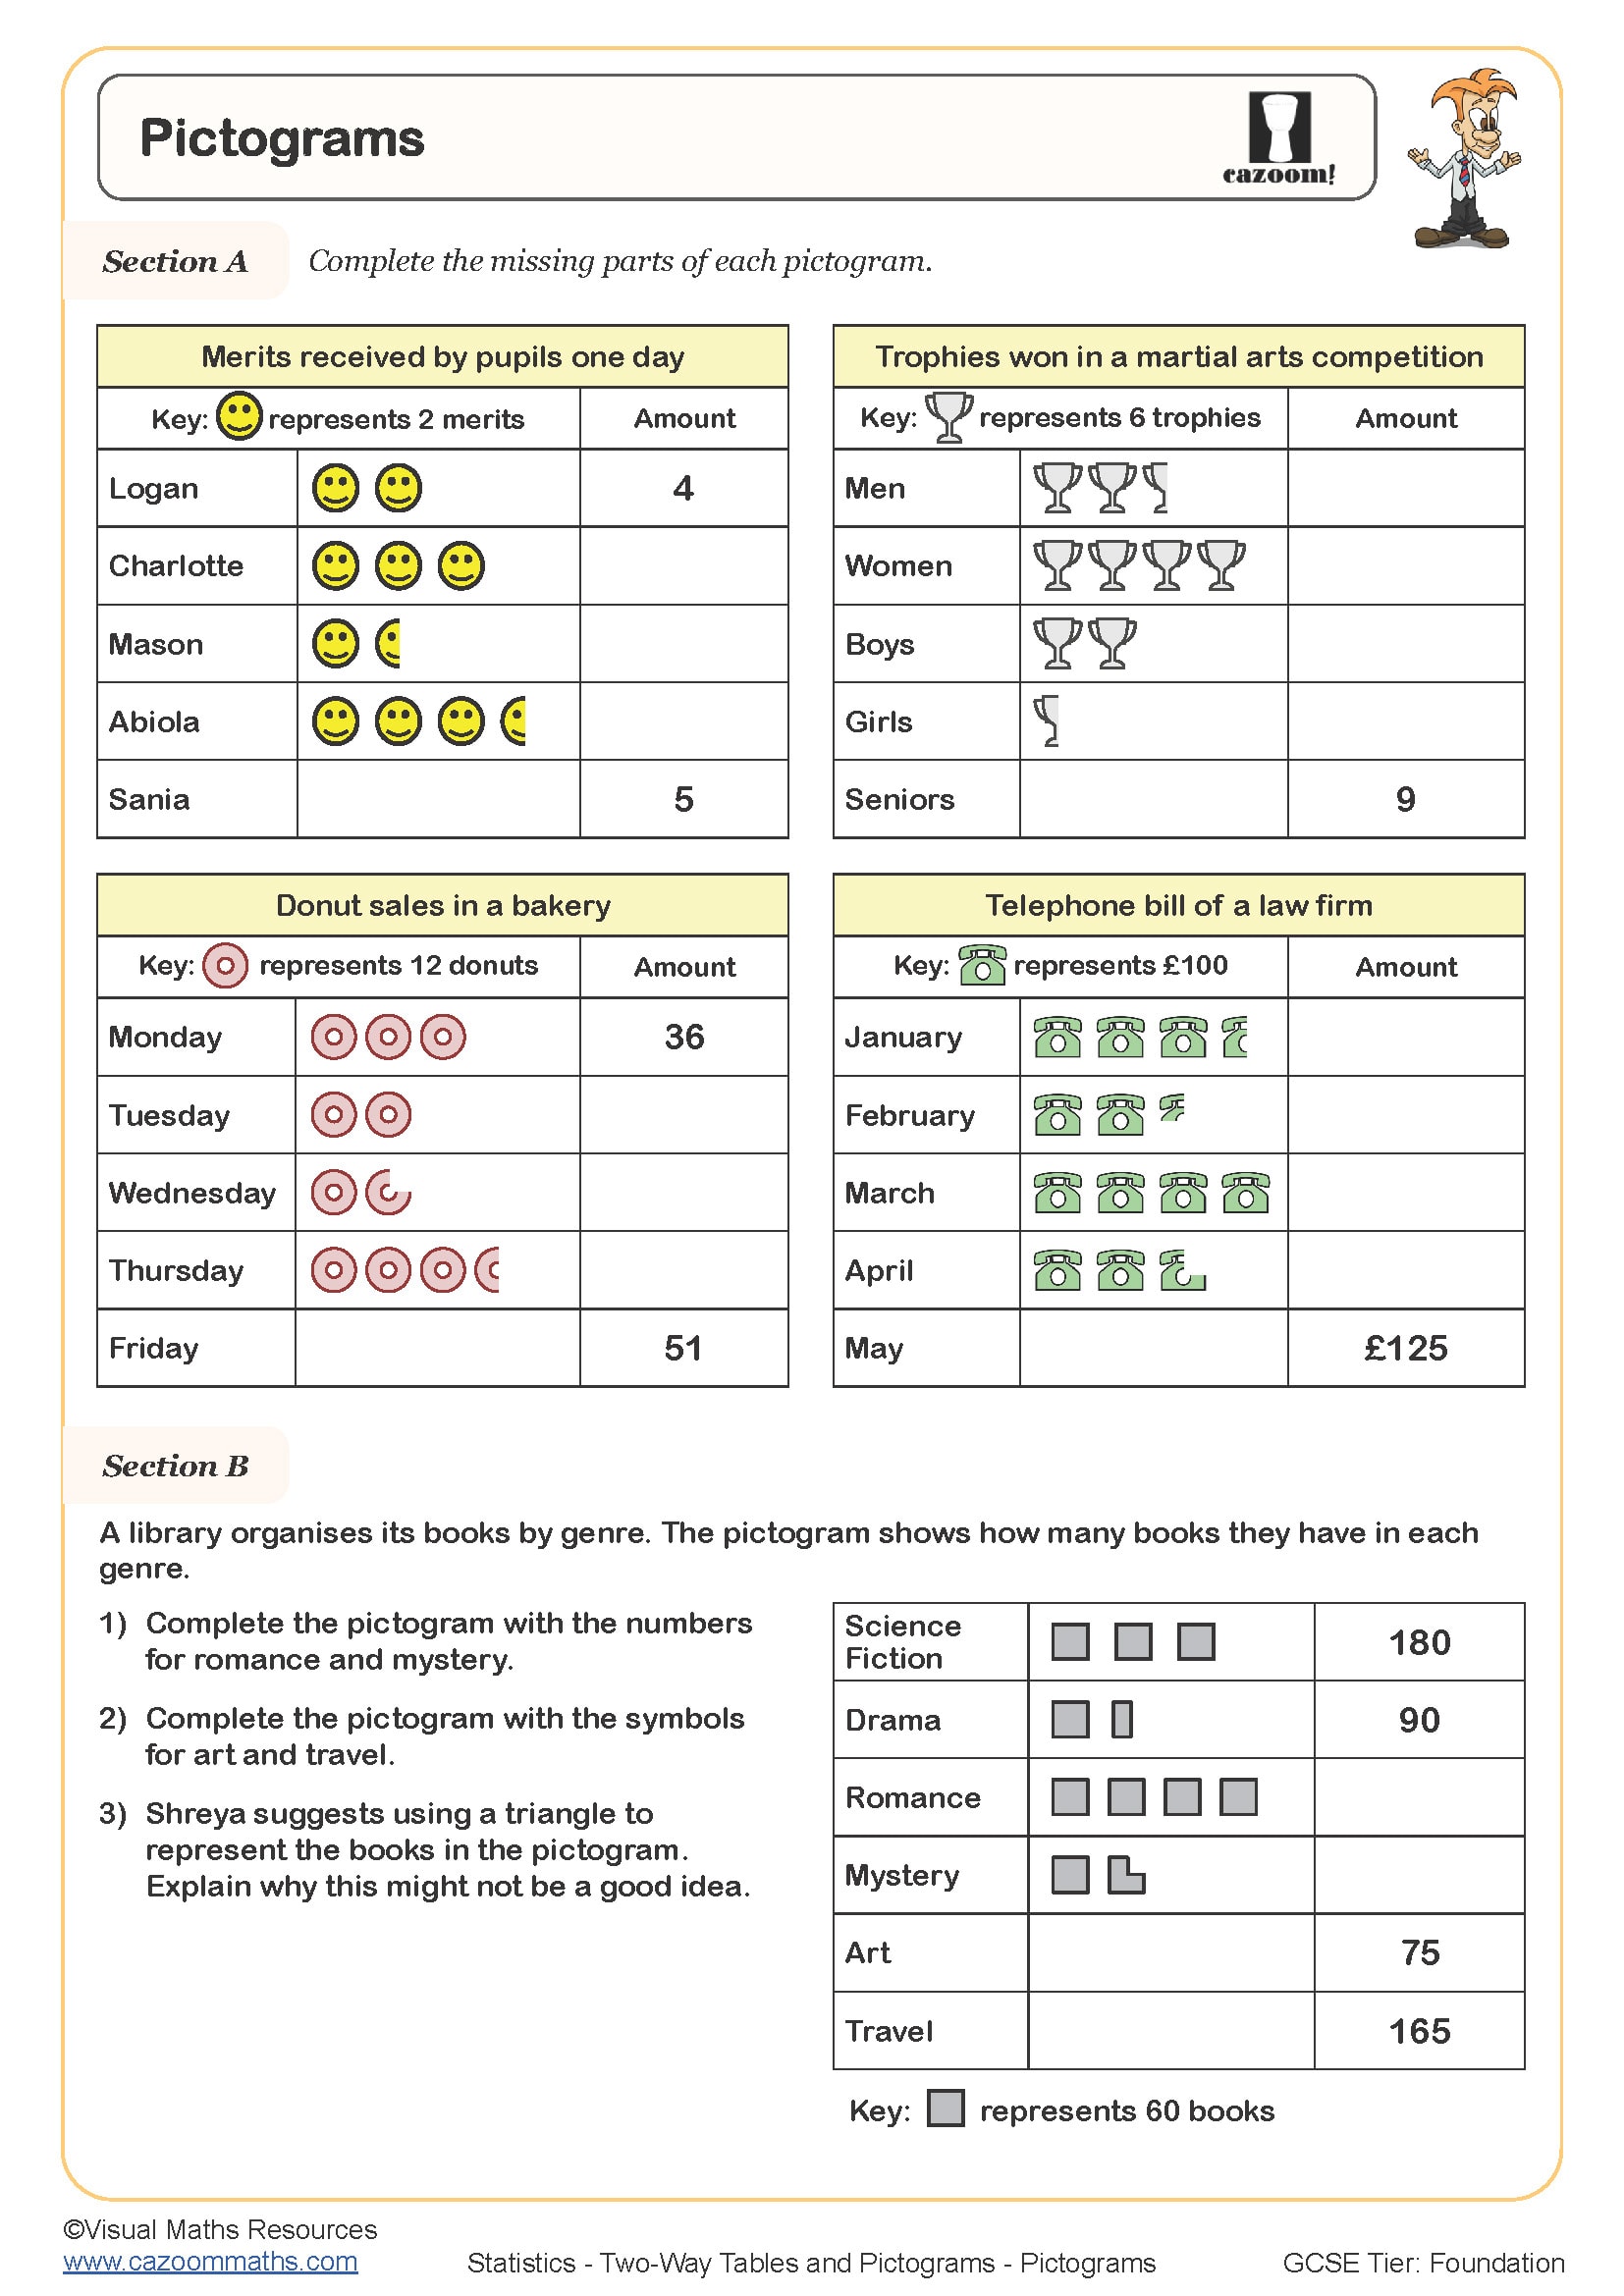
Pictograms
Year groups: 7, 8
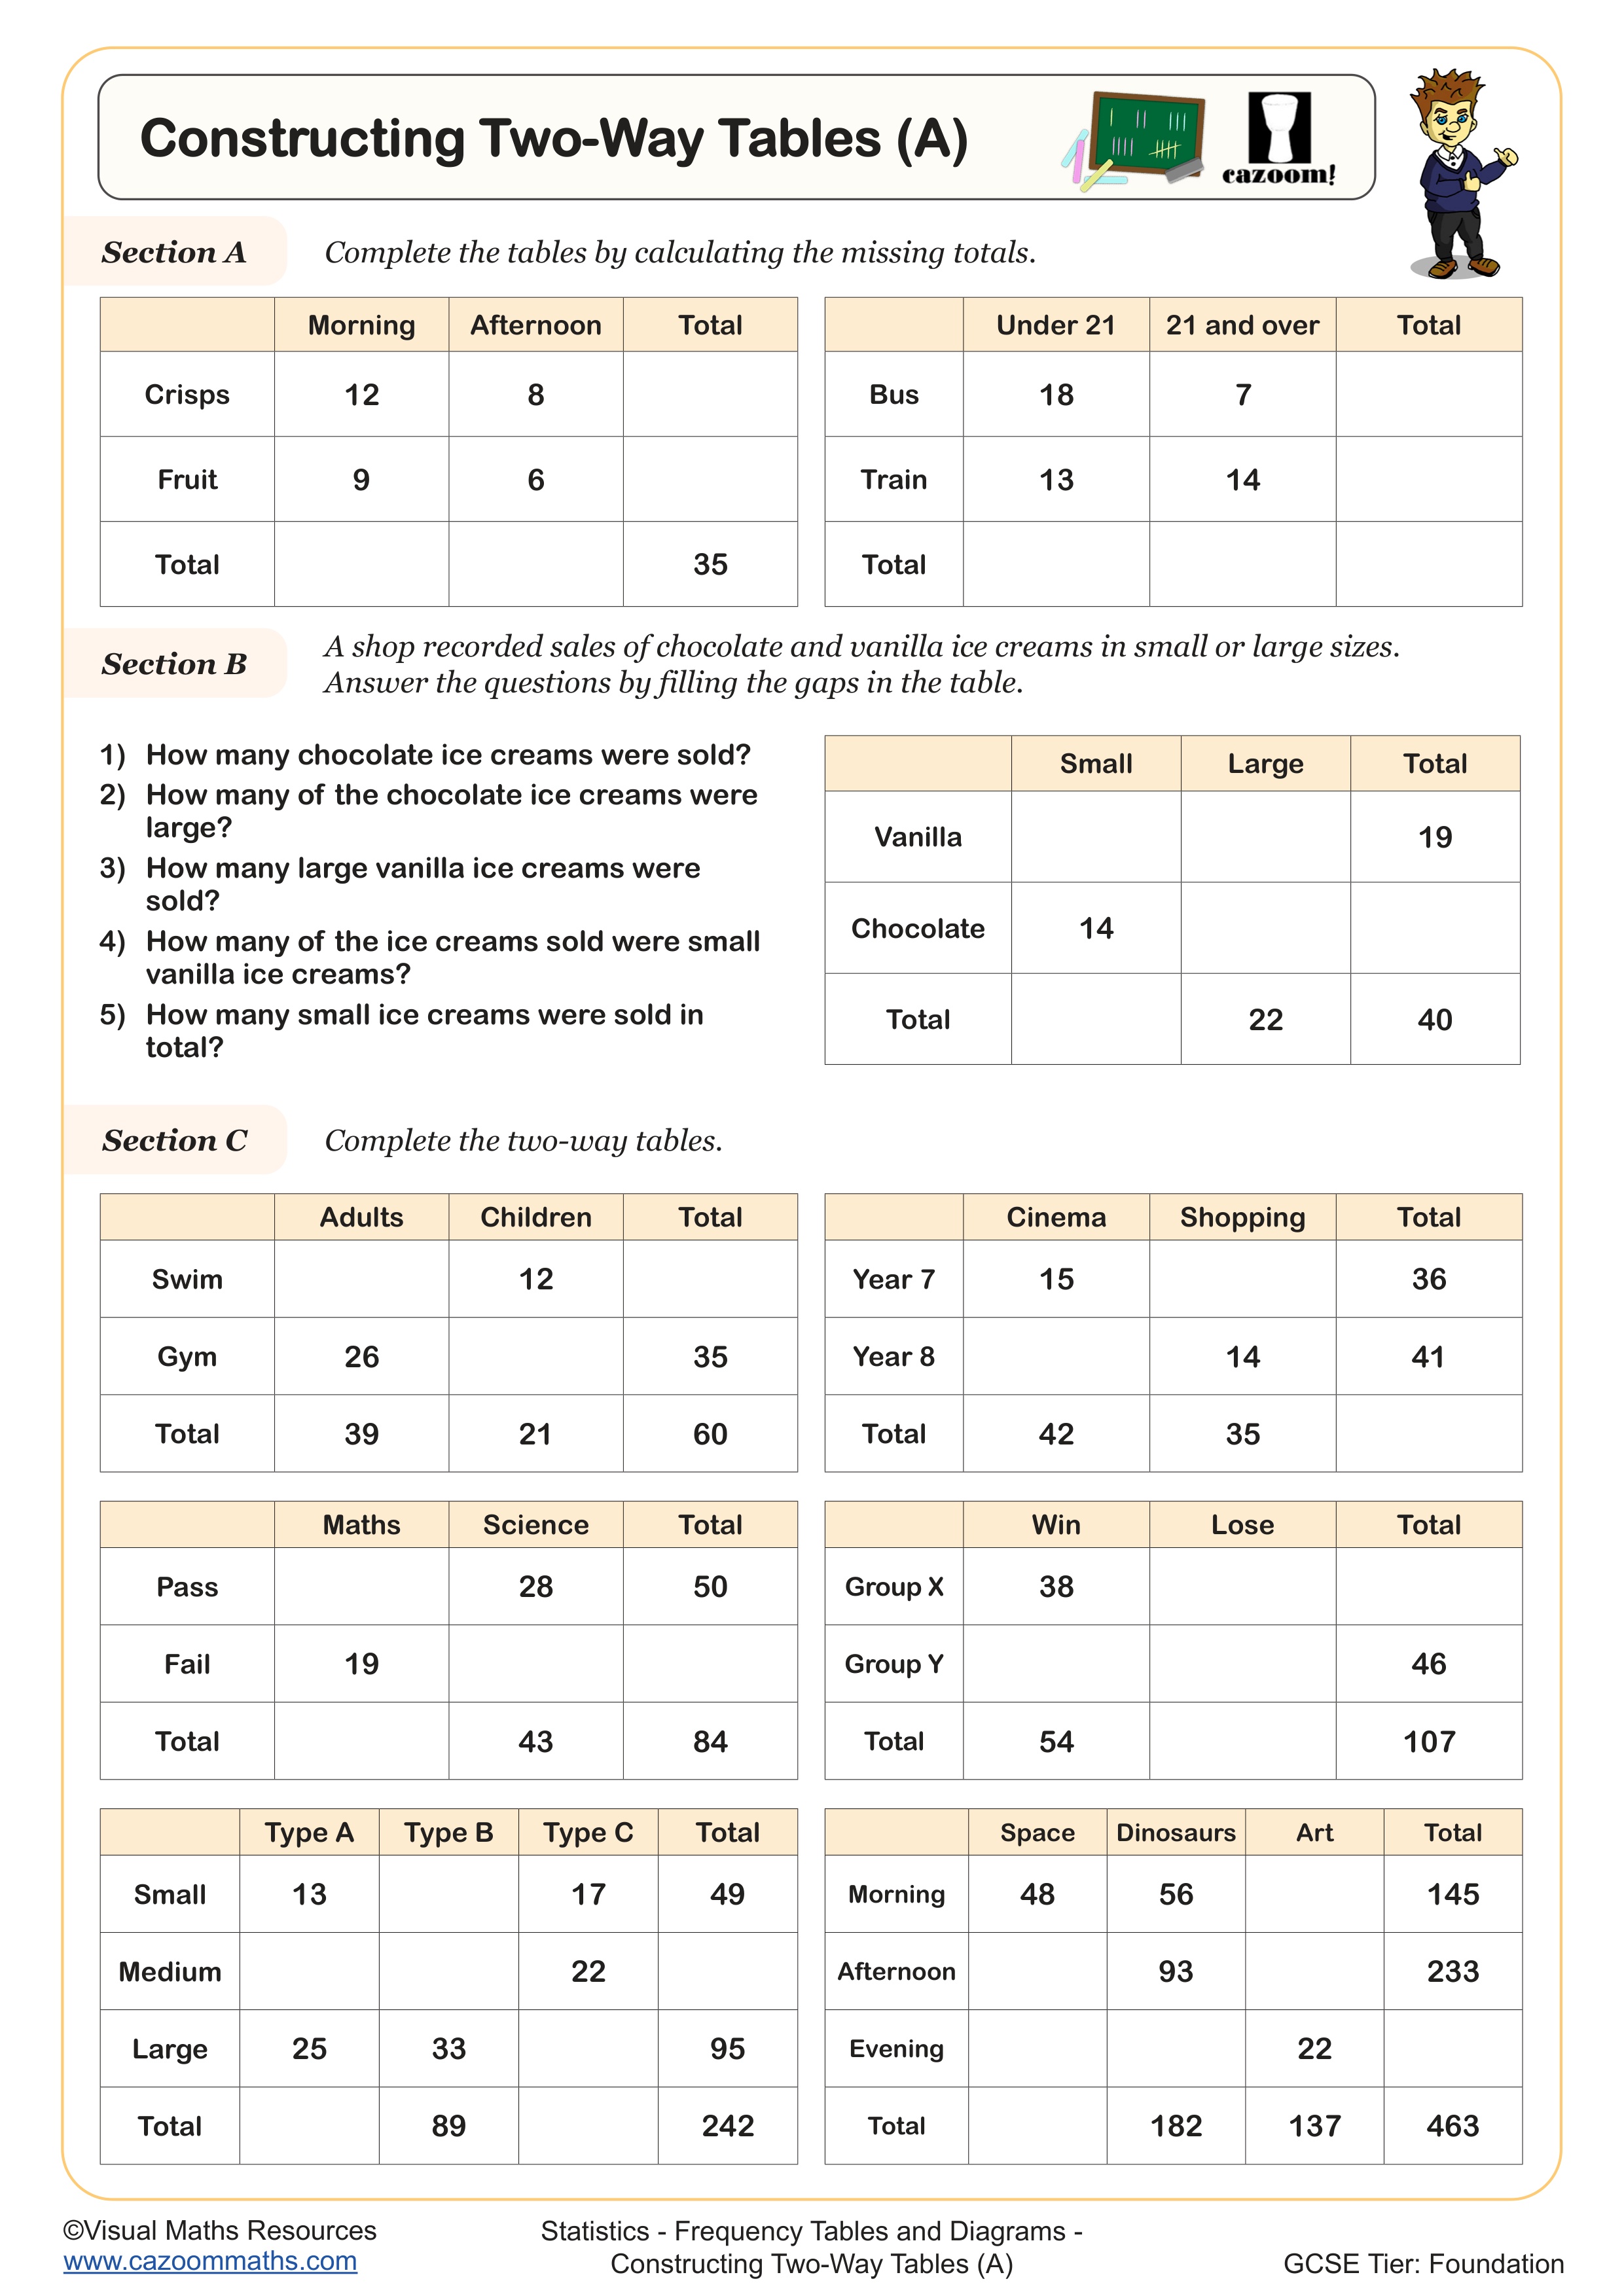
Constructing Two-Way Tables (A)
Year groups: 8, 9
Constructing Two-Way Tables (B)
Year groups: 8, 9
-Questions-Worksheet.jpg?w=3840)
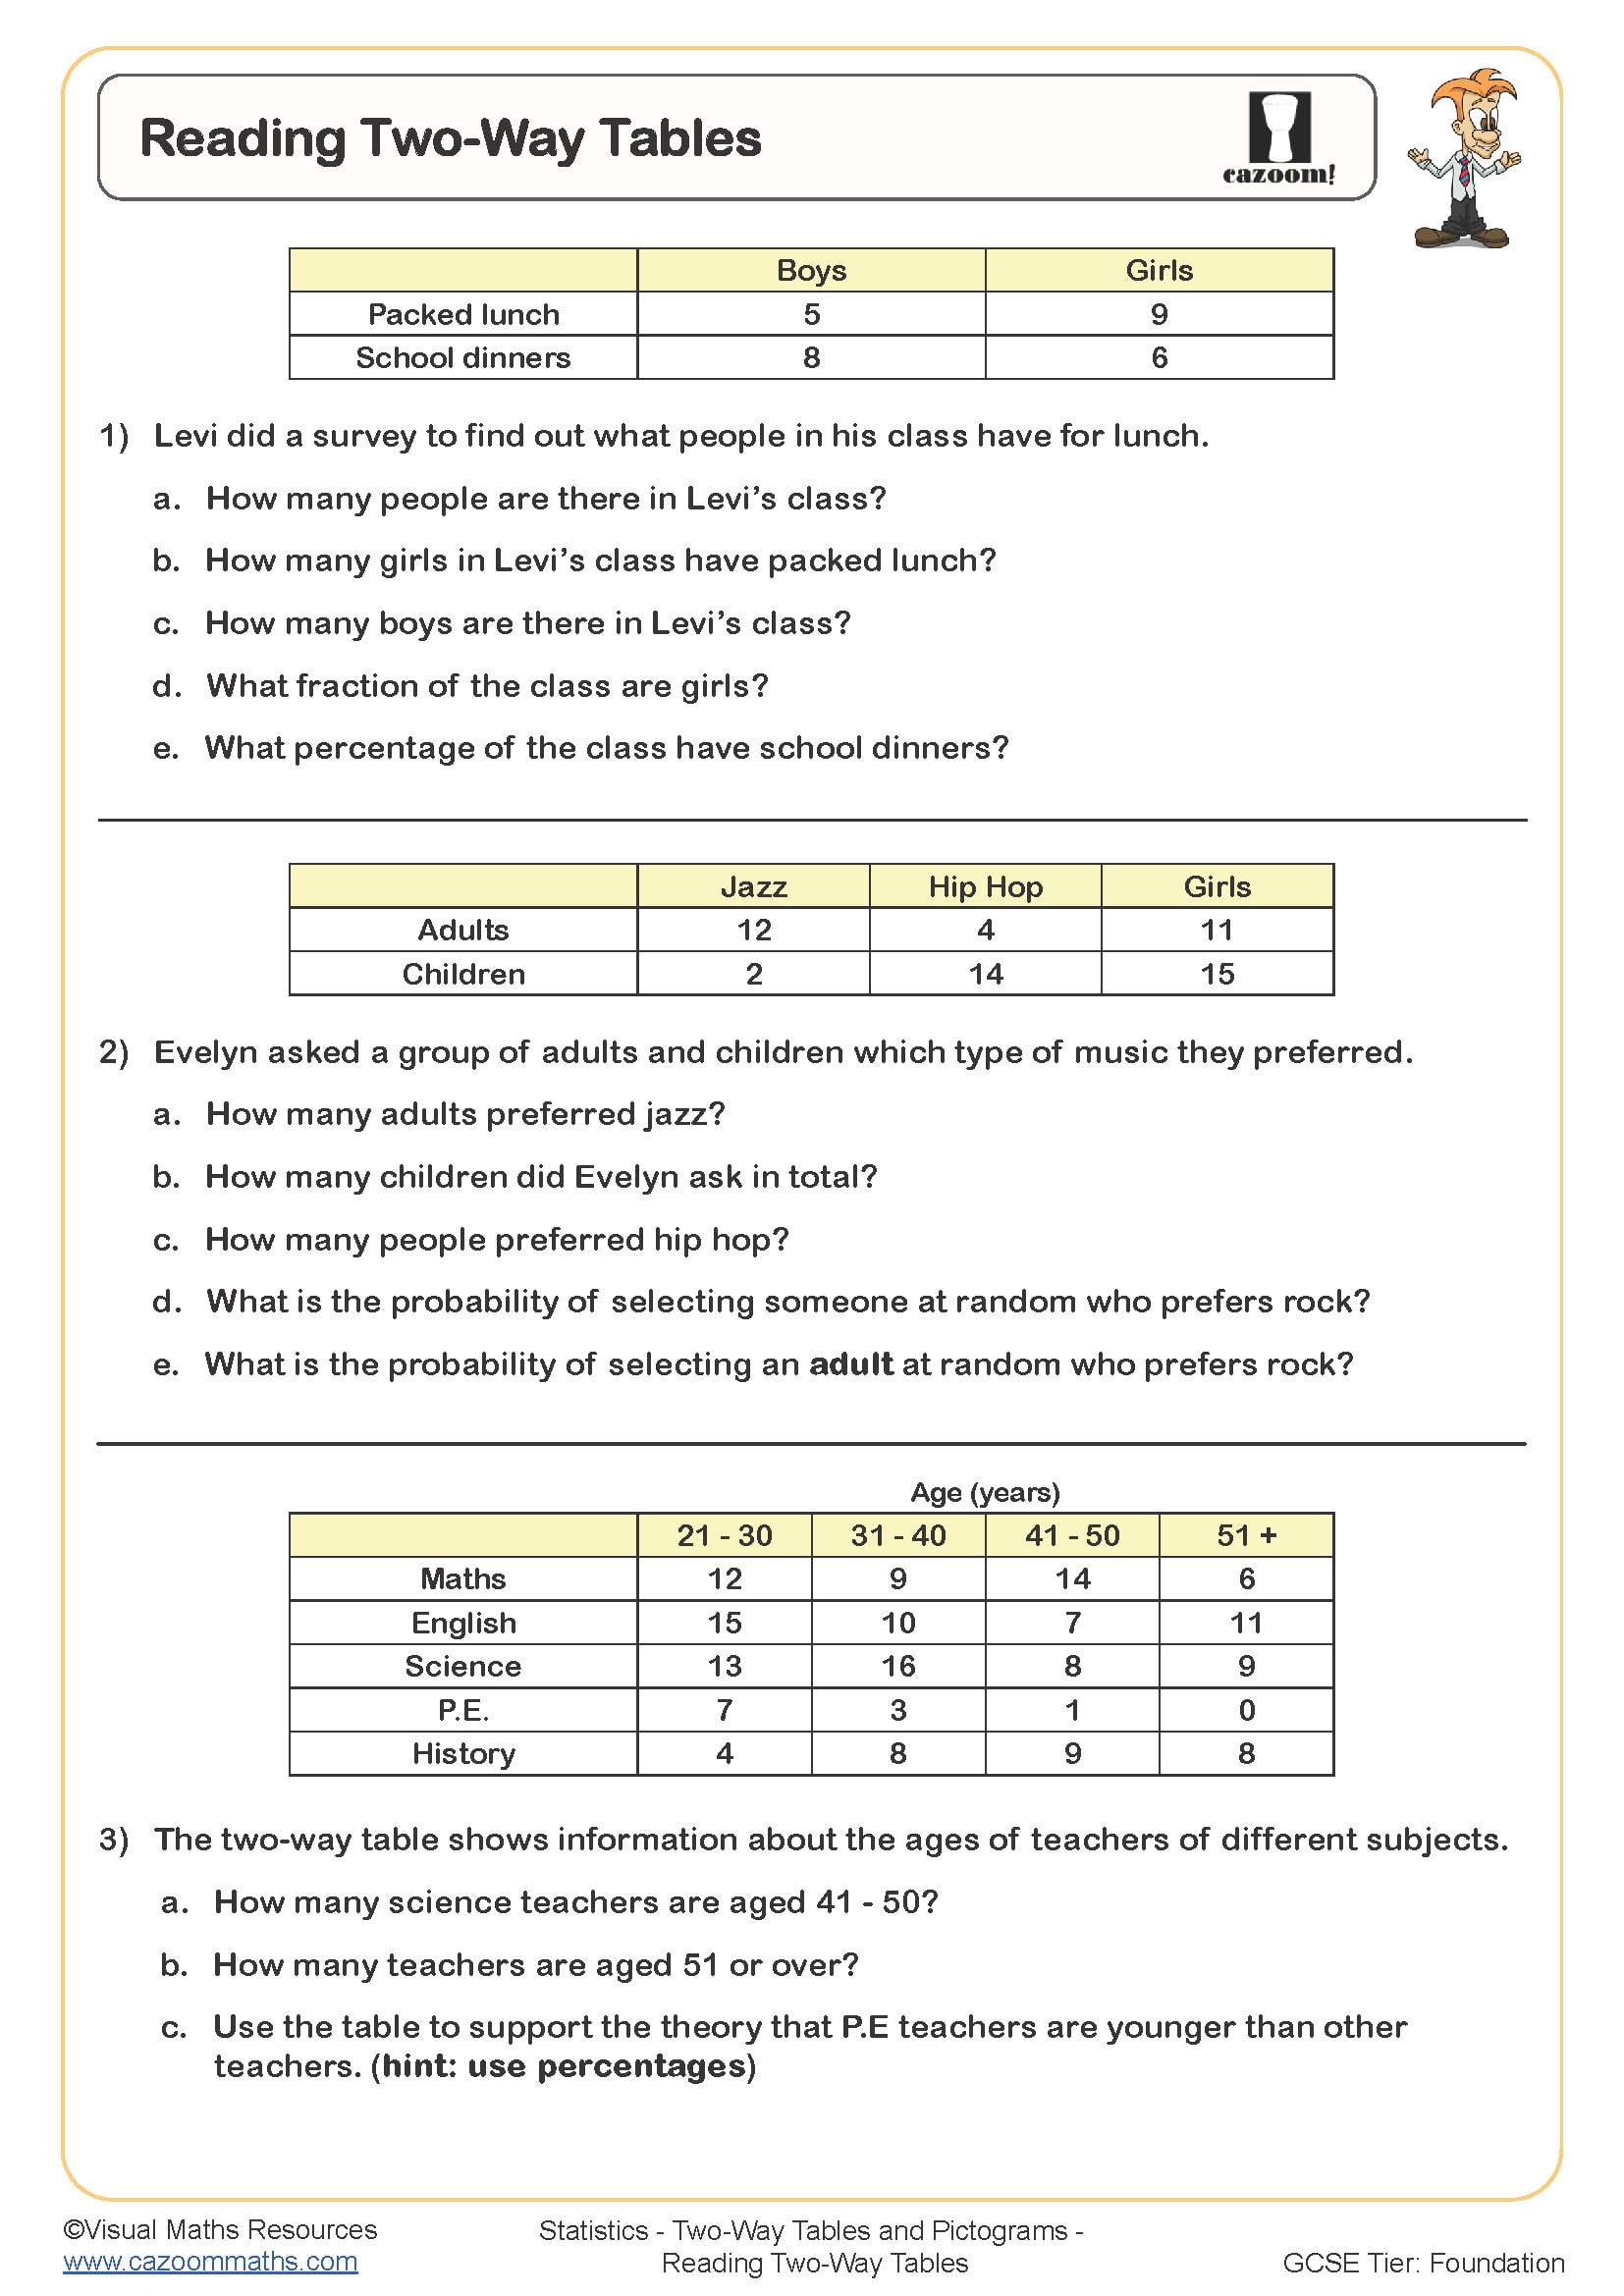
Reading Two-way Tables
Year groups: 8, 9
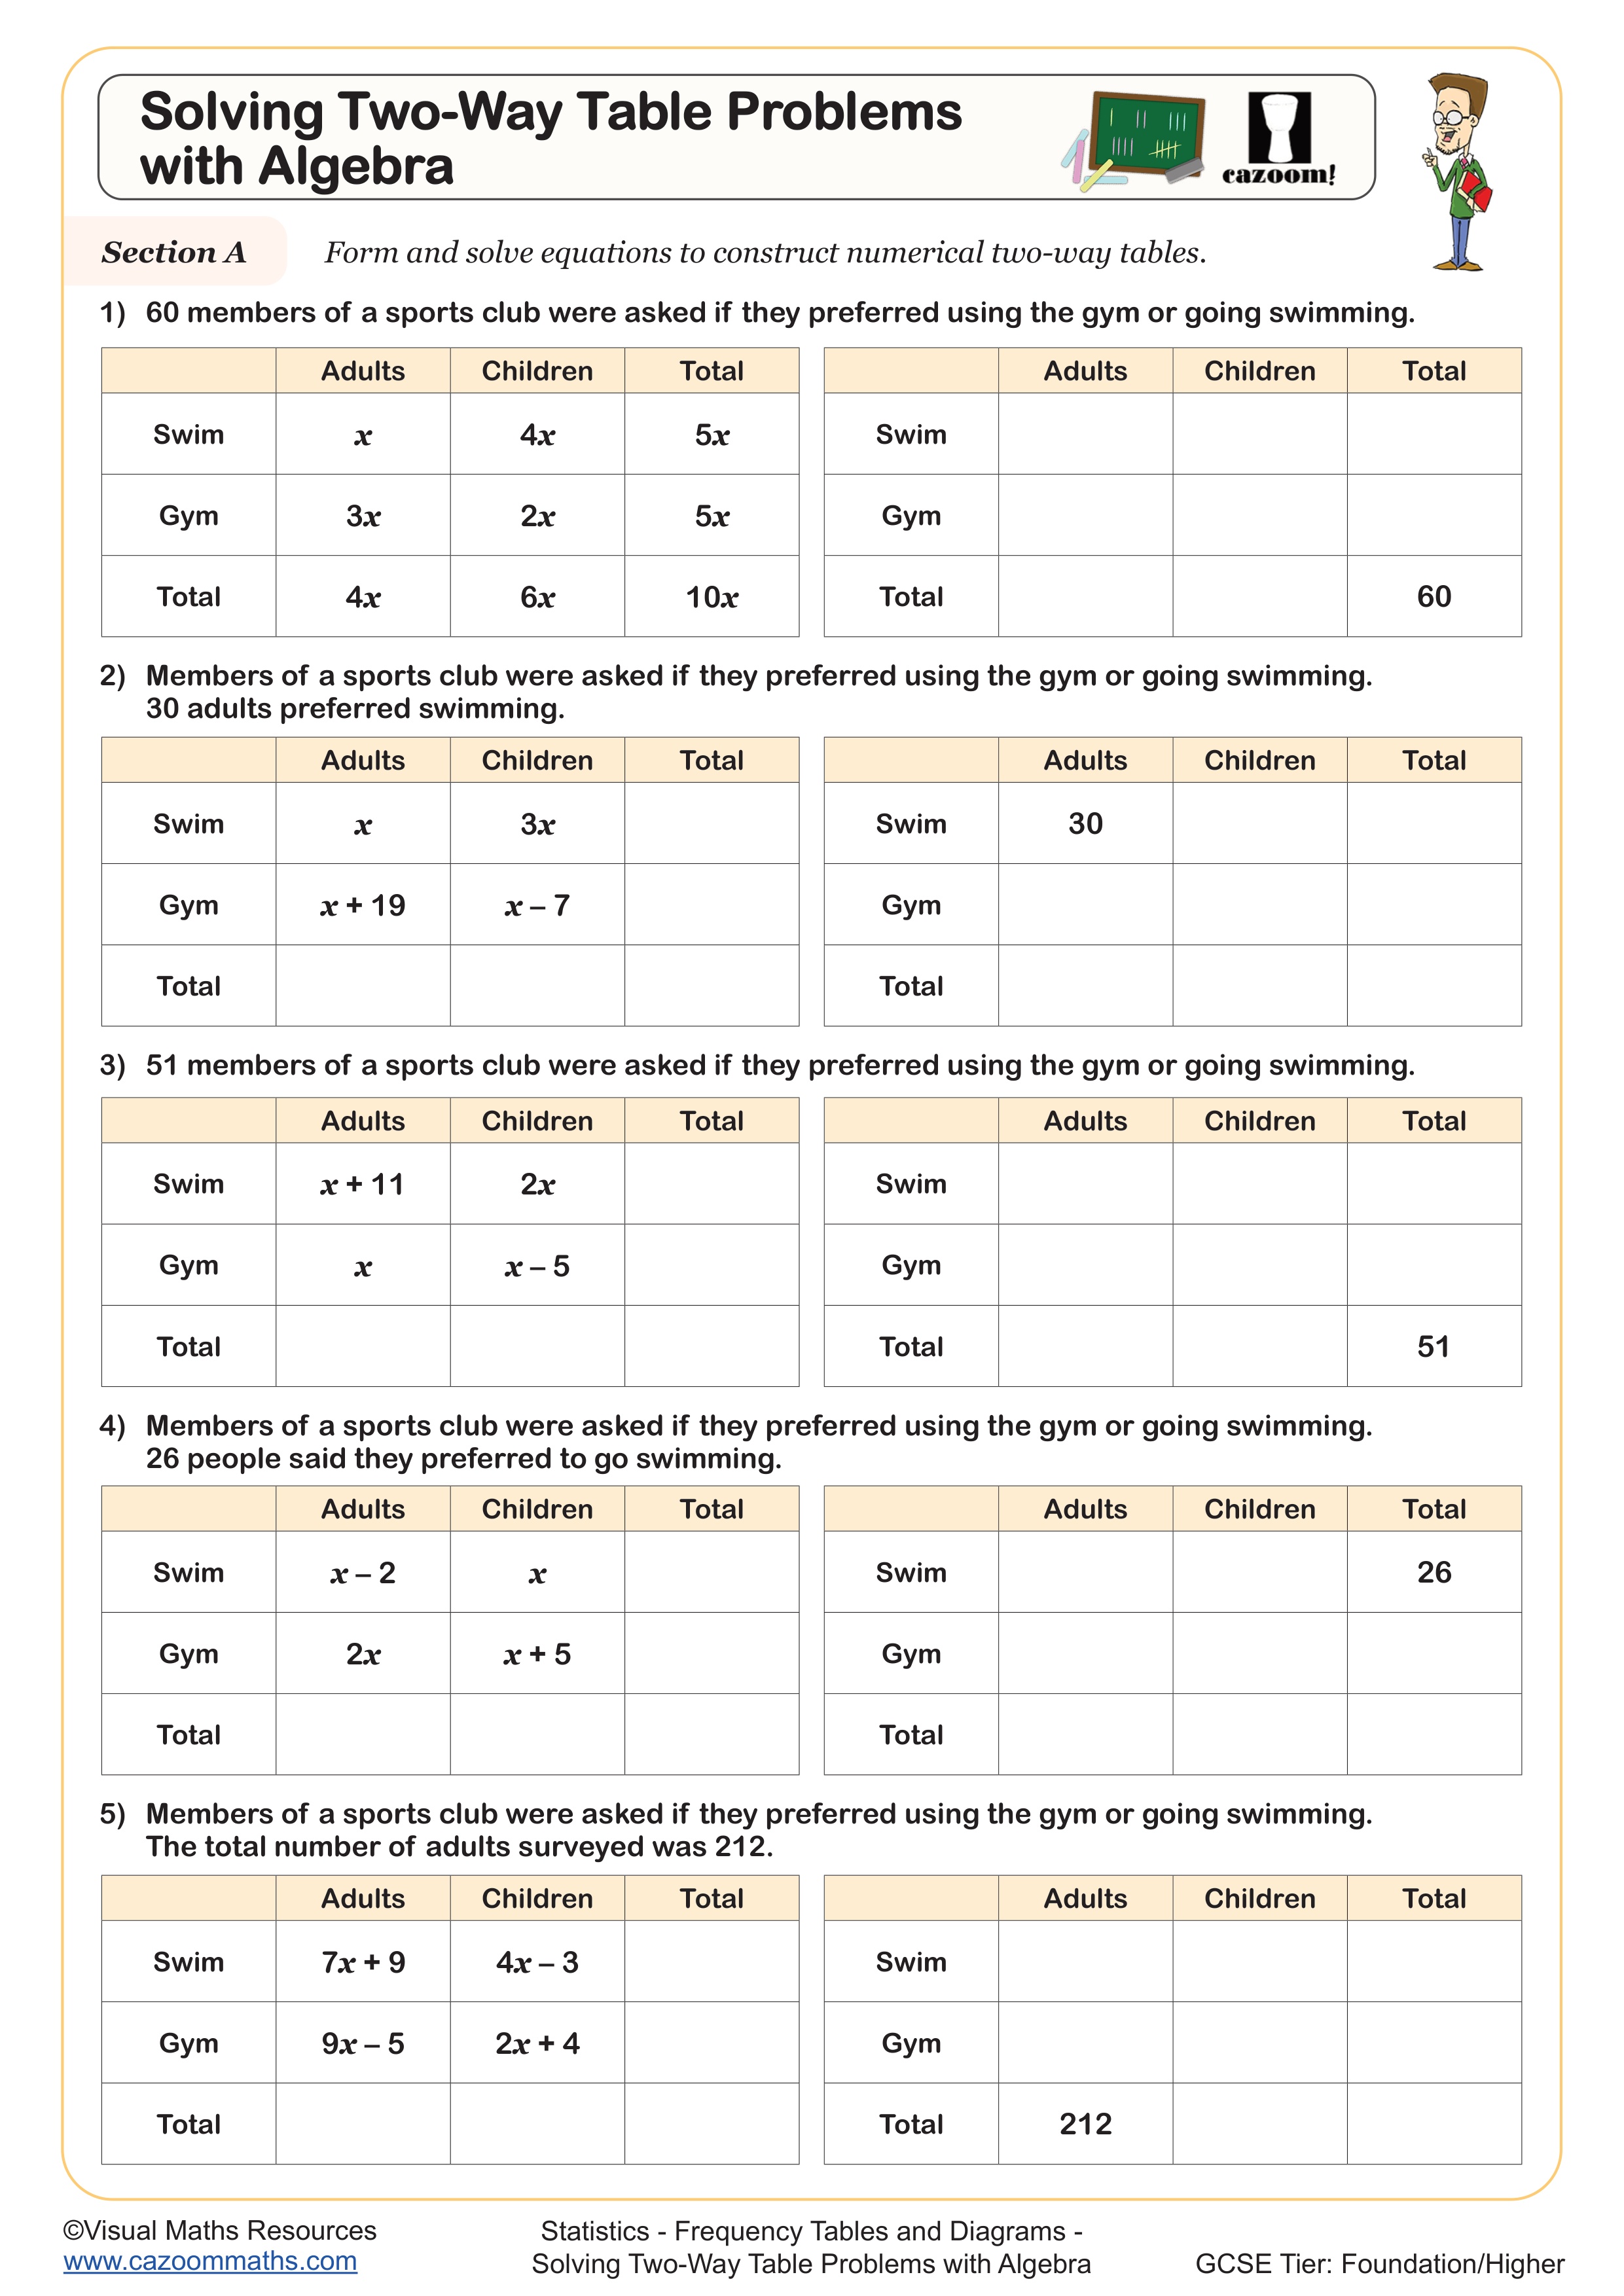
Solving Two-Way Table Problems with Algebra
Year groups: 8, 9
Two-Way Tables and Ratio
Year groups: 8, 9

All worksheets are created by the team of experienced teachers at Cazoom Maths.
Printable Worksheets for Two-Way Tables and Pictograms with Answers
Download our printable PDF Two-Way Tables and Pictograms worksheets with answers to help your children practise important statistics skills. Each of our worksheets are created by maths experts and includes clear instructions and simple examples to guide your KS3 students through the process. Learners will be able to solve different types of statistical equations using tables and pictograms. These worksheets are therefore perfect for teachers, parents, and tutors looking for structured and effective practice. Hence, with regular use, your children gain confidence in working with data and answering exam-style questions accurately.
What Are Two-Way Tables and Pictograms?
Two-way table is a core statistical concept that is used to display and compare two sets of related information. These concepts help your young learners organise data in rows and columns, making it easier to find totals, compare categories, and spot patterns. On the other hand, Pictograms use symbols or images to show data, helping students in Year 7, Year 8, and Year 9 understand quantities at a glance. Hence, learning how to use these concepts is an important part of the KS3 statistics curriculum. Our custom-made maths resources will support your pupils in becoming confident when working with data in a clear and structured way.
Why Learn About Two-Way Tables and Pictograms?
Understanding important statistical concepts like two-way tables and pictograms will help your students in KS3 develop core maths skills such as sorting data, identifying patterns, and answering questions accurately. These concepts are also useful in their progress in further maths skills like bar charts and different types of graphs. Our maths worksheets help in breaking these concepts down into easy-to-understand small steps, making it easier for your students to follow and understand. With regular practice, your students will be able to improve their confidence, speed, and accuracy in data handling skills for exams and use in everyday life.
Real-Life Uses of Two-Way Tables and Pictograms
Two-way tables and pictograms are therefore really useful in our daily lives. These two core statistical concepts are used in real life to present data clearly. Let’s take a few real life examples: two-way tables are used in different types of surveys, creating a wide-range of reports, and timetables to compare different types of categories like age, gender, or preference. On the other hand, Pictograms are often used in schools, newspapers, and advertising to show results in a simple, eye-catching format. By practising our worksheets on a daily basis, your young pupils will gain the much-required practical skills to understand and create these types of diagrams. They’ll also be able to prepare and solve data-related problems in both maths and real-world situations.