Venn Diagrams Worksheets
All worksheets are created by the team of experienced teachers at Cazoom Maths.
What makes a good Venn diagrams worksheet for secondary students?
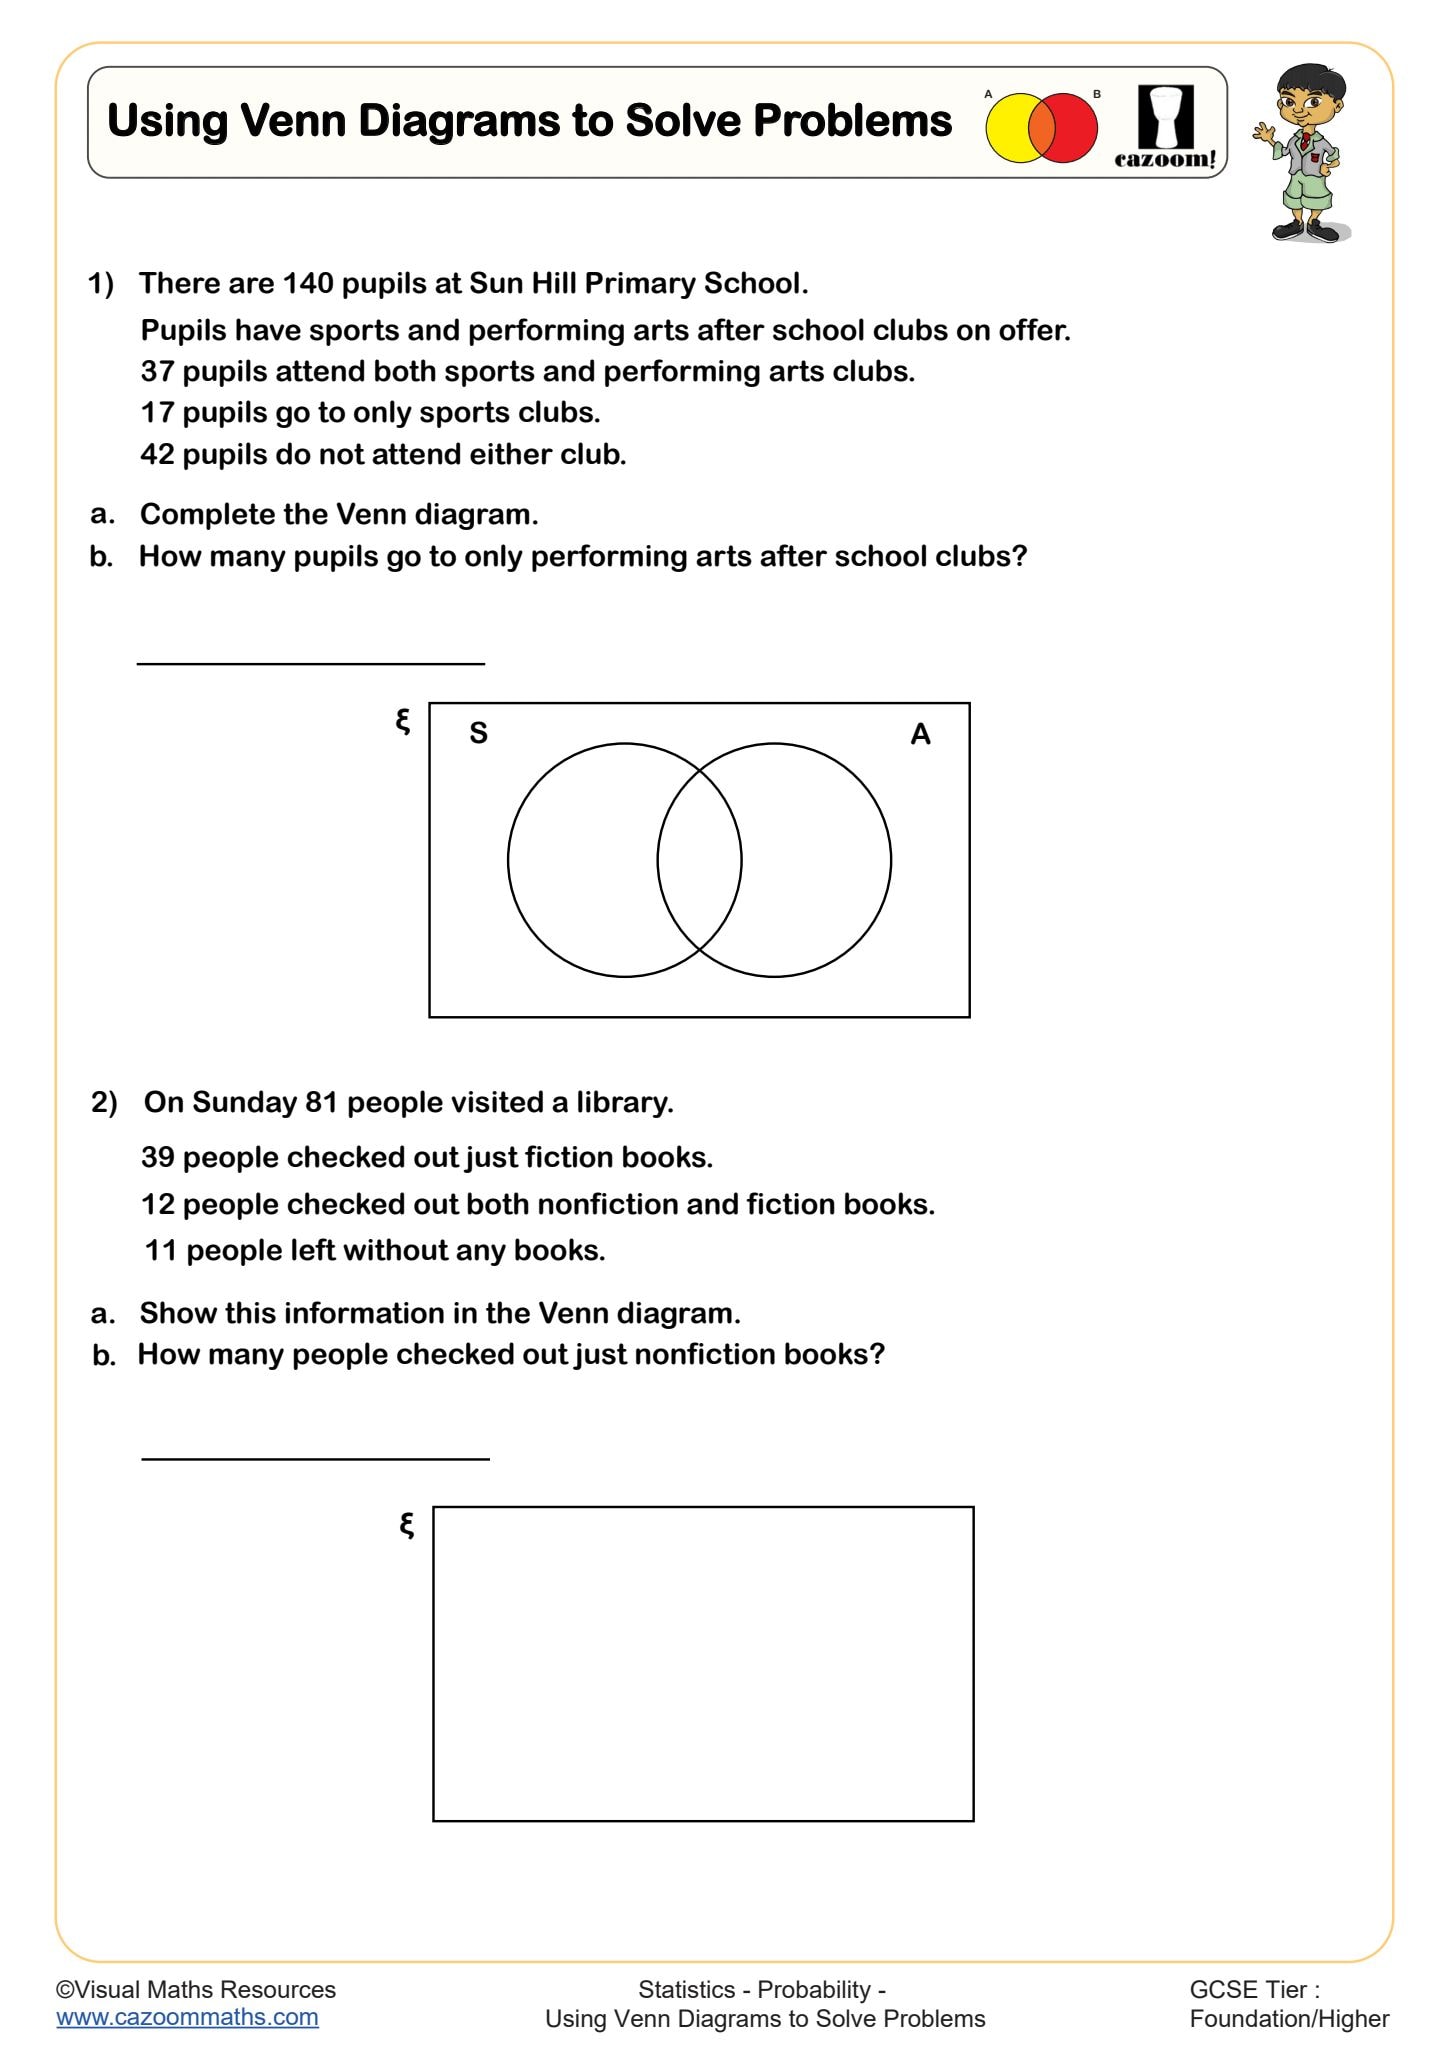
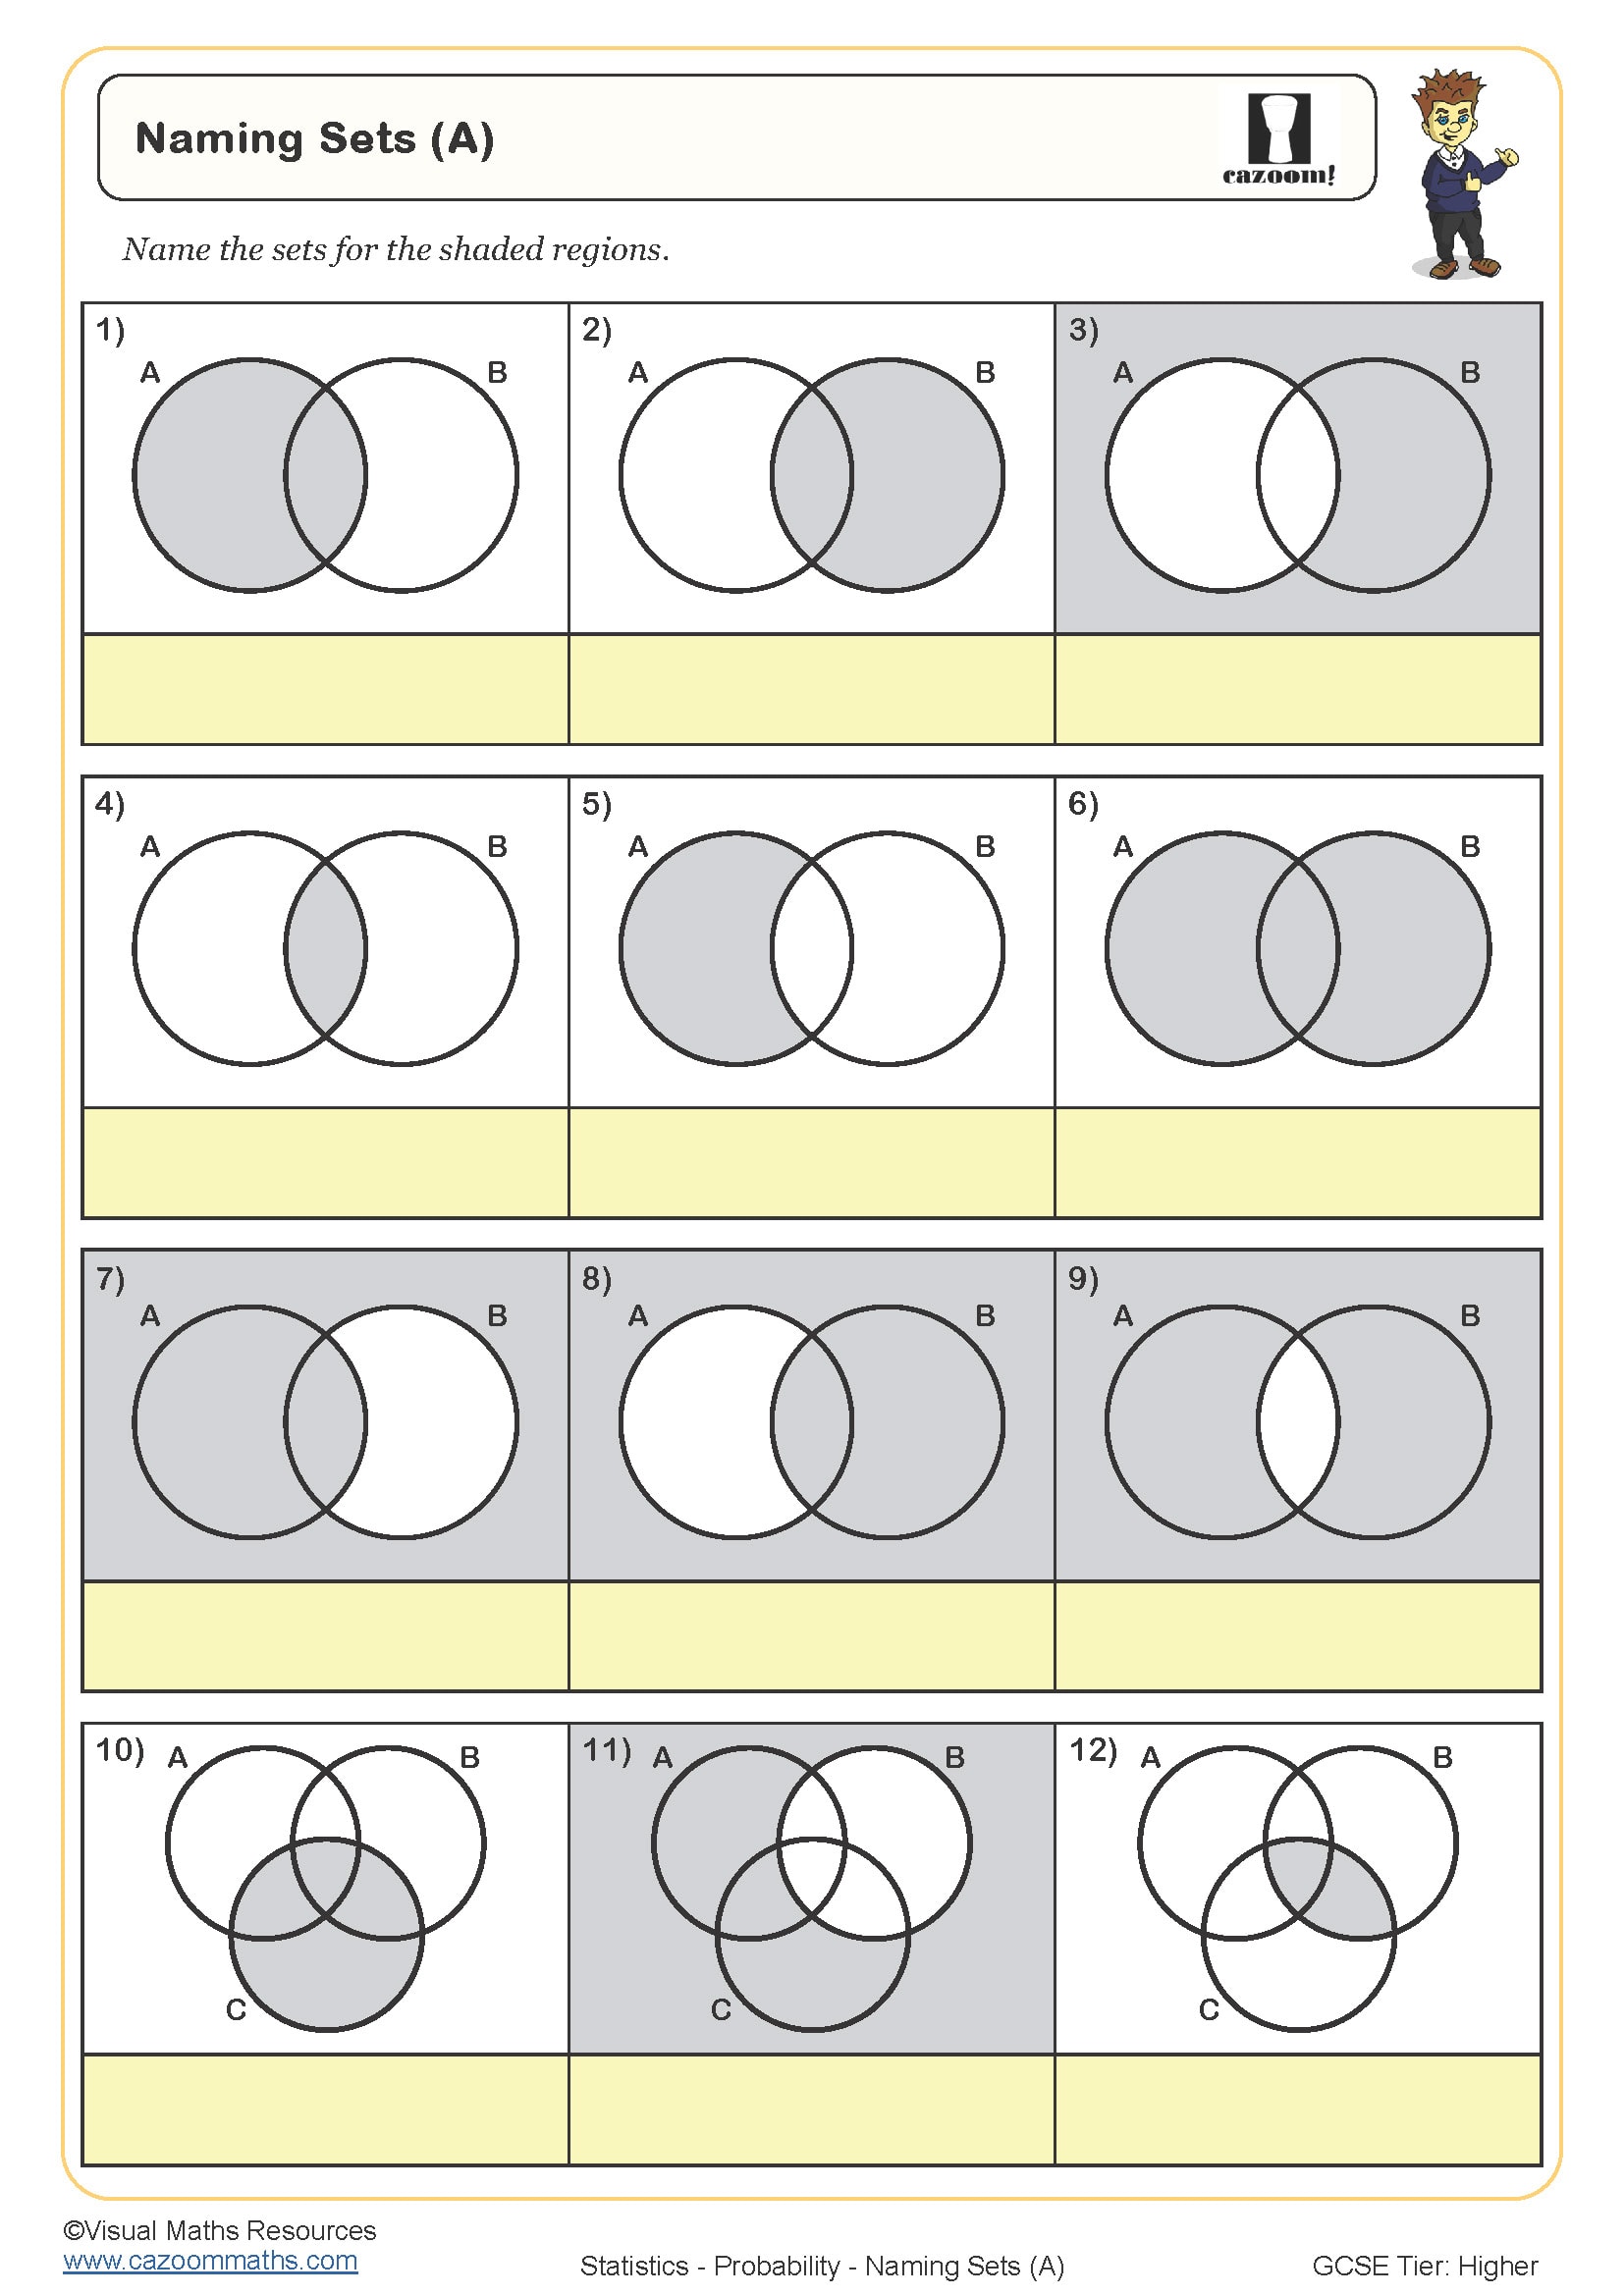
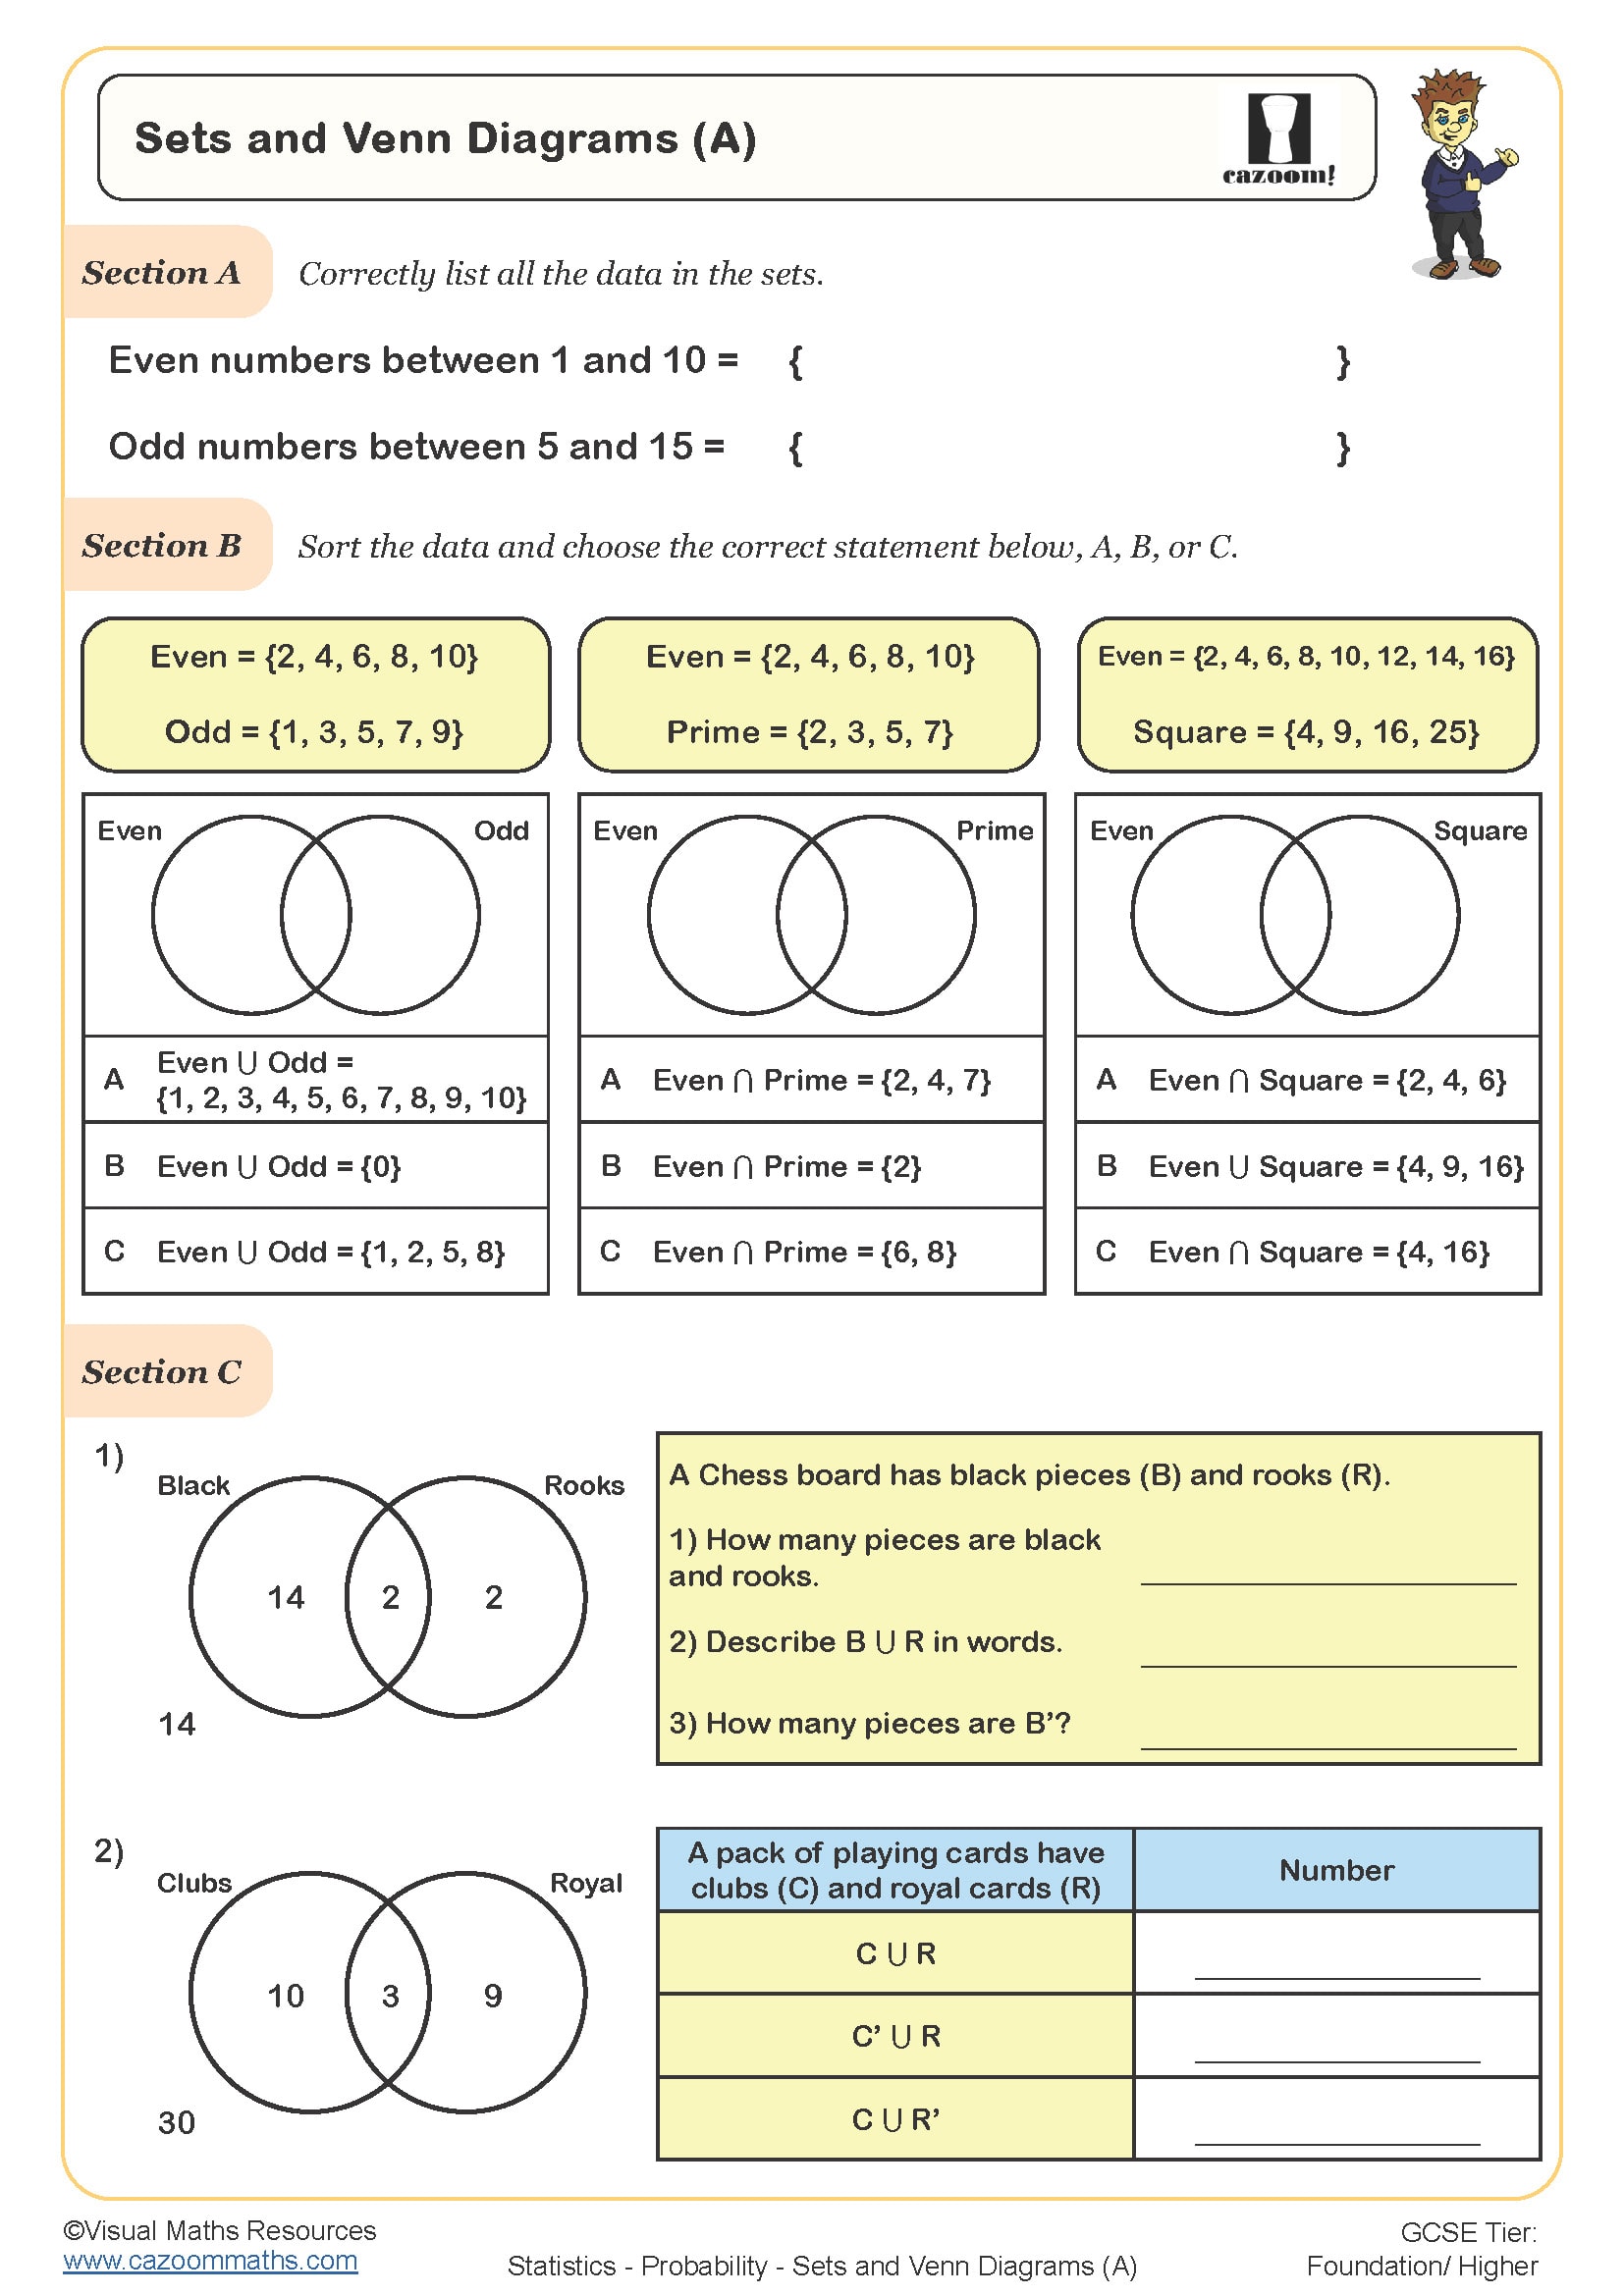
A quality Venn diagram worksheet should include varied question types that progress from basic set identification to complex probability calculations. Students need practice with both interpreting existing diagrams and constructing their own from written scenarios, particularly focusing on union and intersection concepts that appear regularly in GCSE examinations.
Teachers notice that students benefit most from worksheets that explicitly show the connection between the visual diagram and the algebraic notation. Many students initially struggle with notation like A ∩ B or A ∪ B, so effective worksheets include examples of Venn diagrams alongside their symbolic representations to reinforce this crucial link.
Which year groups should use Venn diagram worksheets with answers?
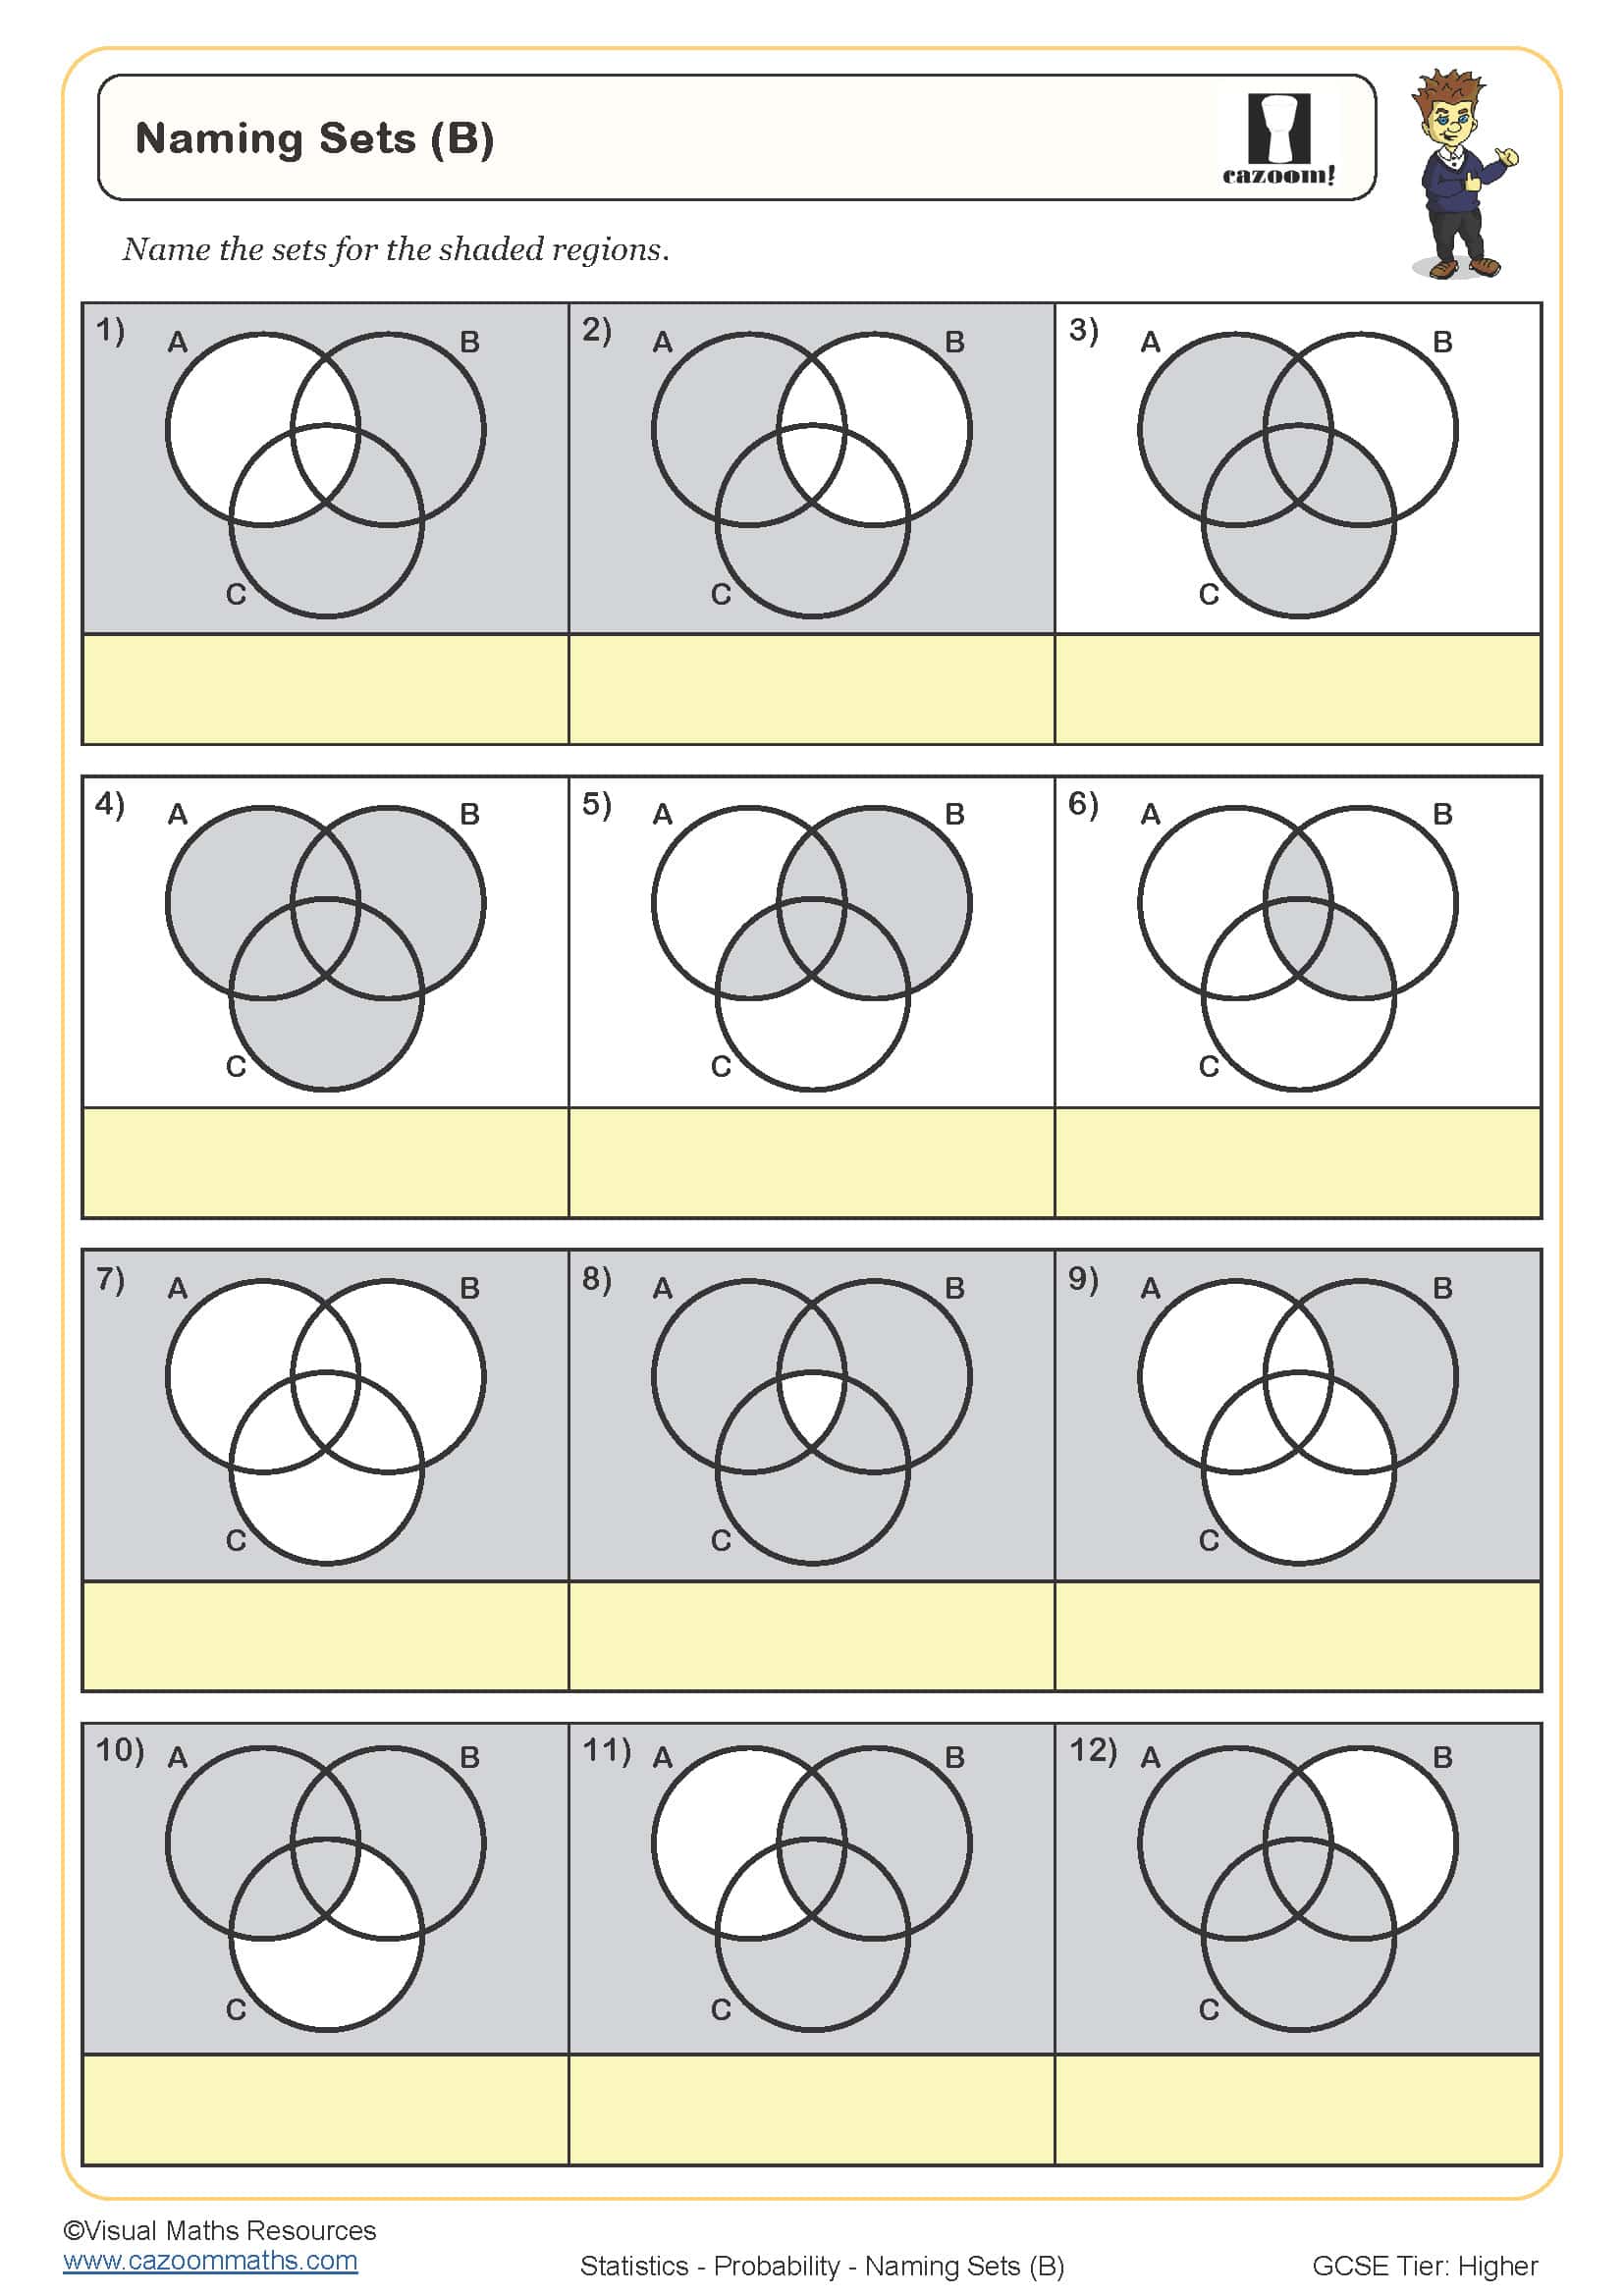
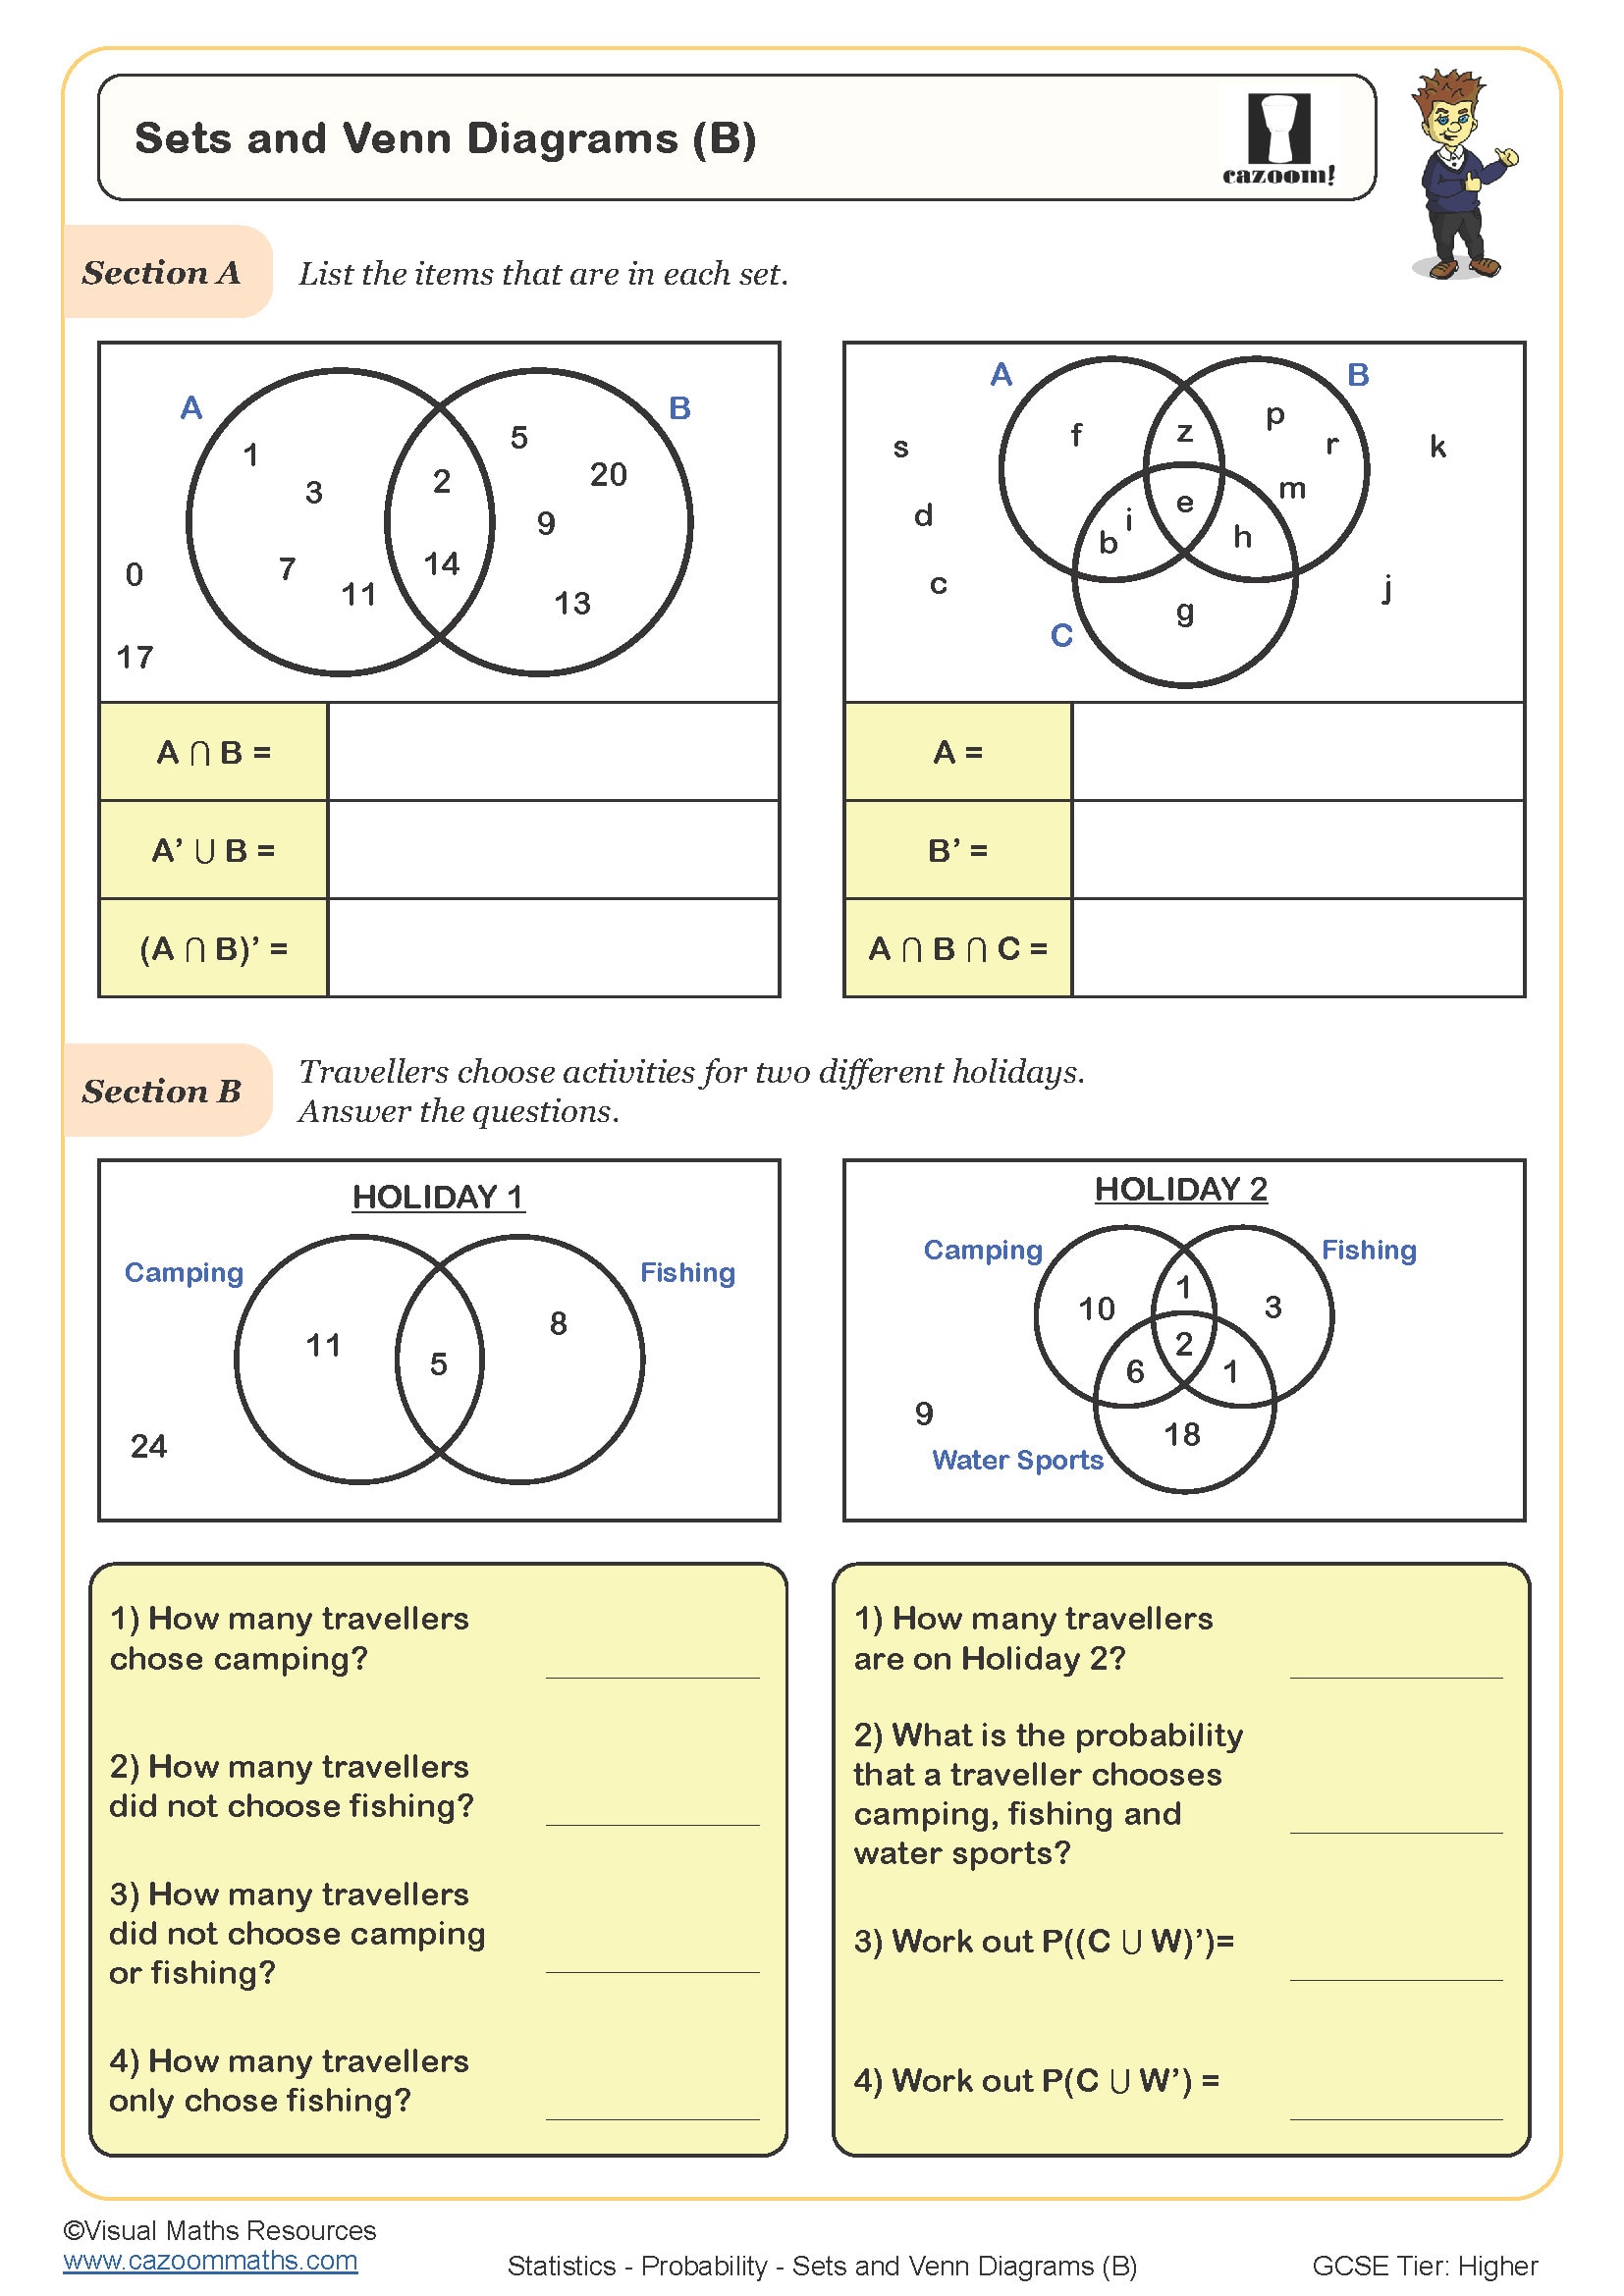
Venn diagrams typically appear in Year 7 as part of basic probability work, then return in Years 9-11 with increased complexity for GCSE preparation. KS3 students focus on simple two-set problems, whilst KS4 students tackle conditional probability and three-set scenarios that require systematic counting strategies.
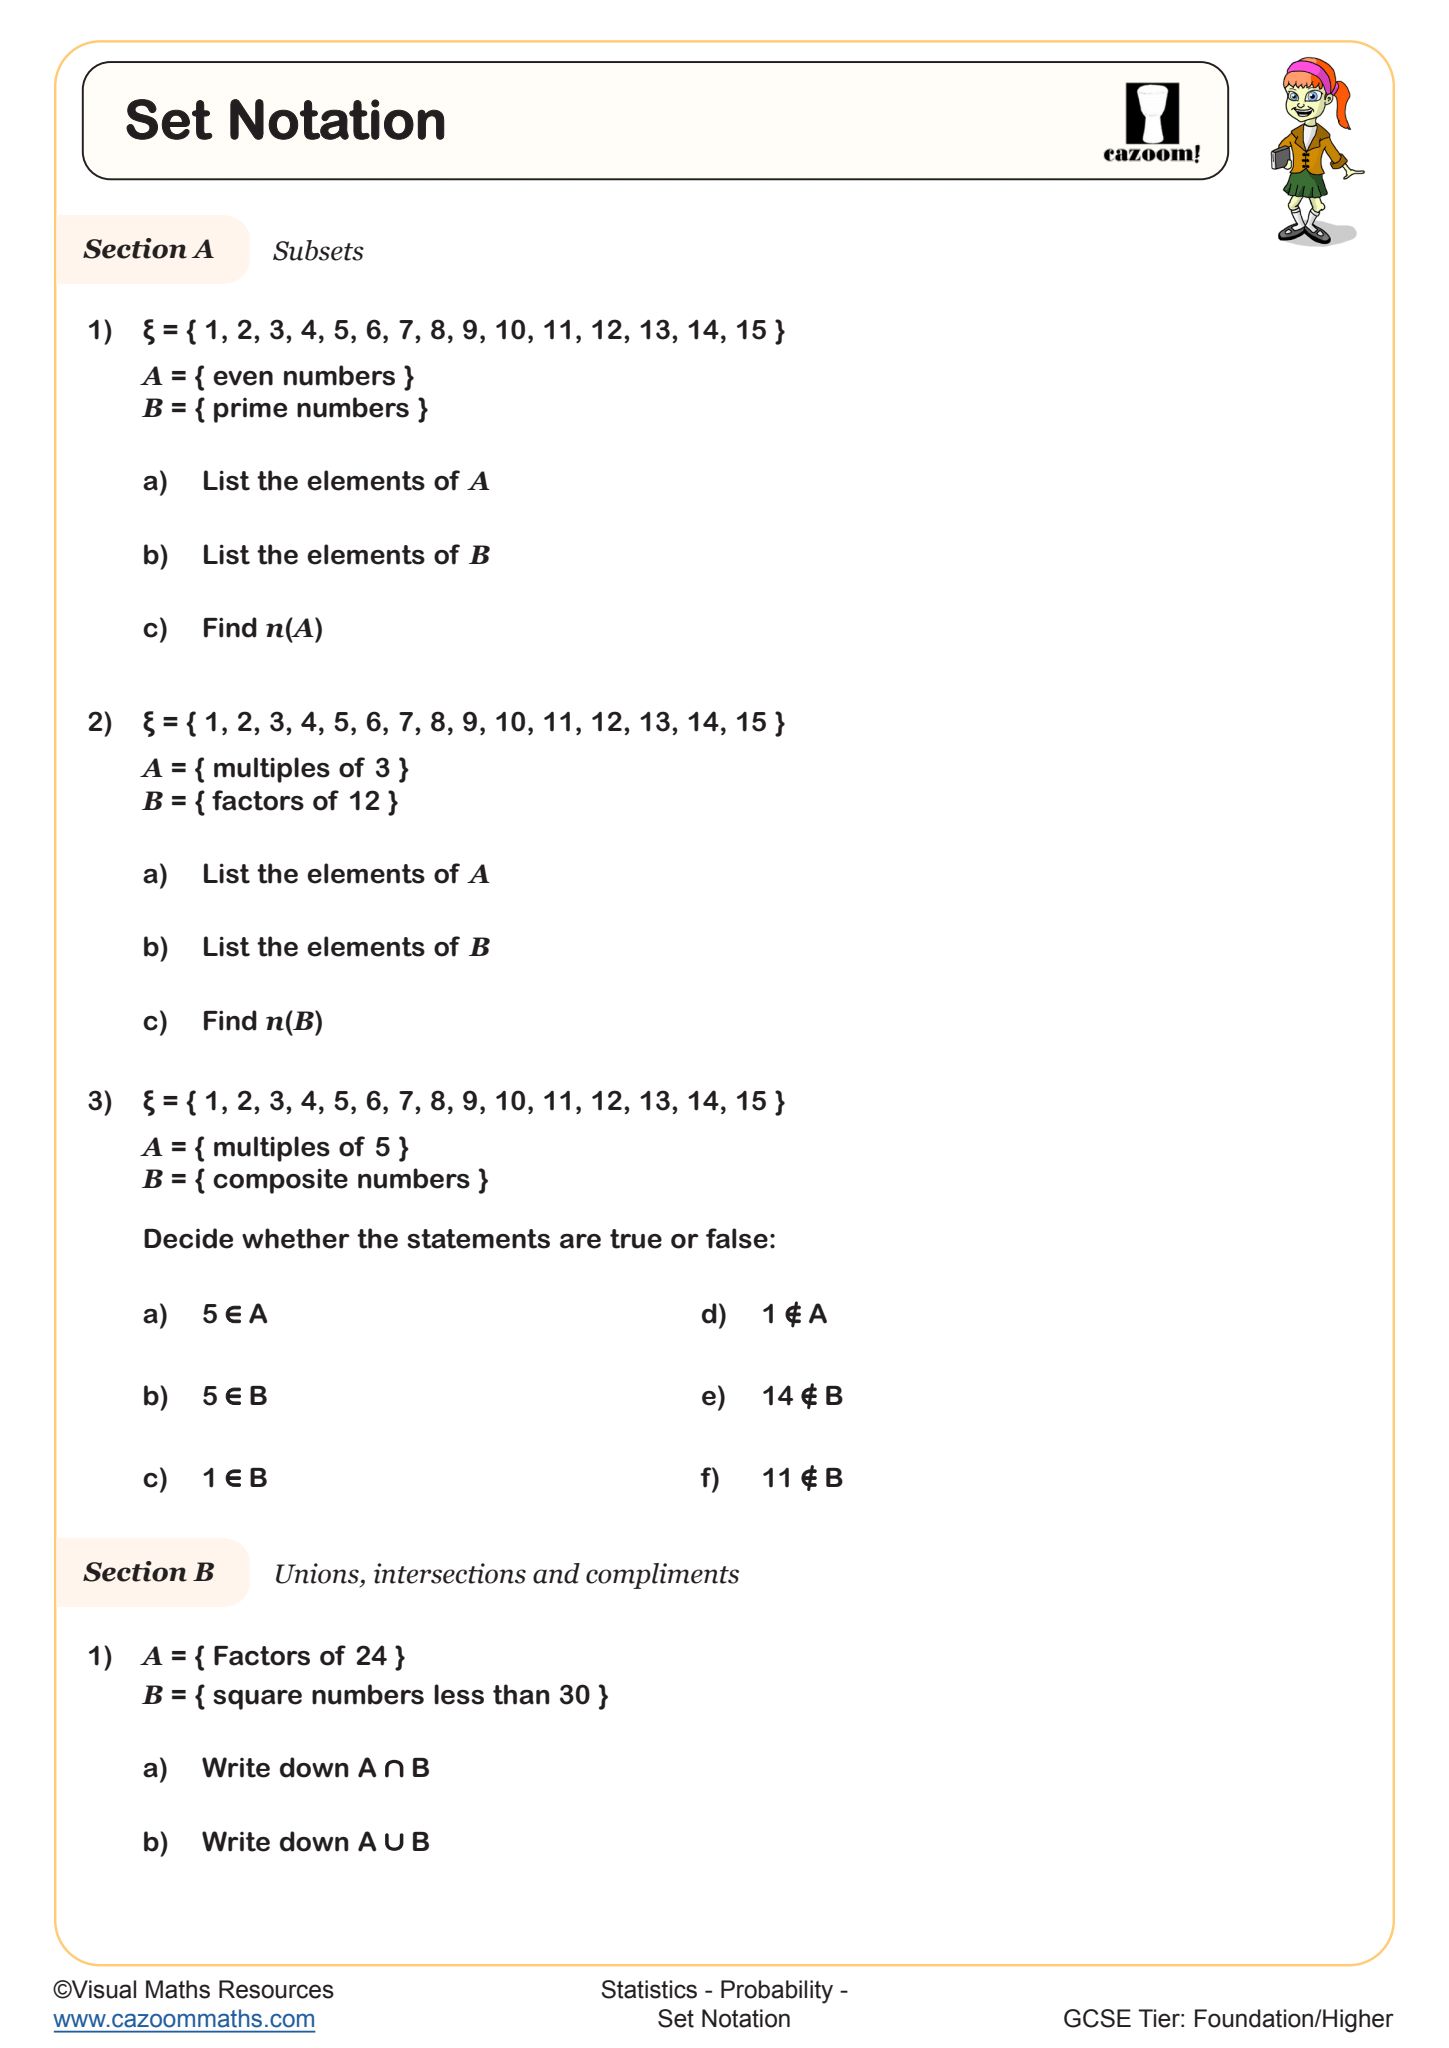
The progression moves from concrete examples using familiar contexts like school subjects or sports to abstract mathematical sets involving prime numbers or algebraic expressions. Teachers find that regular practice with interpreting Venn diagrams worksheet problems throughout KS3 prevents the conceptual gaps that often emerge during GCSE revision sessions.
How do you teach union and intersection effectively using worksheets?
Union and intersection concepts require careful scaffolding, starting with physical manipulatives before moving to worksheet practice. Students need to understand that union means 'either A or B or both' whilst intersection means 'both A and B together', distinctions that become crucial for probability calculations.
Teachers observe that students often confuse the symbols ∪ and ∩, particularly under exam pressure. Effective worksheets include visual cues and memory aids, such as thinking of ∩ as looking like an upside-down cup that 'holds' the common elements, whilst ∪ opens upward to 'gather' all elements from both sets.
How should teachers use these Venn diagram worksheets in lessons?
Teachers achieve best results by using these worksheets as consolidation rather than initial teaching tools, after students have experienced hands-on activities with physical sets. The answer sheets enable peer marking and immediate feedback, allowing teachers to identify misconceptions quickly and address them through targeted intervention.
Many teachers find success in using the worksheets for homework followed by class discussion of common errors. Students particularly benefit from working through examples where they must justify their reasoning, especially in three-set problems where systematic approaches prevent counting errors that frequently occur in examination conditions.