Year 10 Cumulative Frequency and Box Plots Worksheets
All worksheets are created by the team of experienced teachers at Cazoom Maths.
Premium PDF Worksheets with Complete Answer Keys
All of the box plots and cumulative frequency worksheet come as a downloadable PDF with separate answer sheets. Download these premium, ready-to-use, printable resources right away to initiate an engaging learning process. You KS4 statistics learners can work through problems at their own pace, while teachers save time with ready-made solutions. Our cumulative frequency worksheets include detailed work to help students understand each step of the process clearly.
Key features of our printable resources:
• Visual diagrams and clear layouts
• Differentiated questions for all ability levels
• Complete answer sheets with working shown
• Suitable for classroom and homework use
• Aligned with GCSE Higher tier requirements
Complete Year 10 Statistics Worksheet Collection
Our wide variety of comprehensive collection covers all essential Year 10 cumulative frequency and box plot topics:
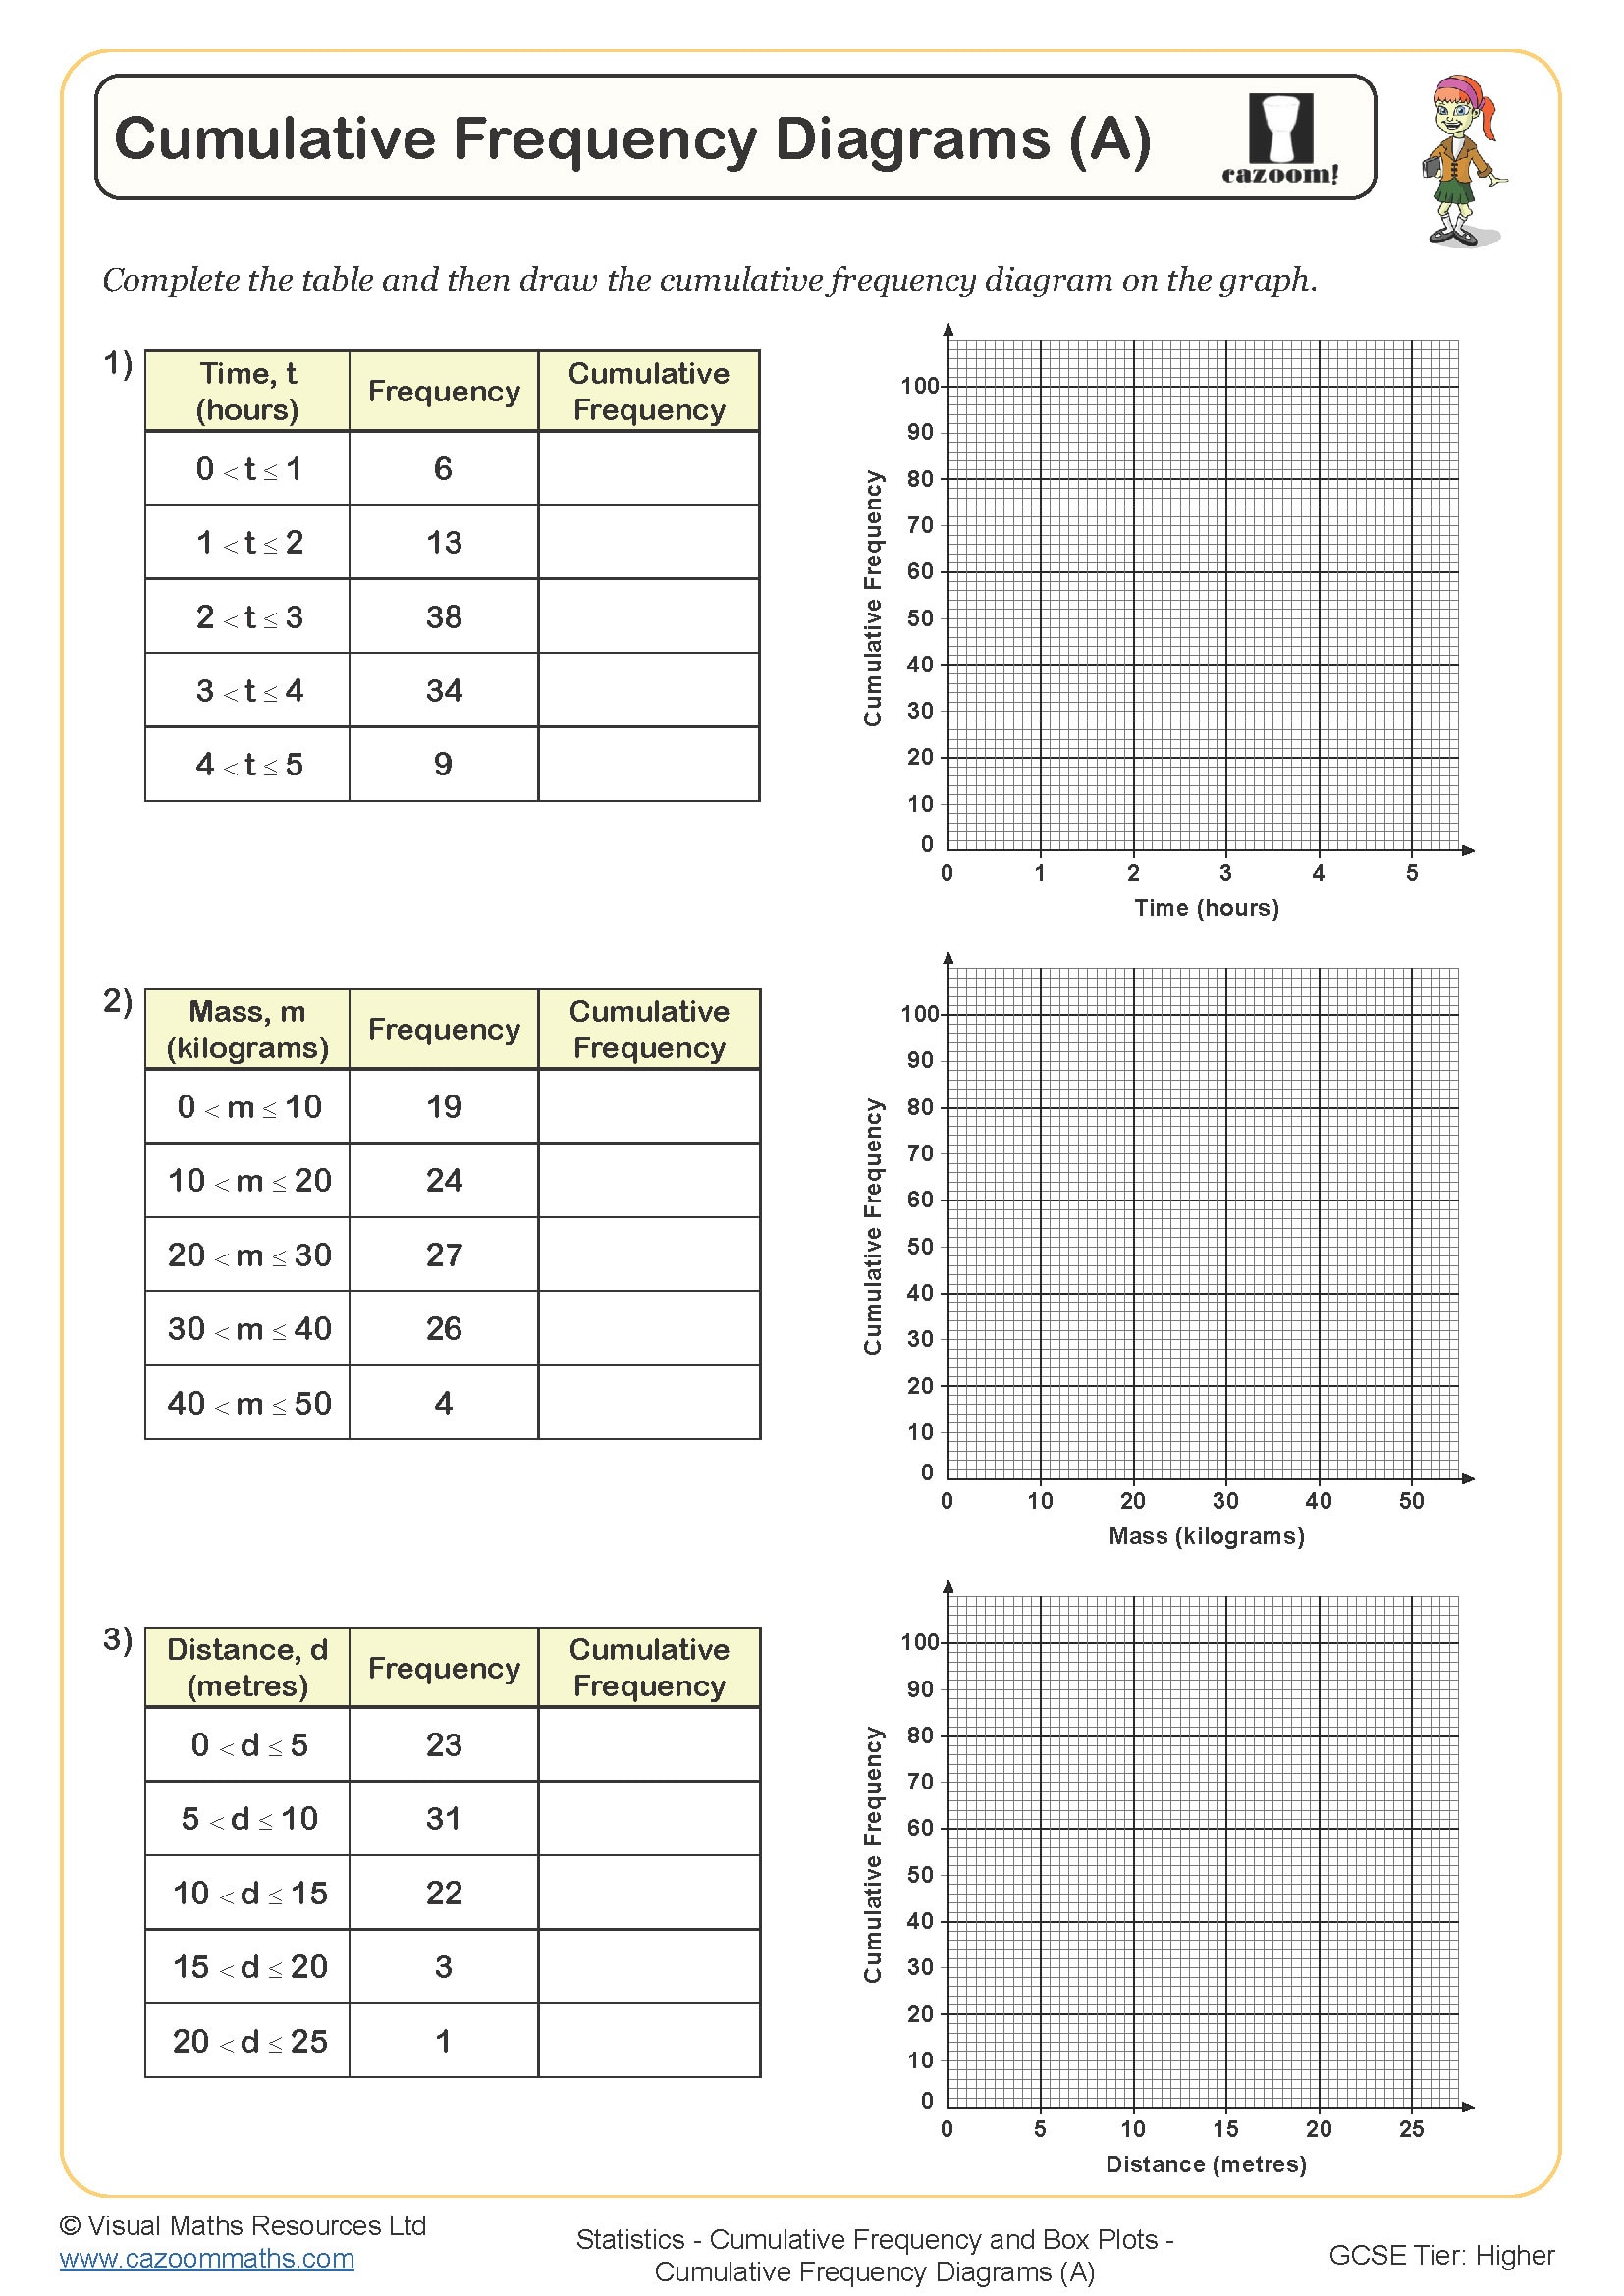
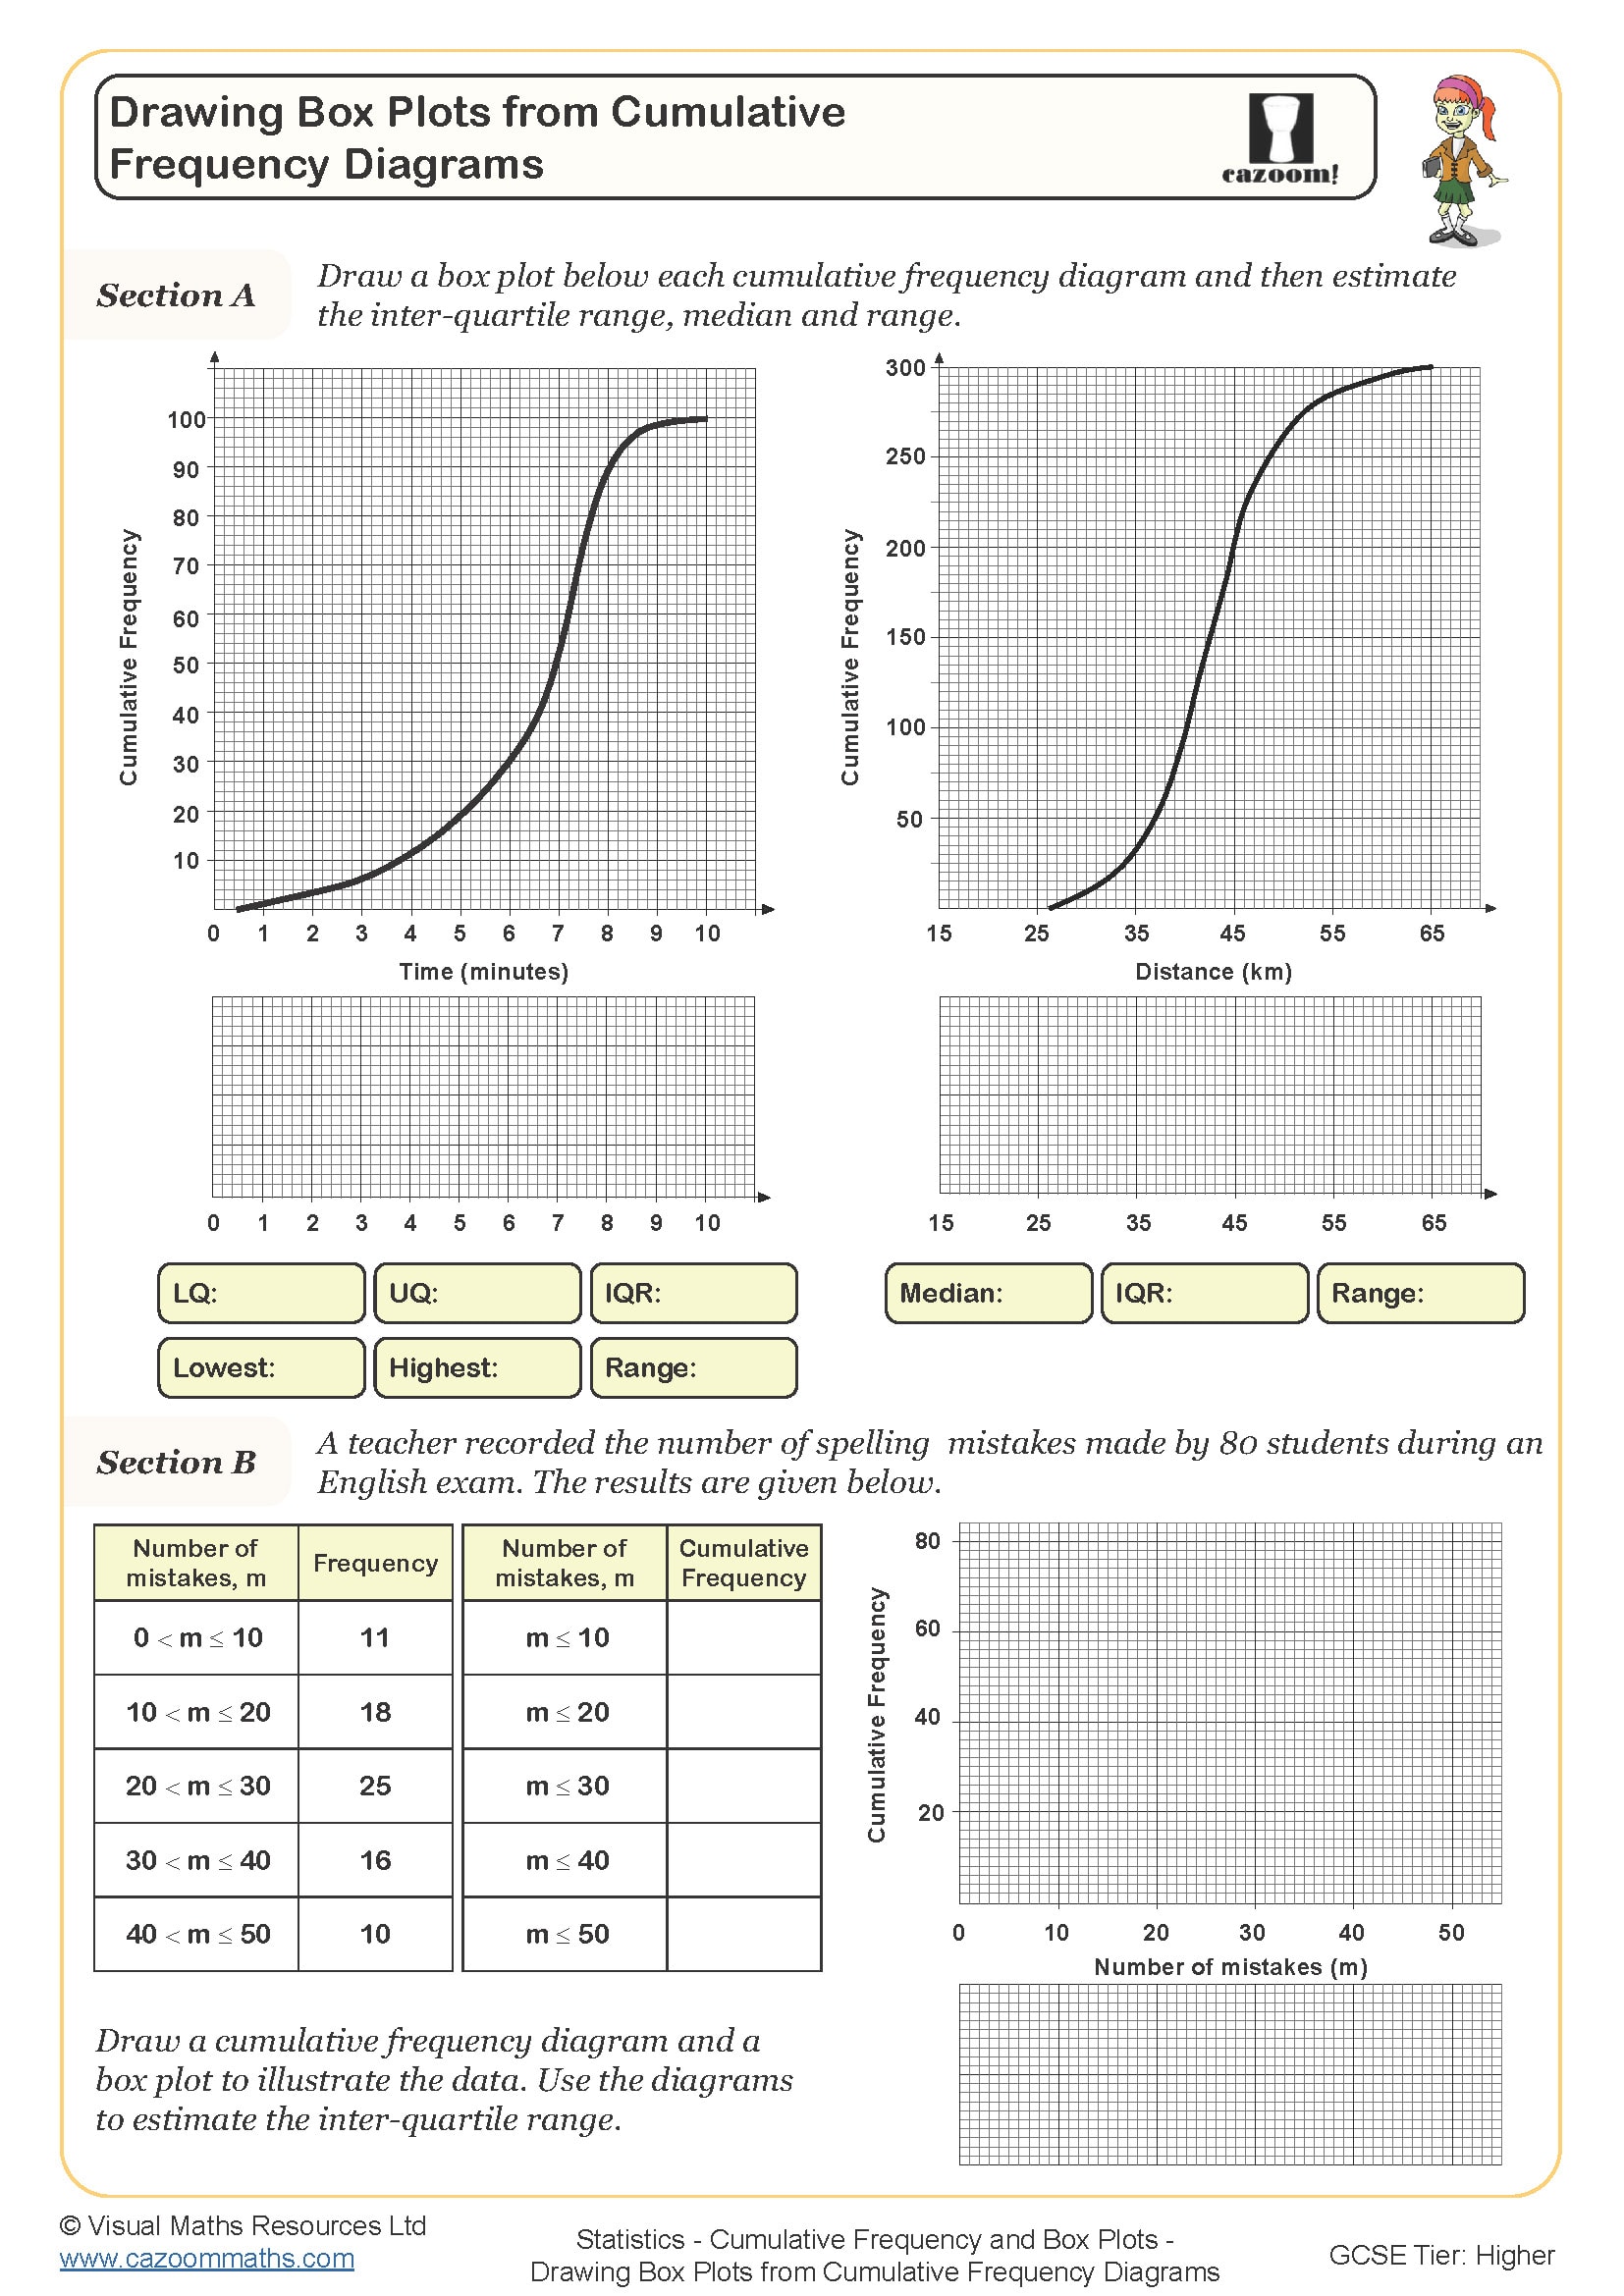
Cumulative Frequency Diagrams Worksheets:
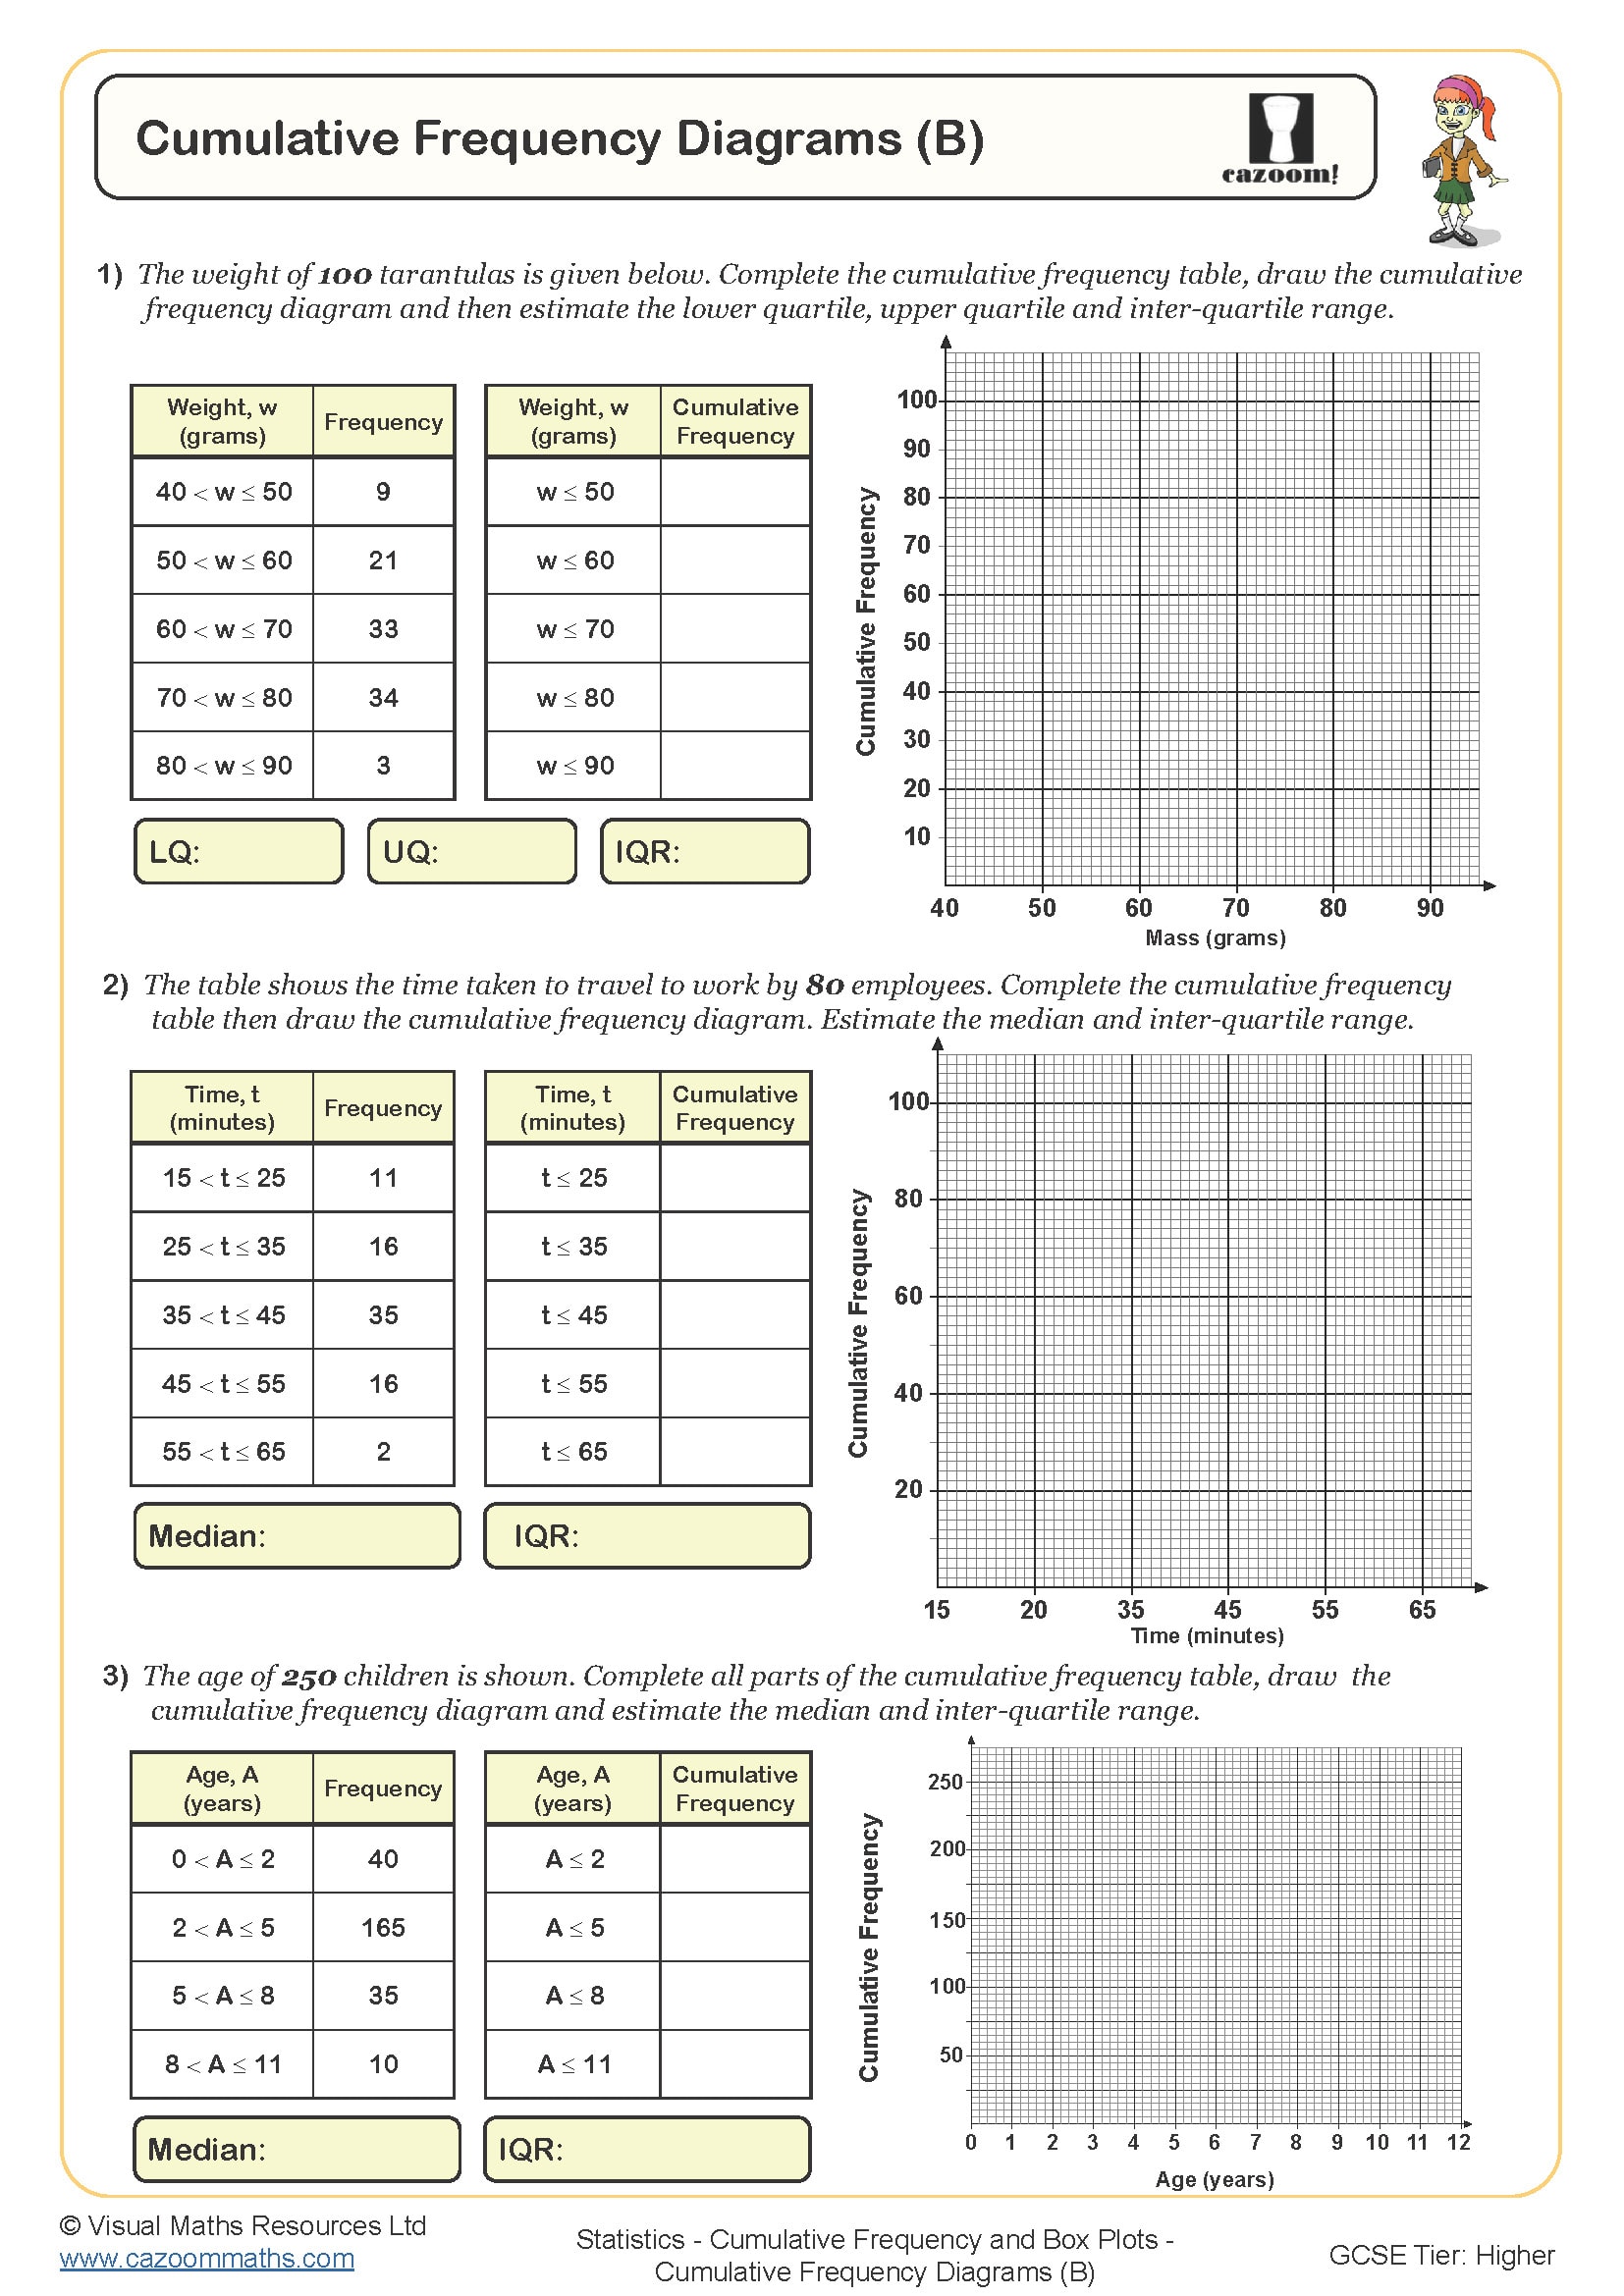
• Plotting cumulative frequency curves from frequency tables
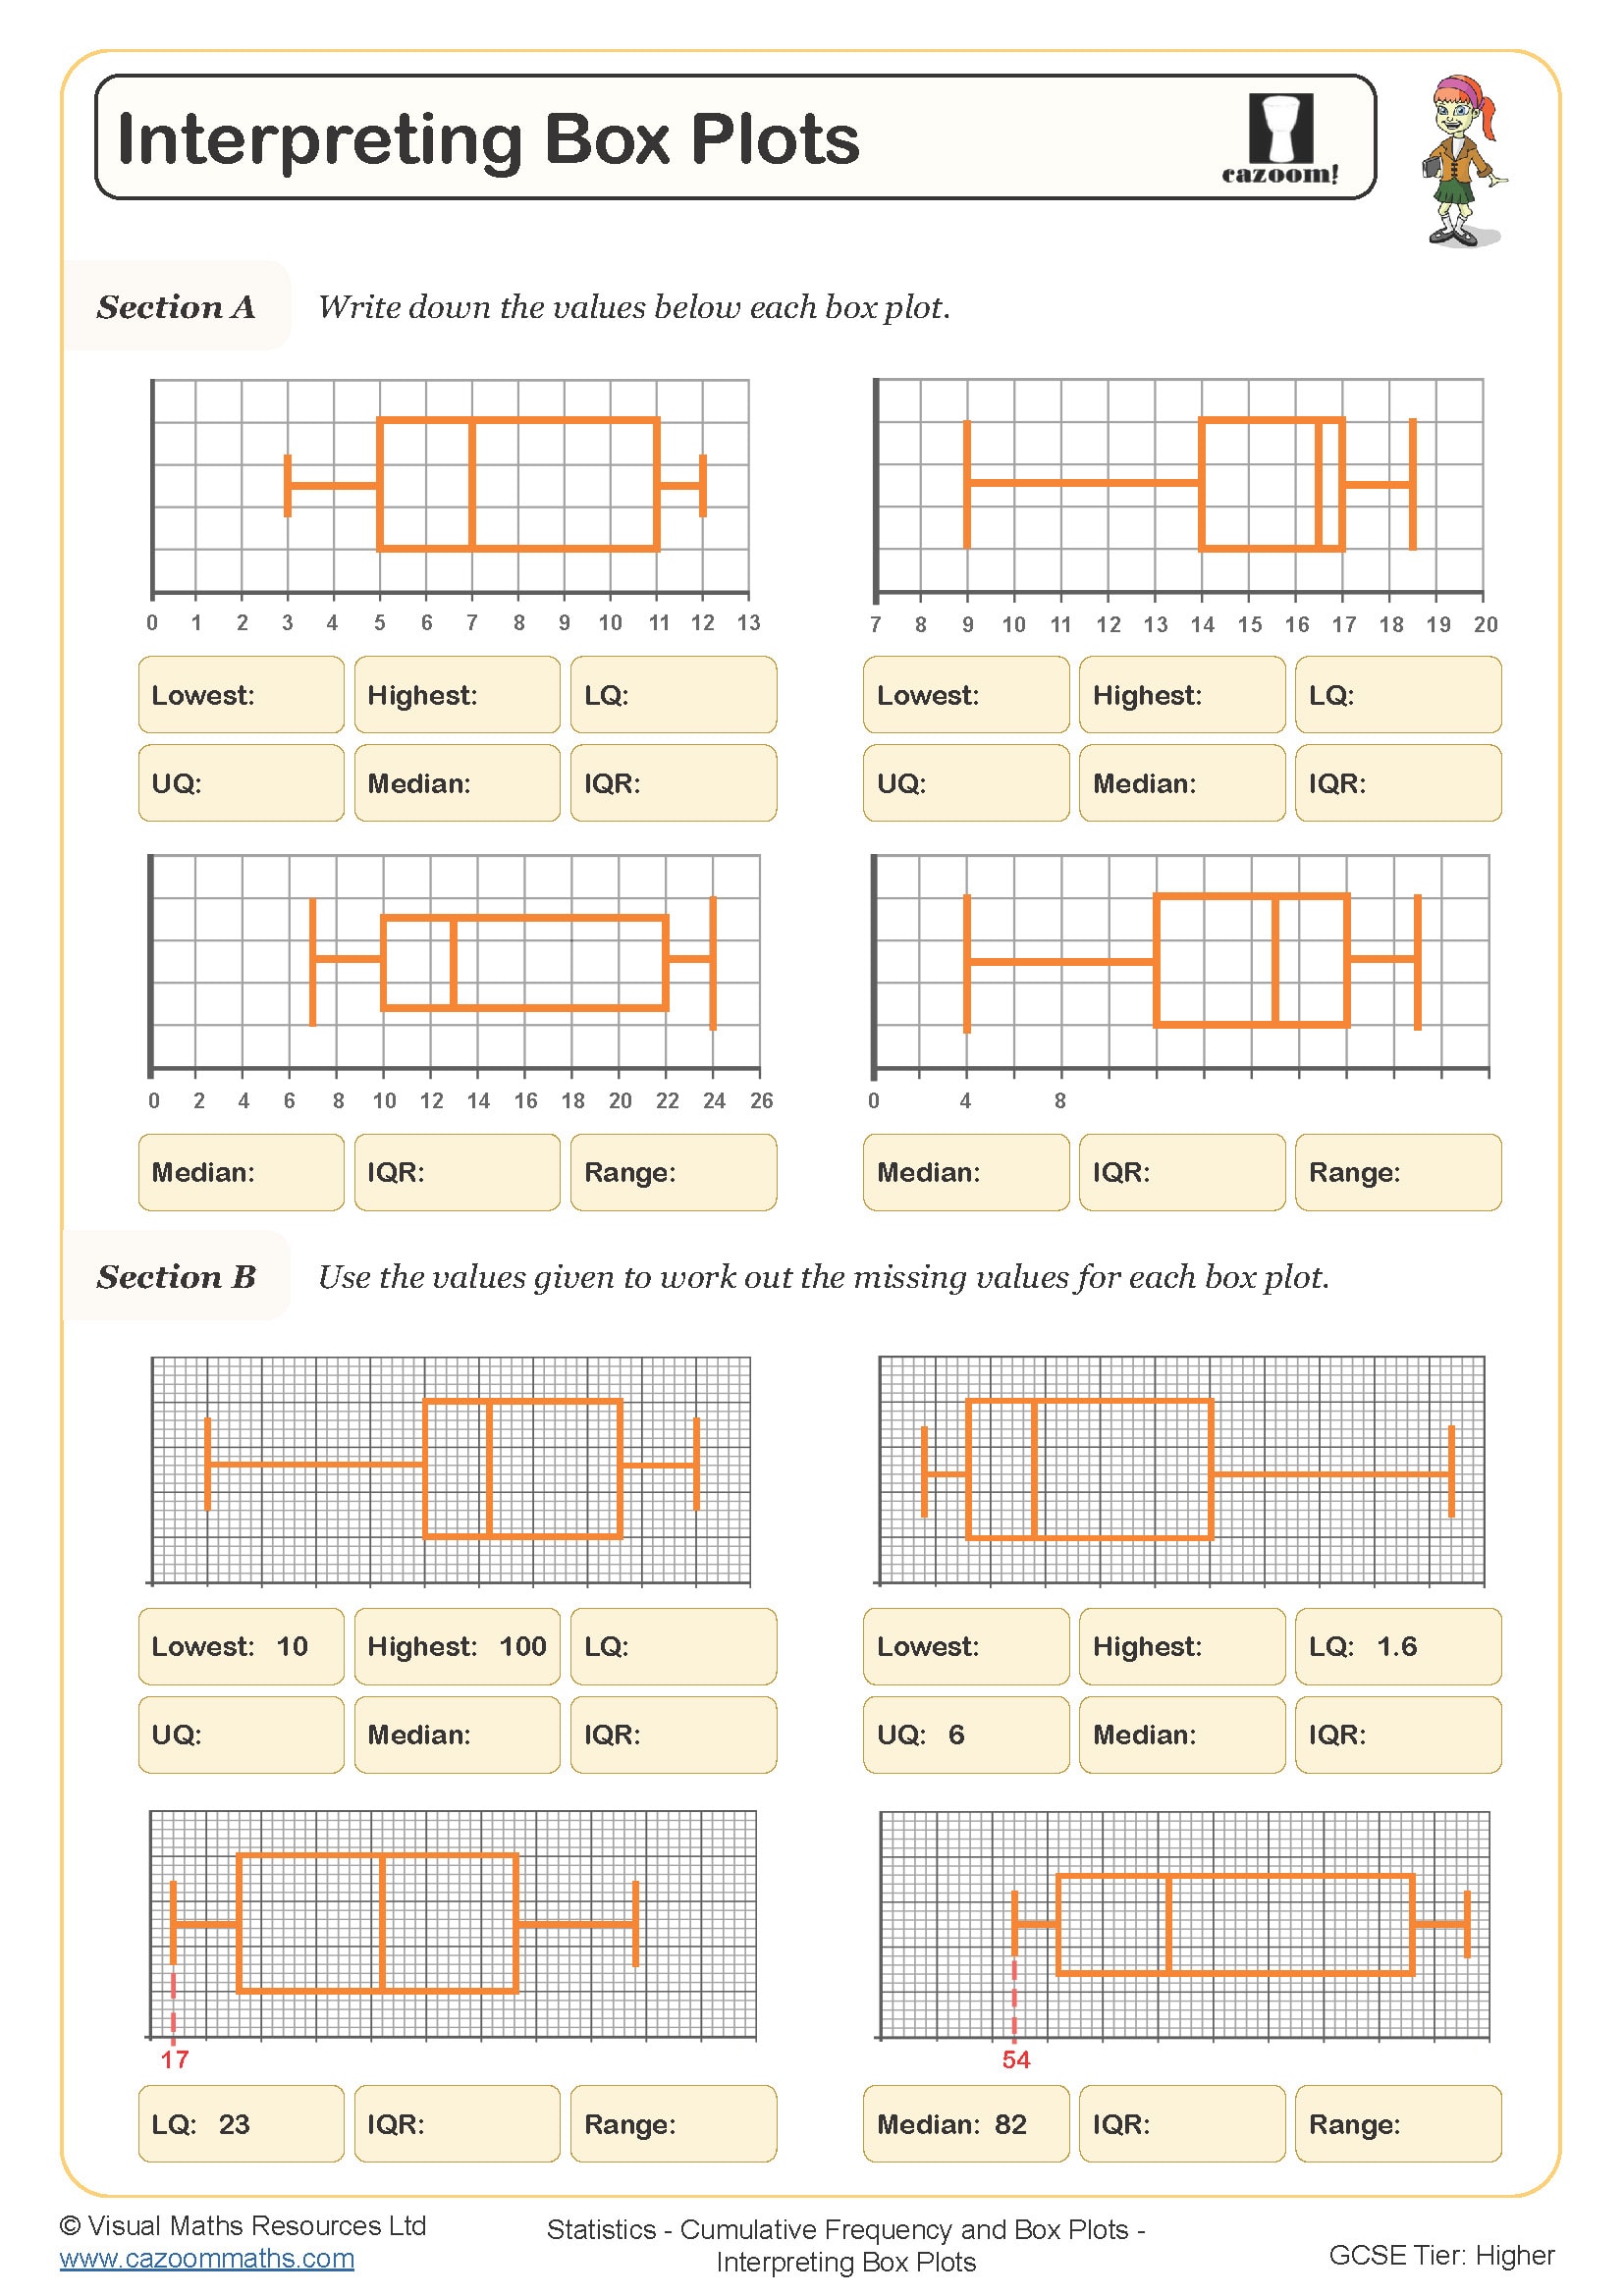
• Reading median and quartiles from cumulative frequency graphs
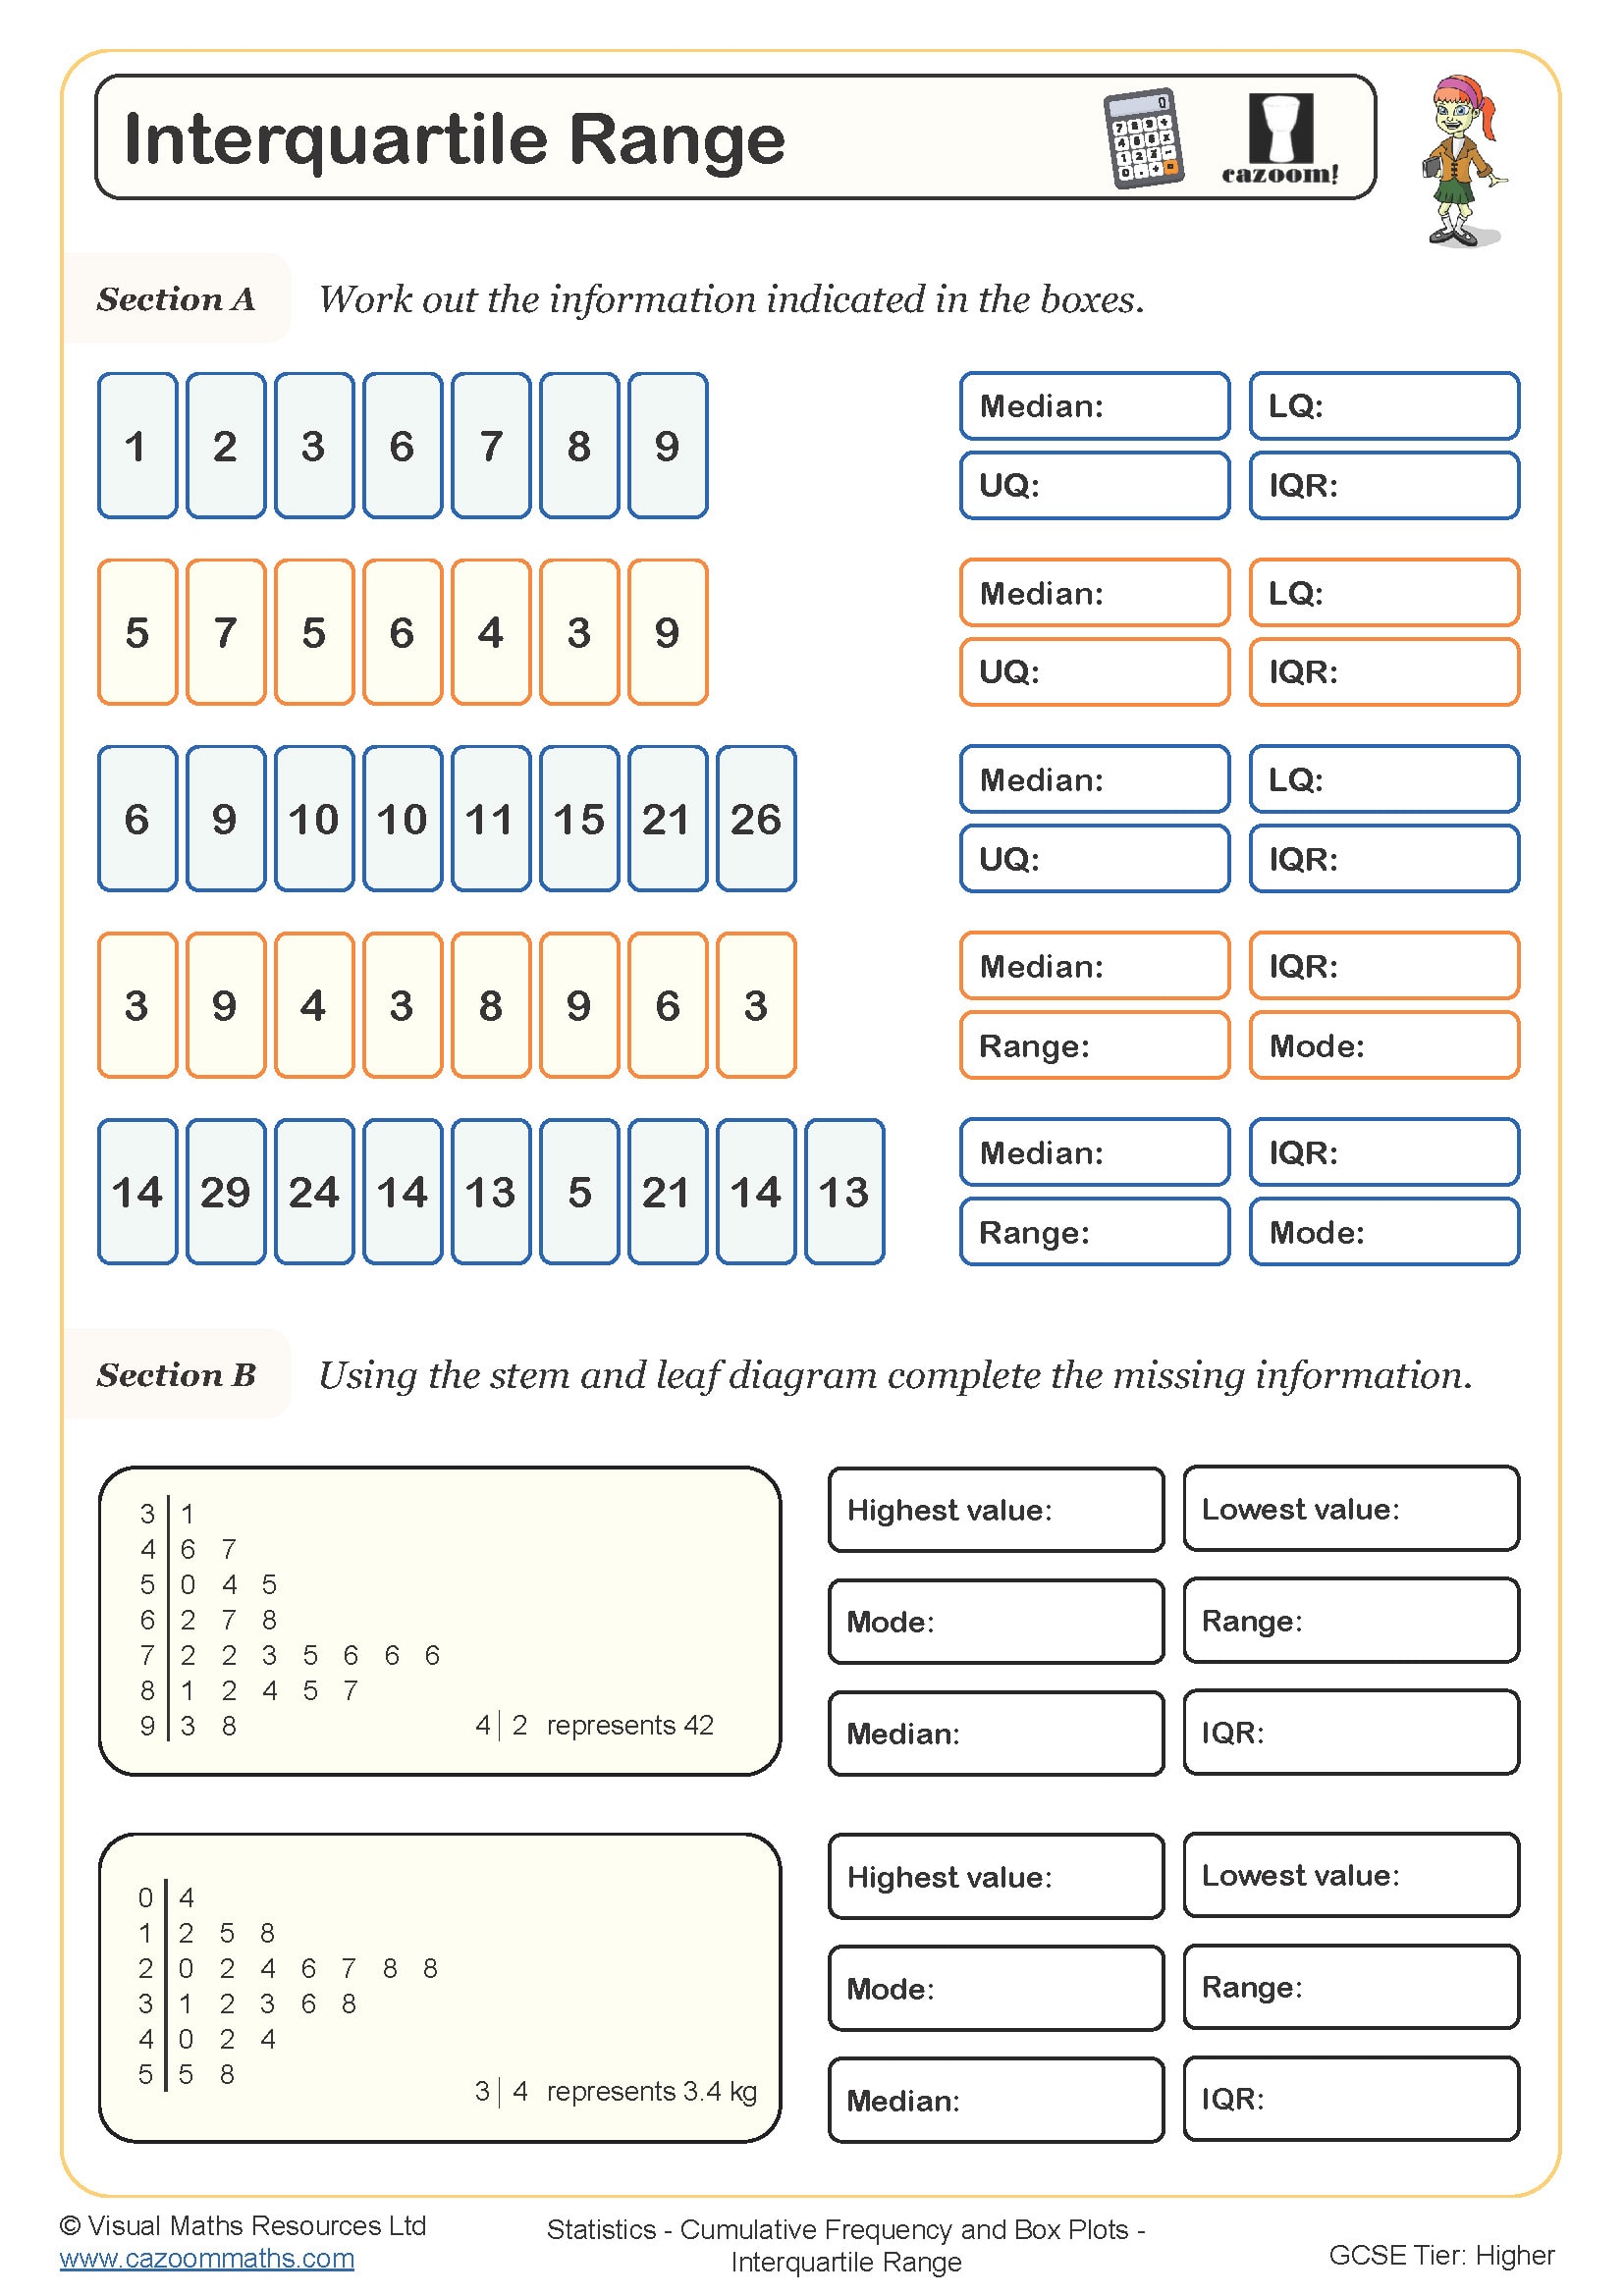
• Finding the interquartile range and range values
• Interpreting cumulative frequency data accurately
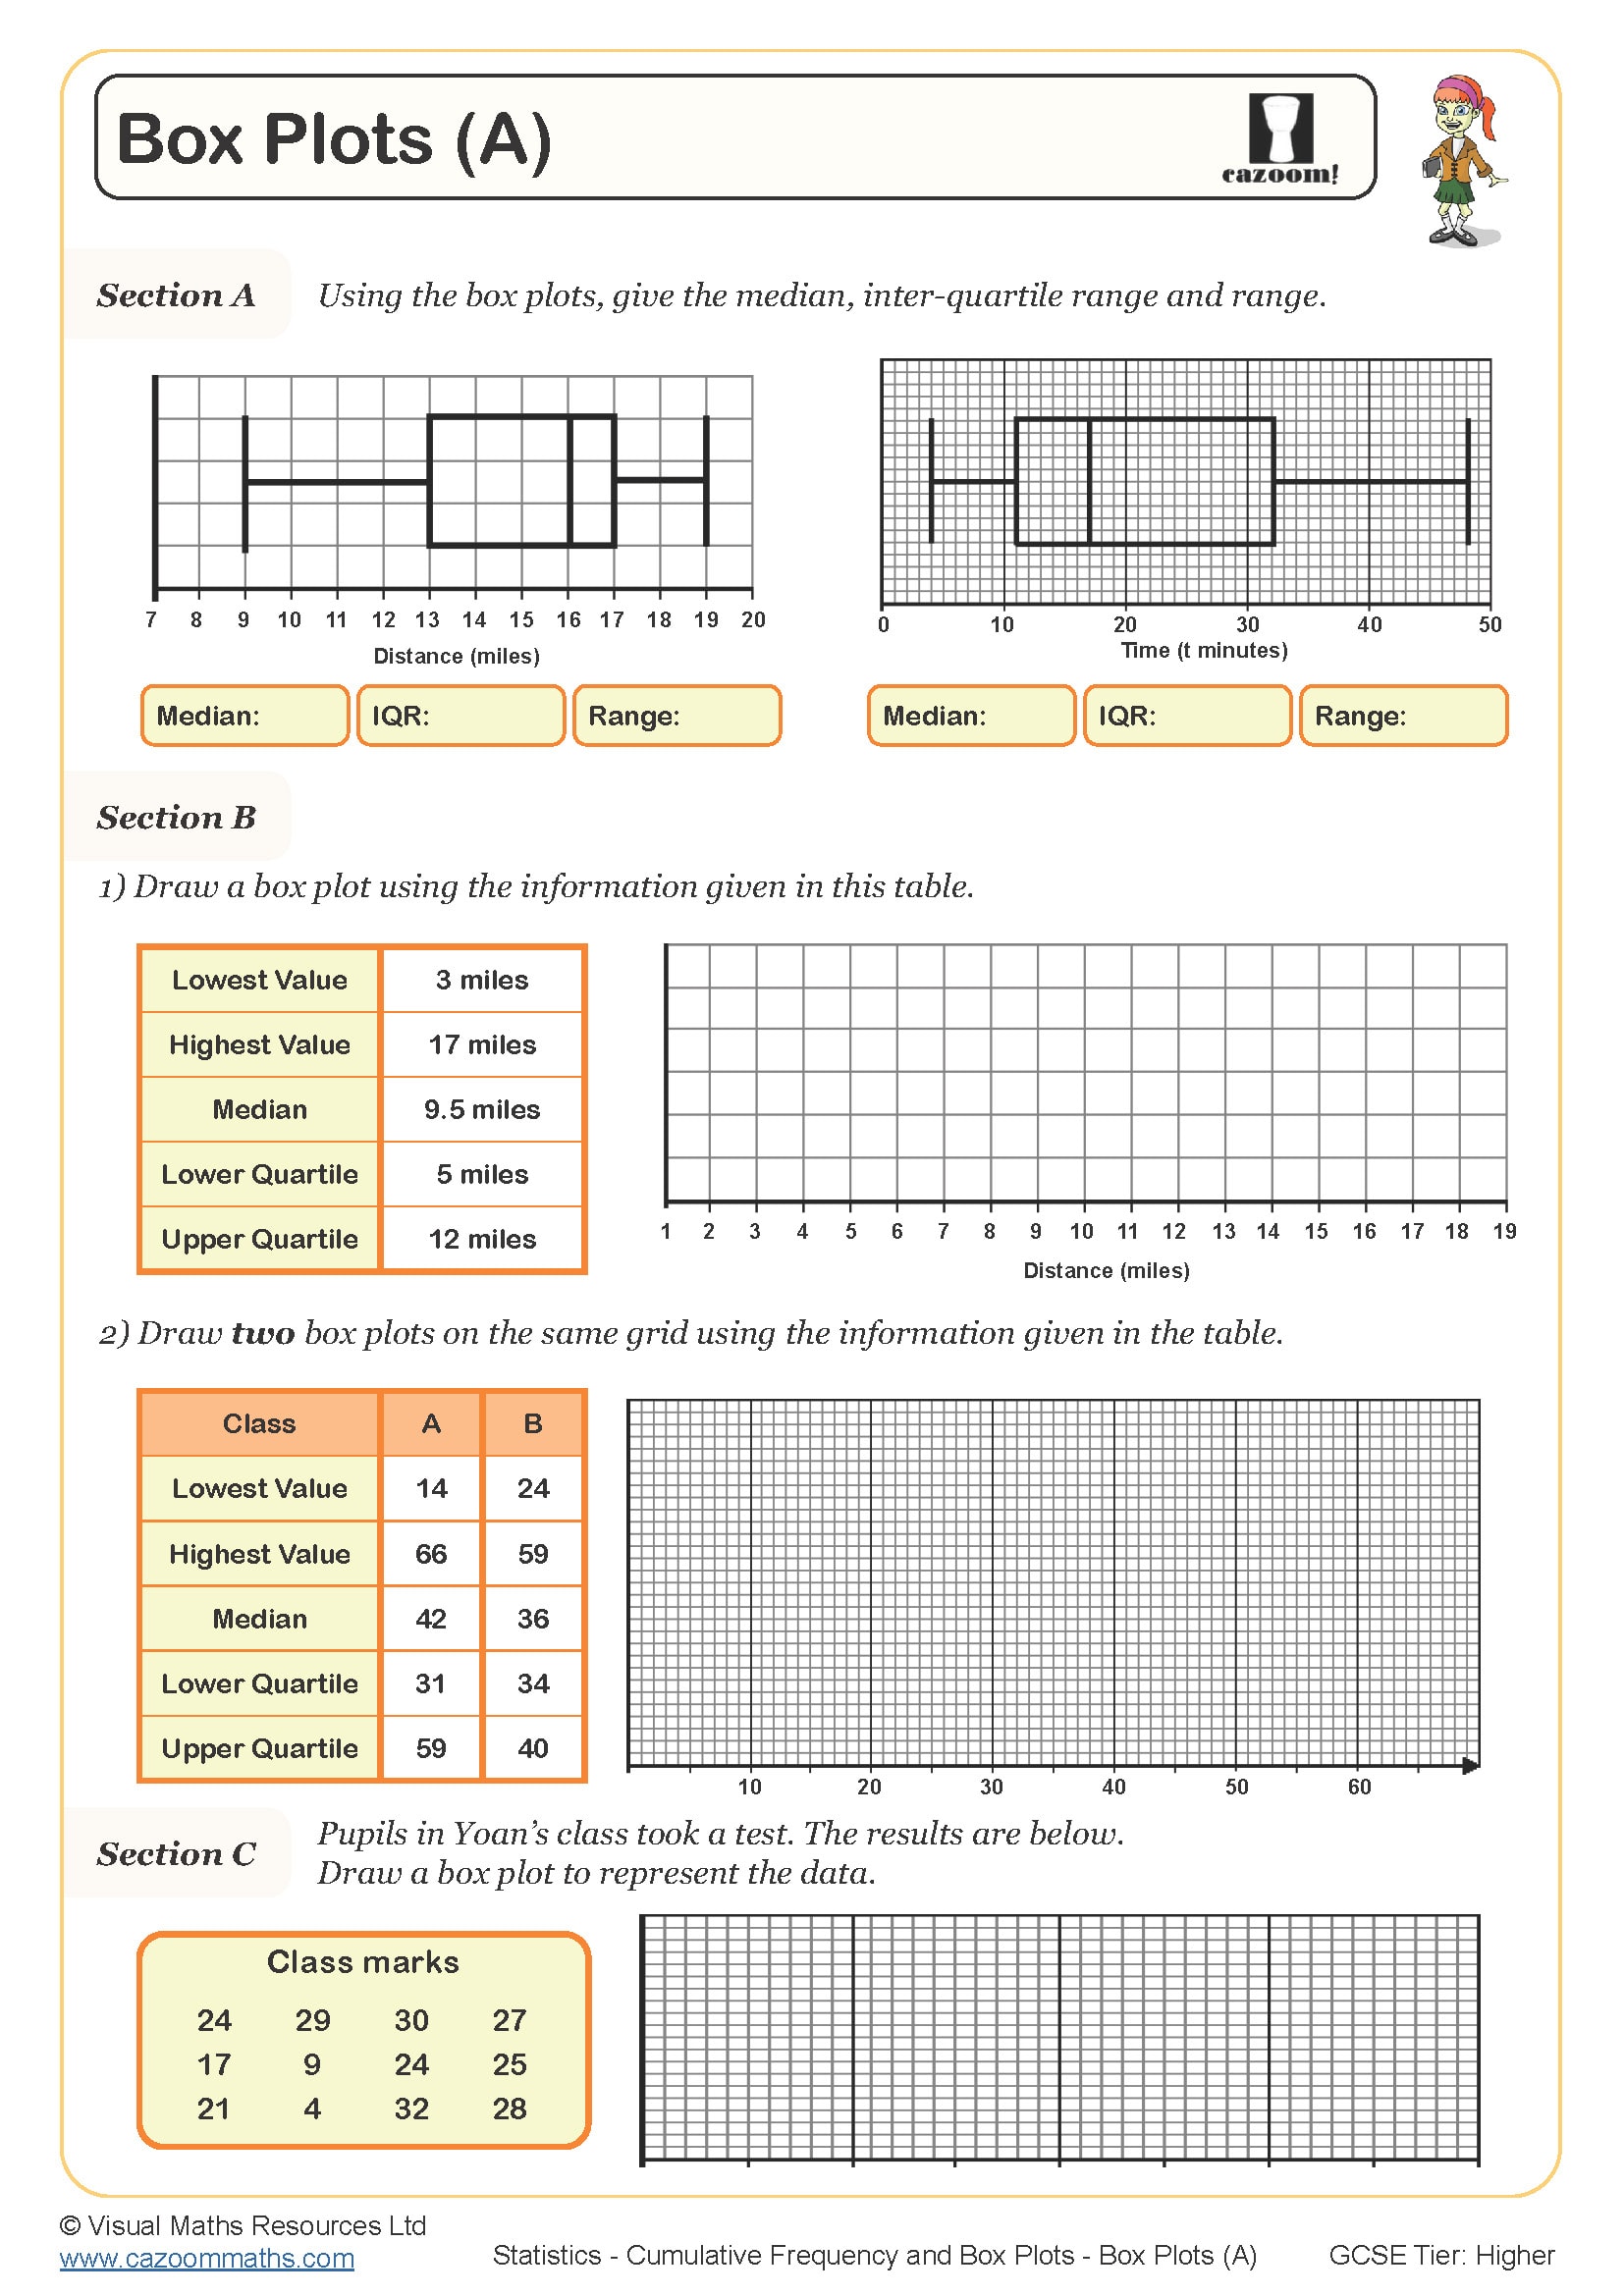
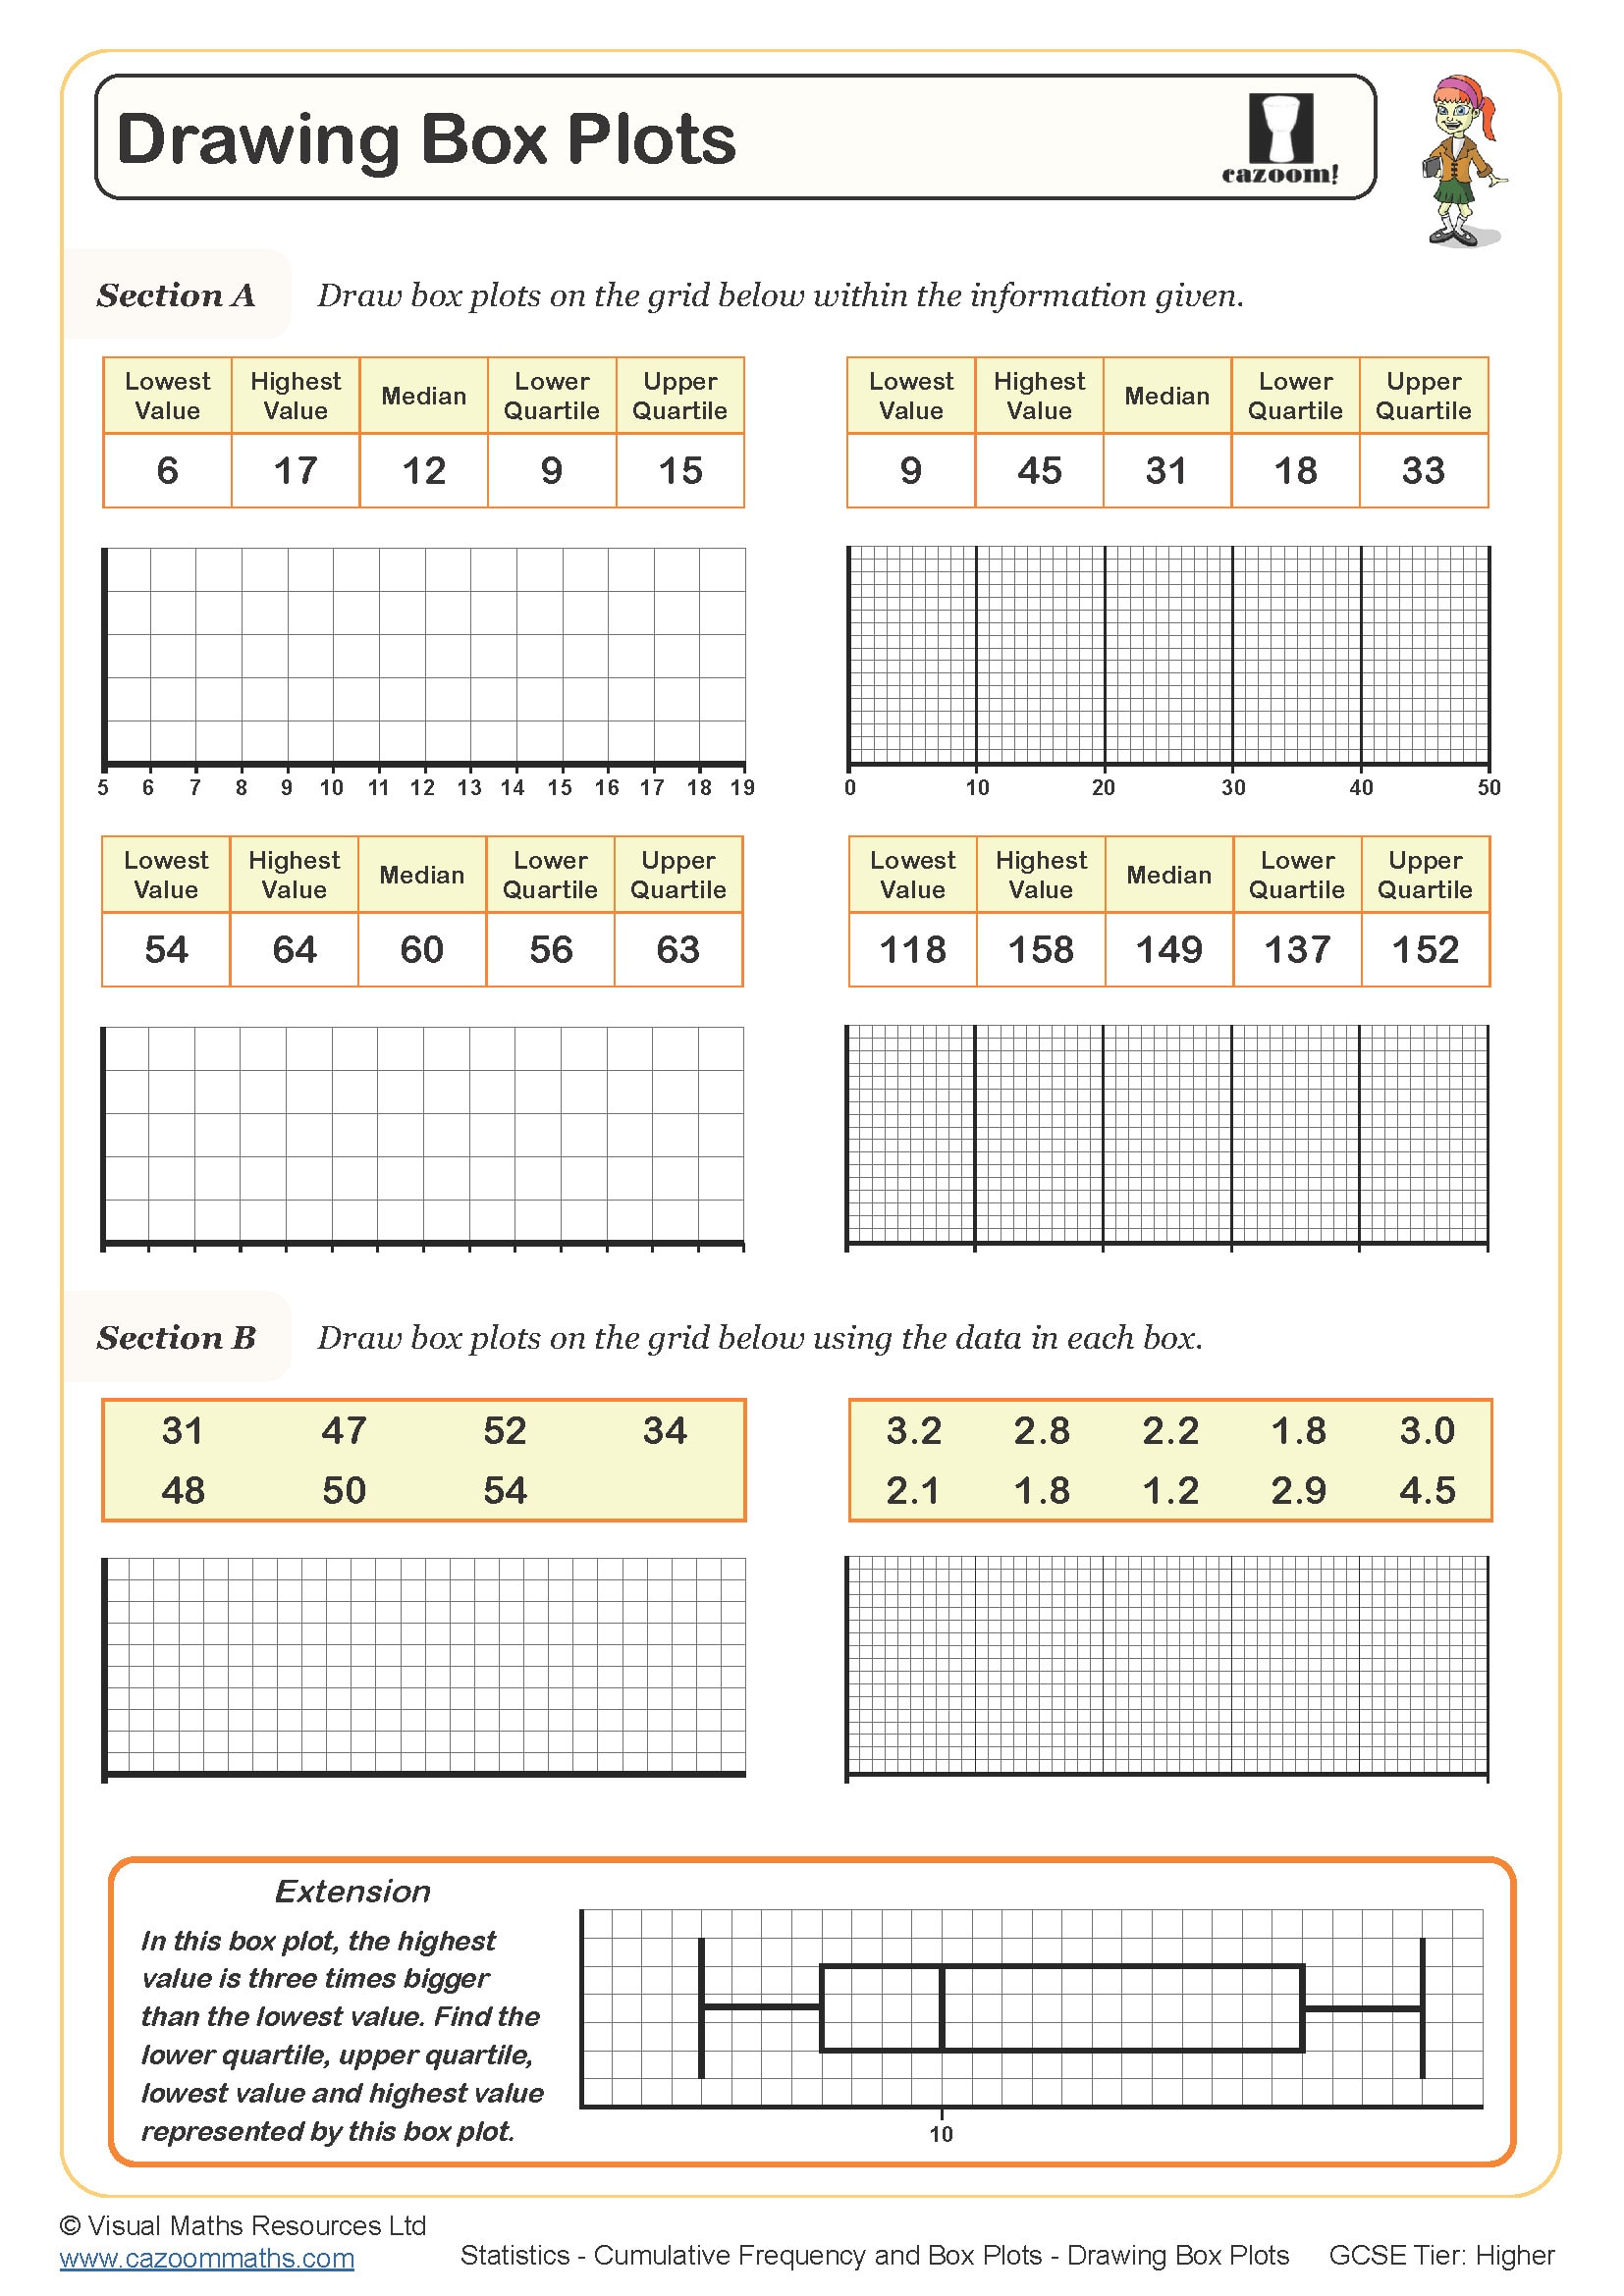
Box Plot Construction Worksheets:
• Drawing box plots from cumulative frequency diagrams
• Creating box plots from raw data sets
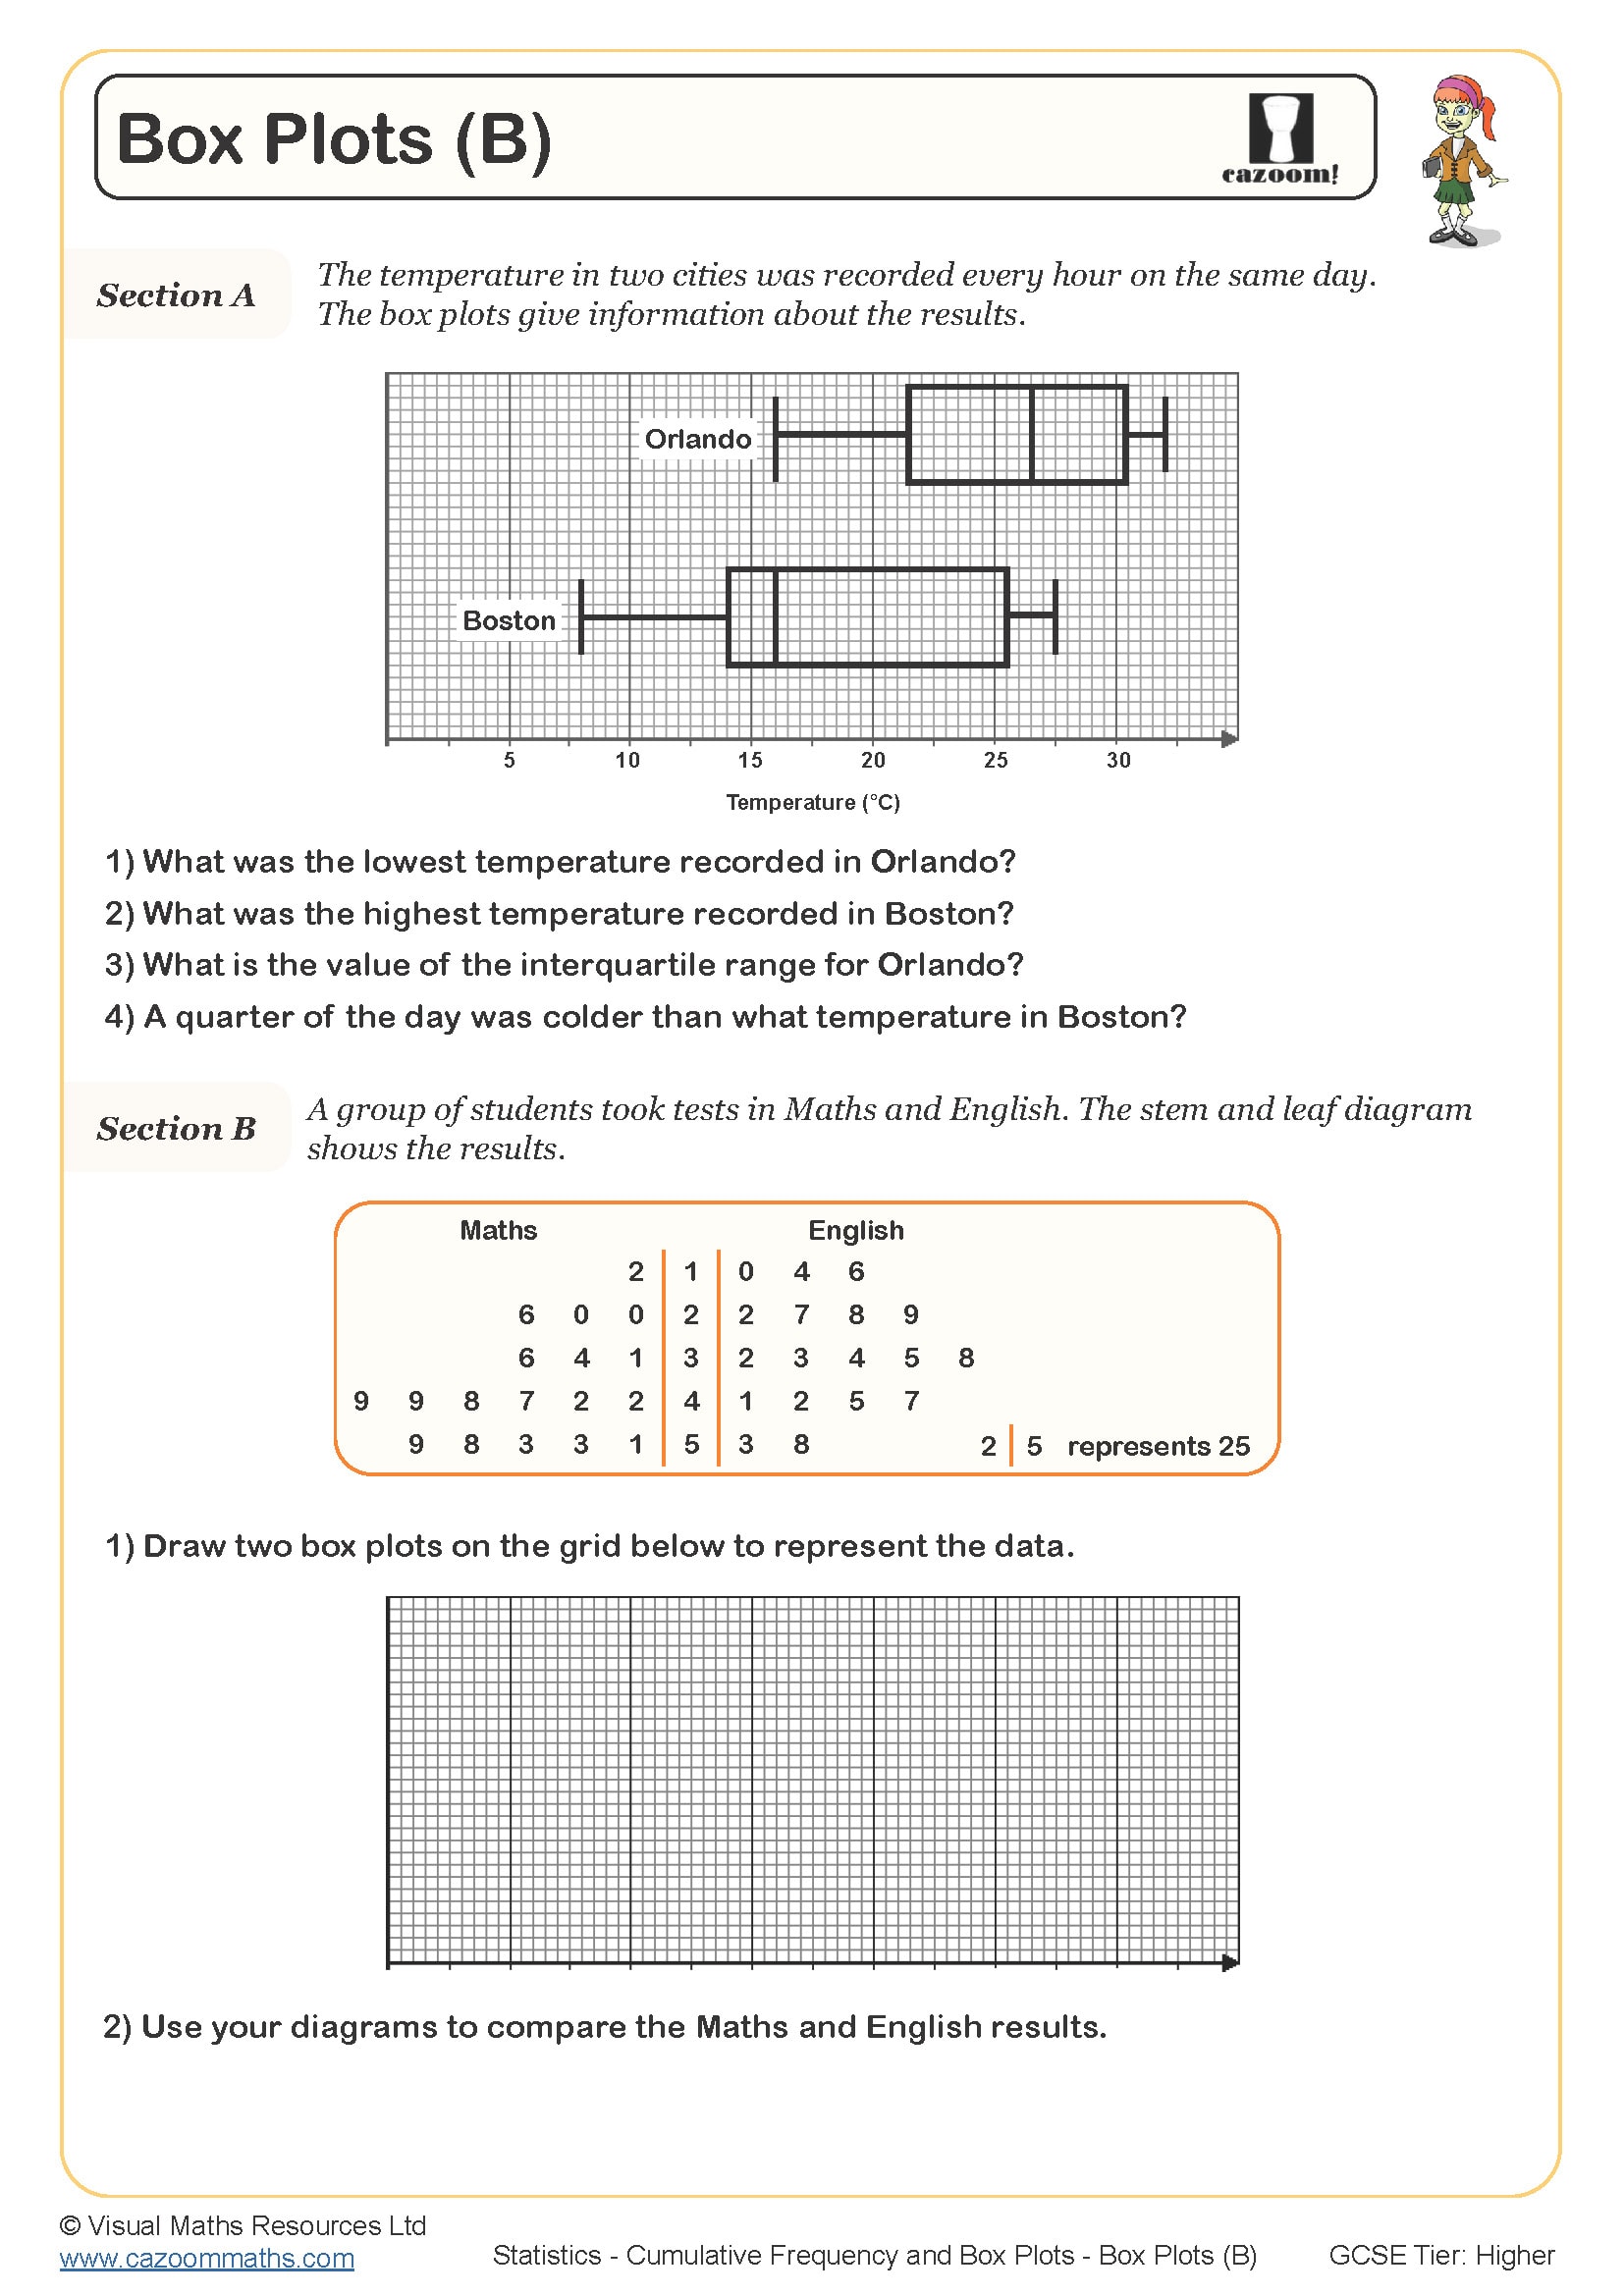
• Reading information from existing box plots
• Comparing different data sets using box plots
Why Teachers Choose These GCSE Statistics Resources
These worksheets build crucial analytical skills that students need for GCSE success. Cumulative frequency and box plots help students visualise data patterns and make statistical comparisons. Regular practice with these concepts improves problem-solving abilities and mathematical reasoning skills significantly.
Benefits for student learning:
• Develops statistical literacy and data interpretation skills
• Prepares students for GCSE Higher tier questions
• Builds confidence with complex mathematical concepts
• Encourages visual thinking and pattern recognition
Discover Real-World Statistics in Action
Students encounter these statistical methods in many real-world situations. Market researchers use cumulative frequency to analyse customer data trends. Medical professionals create box plots to compare treatment effectiveness across different patient groups.
Common applications include:
• Analysing exam results and grade distributions
• Comparing house prices across different areas
• Studying rainfall patterns and weather data
• Evaluating sports performance statistics
• Investigating social media engagement trends