Year 7 Stem and Leaf Diagrams Worksheets
All worksheets are created by the team of experienced teachers at Cazoom Maths.
6 Benefits of Using PDF Year 7 Stem and Leaf Diagram Worksheets in Class and at Home
Stem and leaf diagrams offer unique advantages over other graphs by maintaining raw data visibility whilst creating organised visual patterns. Pupils learn how dividing numbers into stems and leaves reveals gaps, clusters, and distribution shapes that might otherwise go overlooked. Together with statistical reasoning, this dual nature—part table, part graph—strengthens place value comprehension. Because each digit counts and needs to be placed precisely, the method teaches precision in data recording. Regular practice helps students build the methodical approach required for later encounters with cumulative frequency diagrams, box plots, and quartile calculations.
Specific learning benefits include:
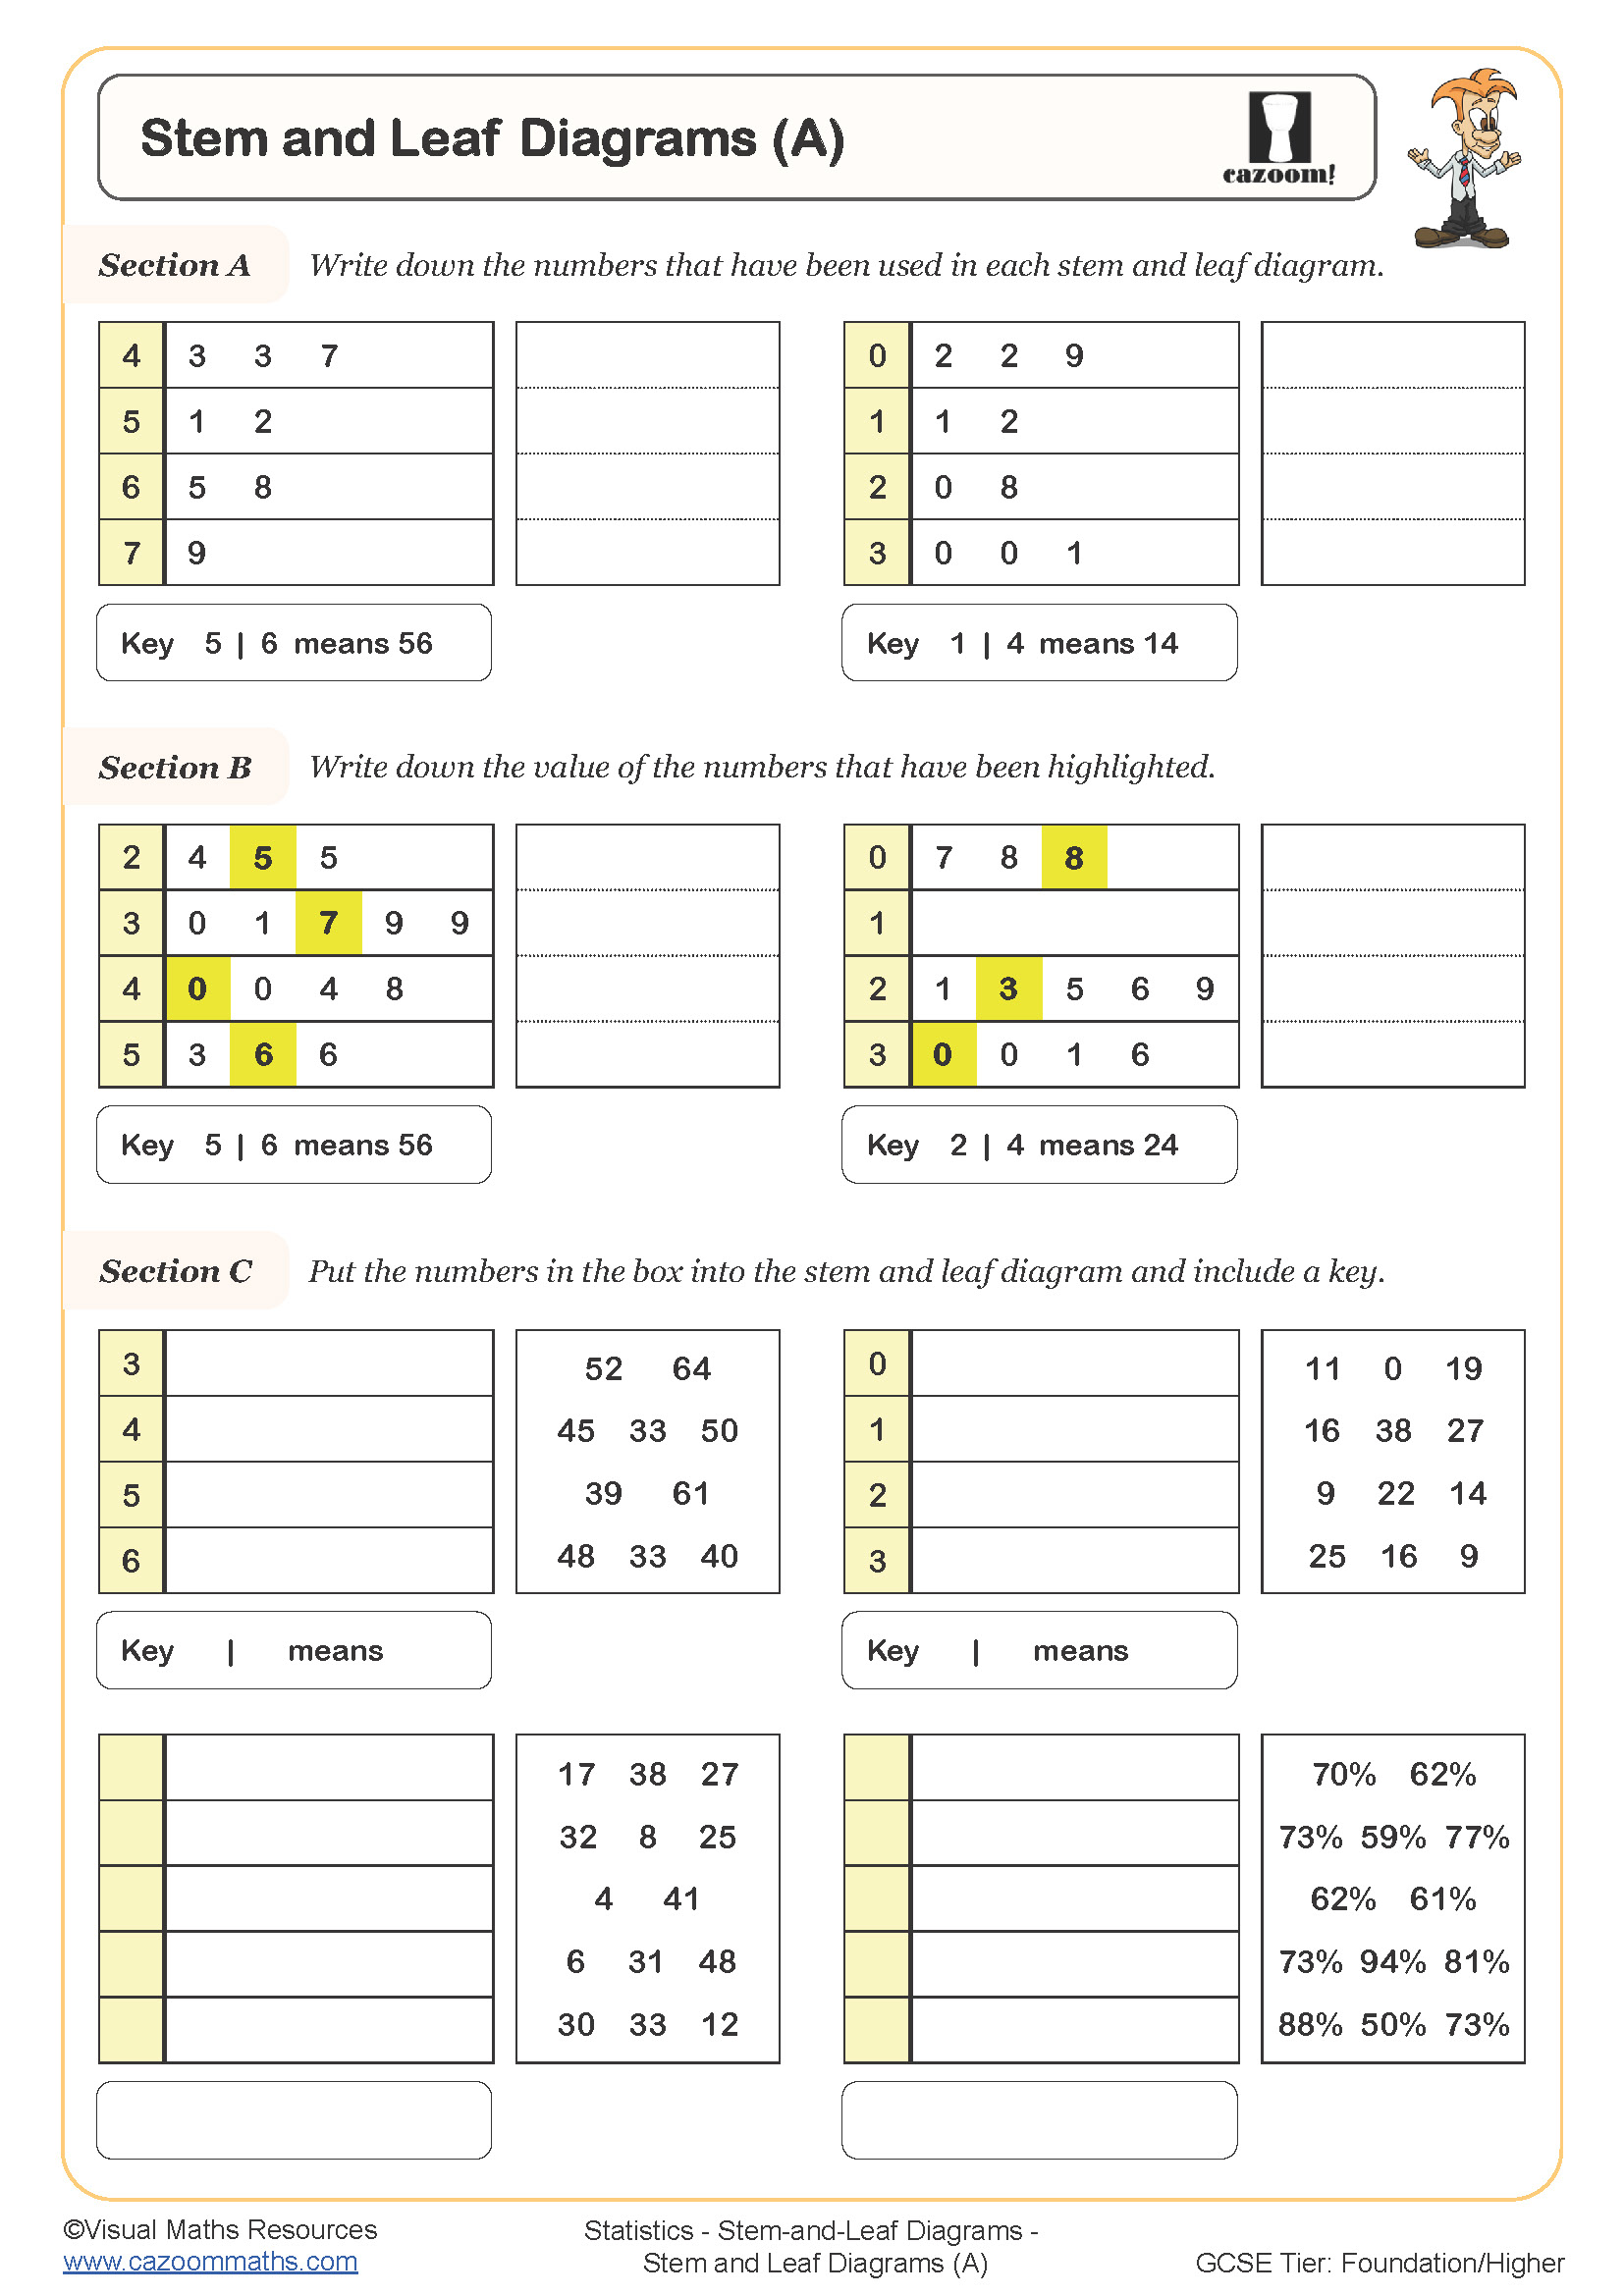
• Building a stem and leaf diagram
• Ordering the leaves and writing a key
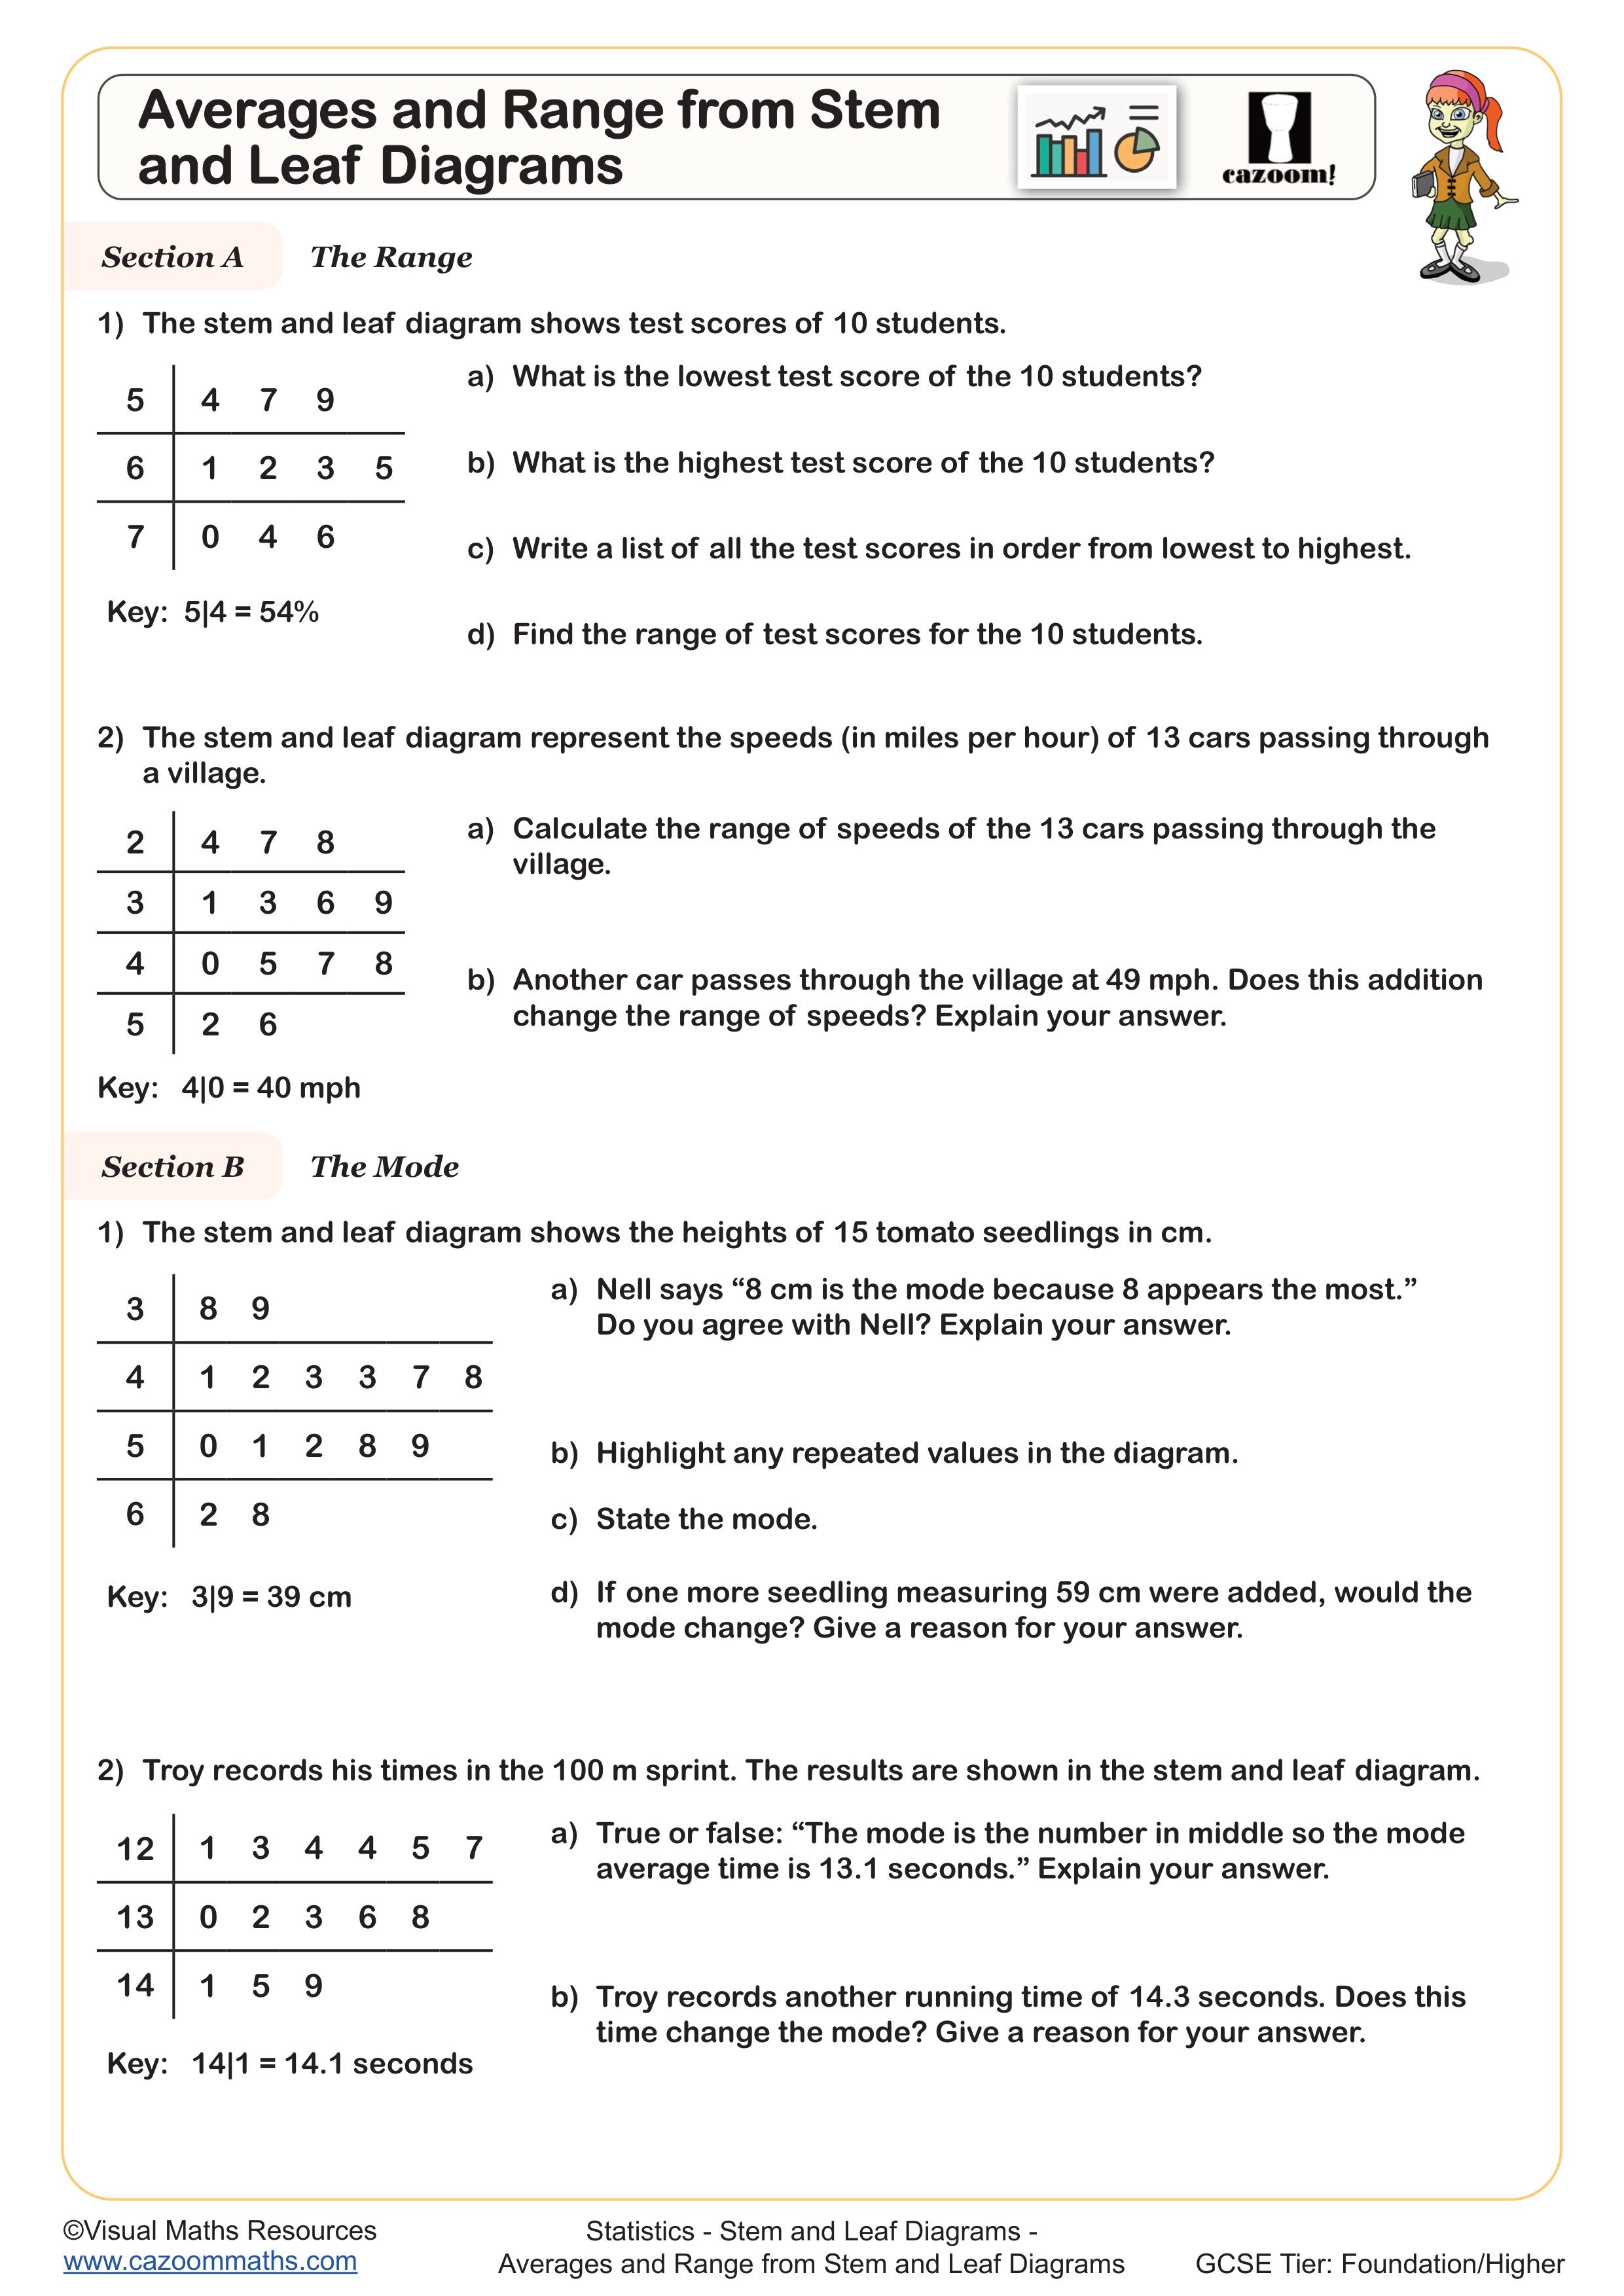
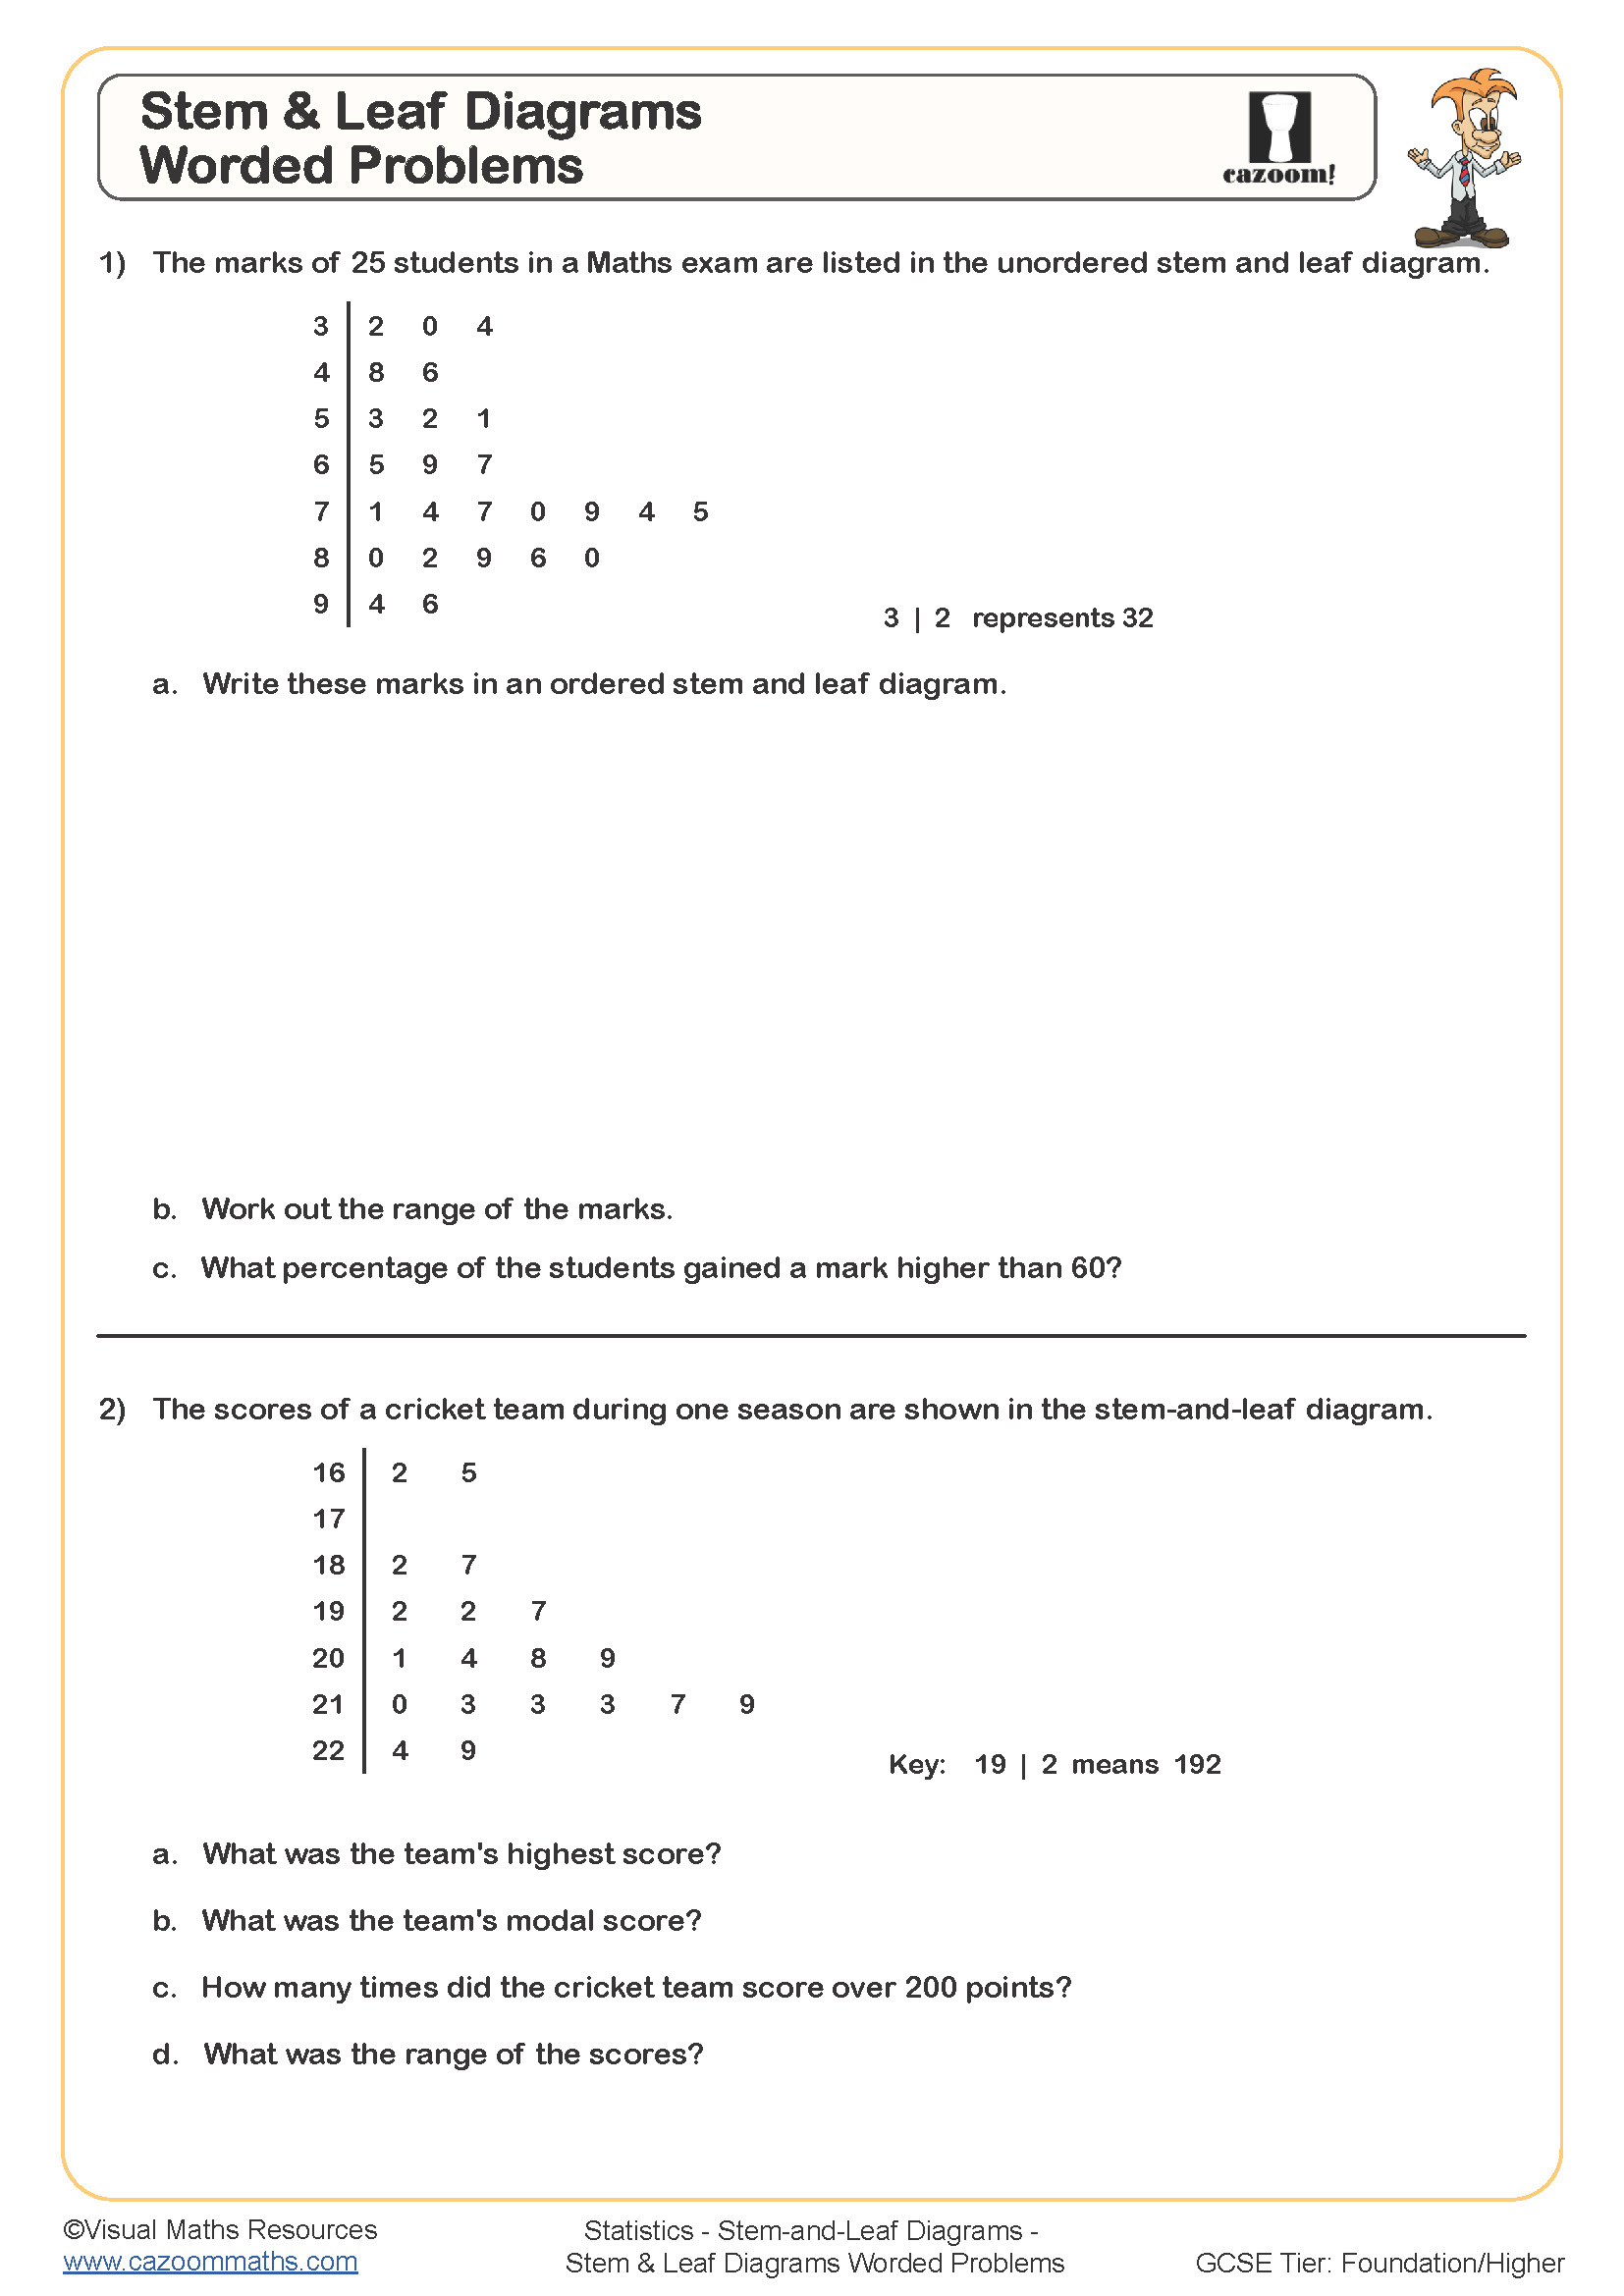
• Reading values from the diagram
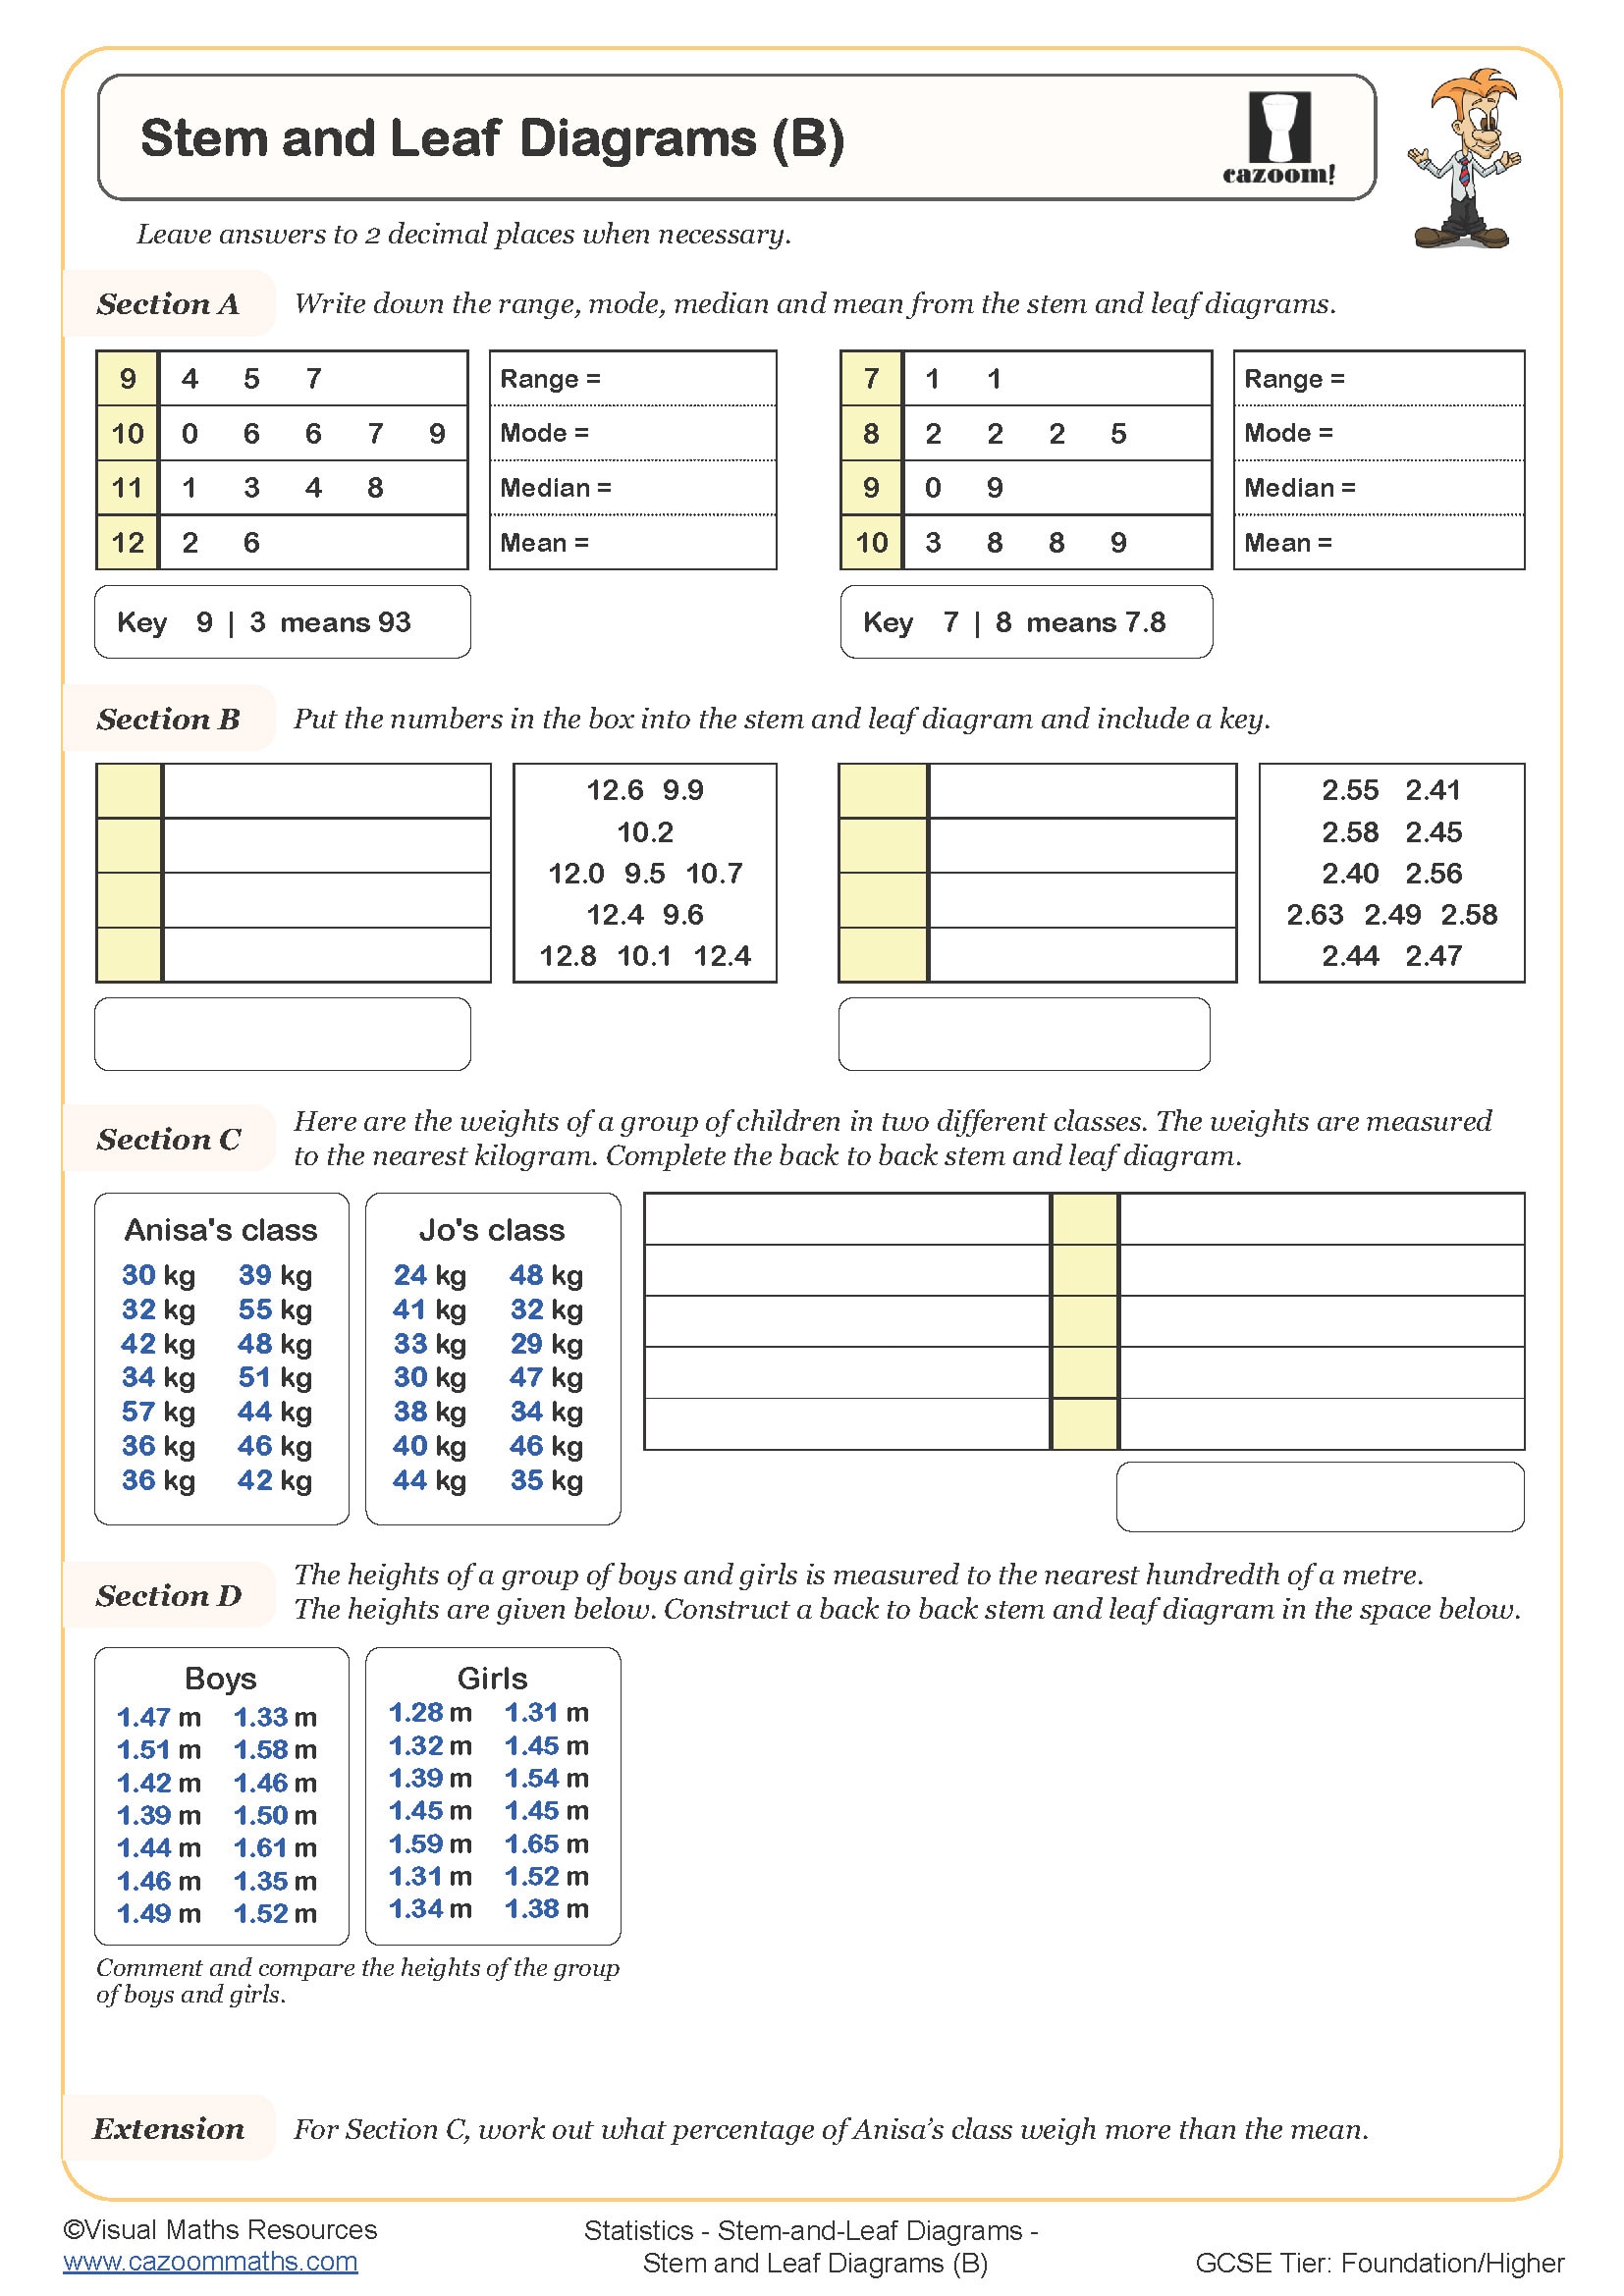
• Median, mode, and range from the diagram
• Back-to-back diagrams for comparison
• Spotting outliers (intro awareness)
Cazoom Maths Stem and Leaf Diagram Worksheets: Complete Topic Coverage at a Glance
A stem and leaf diagram sorts numbers by place value. The stem is the first part. The leaf is the last digit. These worksheets address every aspect of stem and leaf diagram work required at the KS3 level. Starting with simple construction tasks, students learn the importance of ordered leaves and clear keys. The progression includes finding measures of central tendency directly from completed diagrams, eliminating the need for rewriting data lists. Back-to-back diagrams introduce sophisticated comparison techniques, whilst decimal datasets challenge students to adapt their understanding flexibly.
The core skills covered include:
• Constructing diagrams – organising raw data into stems and leaves
• Reading and interpreting – extracting specific values from completed diagrams
• Finding the median – locating middle values directly from diagrams
• Calculating the range – identifying the highest and lowest values efficiently
• Creating keys – explaining what stems and leaves represent
• Back-to-back diagrams – comparing two datasets side by side
• Finding the mode – identifying the most frequent values from leaves
• Working with decimals – adapting diagrams for non-integer data
• Drawing conclusions – making comparisons between different datasets
Confused About Graphs? Discover the Year 7 Stem and Leaf Diagram Solutions
Classroom time is a finite resource, so these activity sheets are engineered to deliver maximum learning return. Each accompanying answer document does more than provide right answers; it lays bare the reasoning behind every drawn diagram, flags the predictable missteps—like mis-sequencing tree leaves or misreading a key—thereby pre-emptively steering learners clear of the cliff edge. Inside every sheet, a natural gradient of challenge occurs as early prompts cover basic competency, paving the way toward deeper problem contexts that balance practice with inquiry. Educators tell us that the uncluttered design keeps mental overhead low, so learners spend mental energy on the maths itself rather than on staffroom-seeming language. Each layout is intentionally and uniformly designed so that daily drill time spent briefing on how to work on paper is kept to an uninformed minimum, allowing a longer unbroken ride toward statistical insight. Because variety is baked in, teachers find the sheets adaptive; they serve homework, rejoice in predictable pacing, and prepare for imminent assessment, all without the friction of deja vu.
Practical Stem and Leaf Diagram Examples KS3 Students Face Daily
Understanding stem and leaf diagrams equips students with practical data analysis tools used across numerous fields. These representations excel when individual data points matter as much as overall patterns.
• Listing test scores for a class
• Recording lap times
• Comparing ages in two groups
• Looking at shoe sizes
• Organising survey numbers