Year 7 Two-Way Tables and Pictograms Worksheets
All worksheets are created by the team of experienced teachers at Cazoom Maths.
7 Key Benefits of Using These Printable PDF KS3 Two-Way Tables and Pictograms Activities
The two-way table requires students to organise categorical data while they process information across multiple dimensions at the same time. The complex nature of this subject enables students to develop critical thinking abilities, which are essential for studying advanced mathematics. The combination of pictograms with frequency tables enables students to develop essential visual-numerical connections which enhance their comprehension. The ability to switch between representations builds flexibility in approaching data problems. Students learn to identify variable relationships that single-dimension tables fail to show. The dual formats require regular practice to develop analytical skills, which students need for their entire curriculum. The ability to move from reading pre-made tables to creating personal tables enables students to develop their independent statistical reasoning skills.
Specific learning benefits include:
• Organises categorical data systematically
• Interprets dual-variable relationships accurately
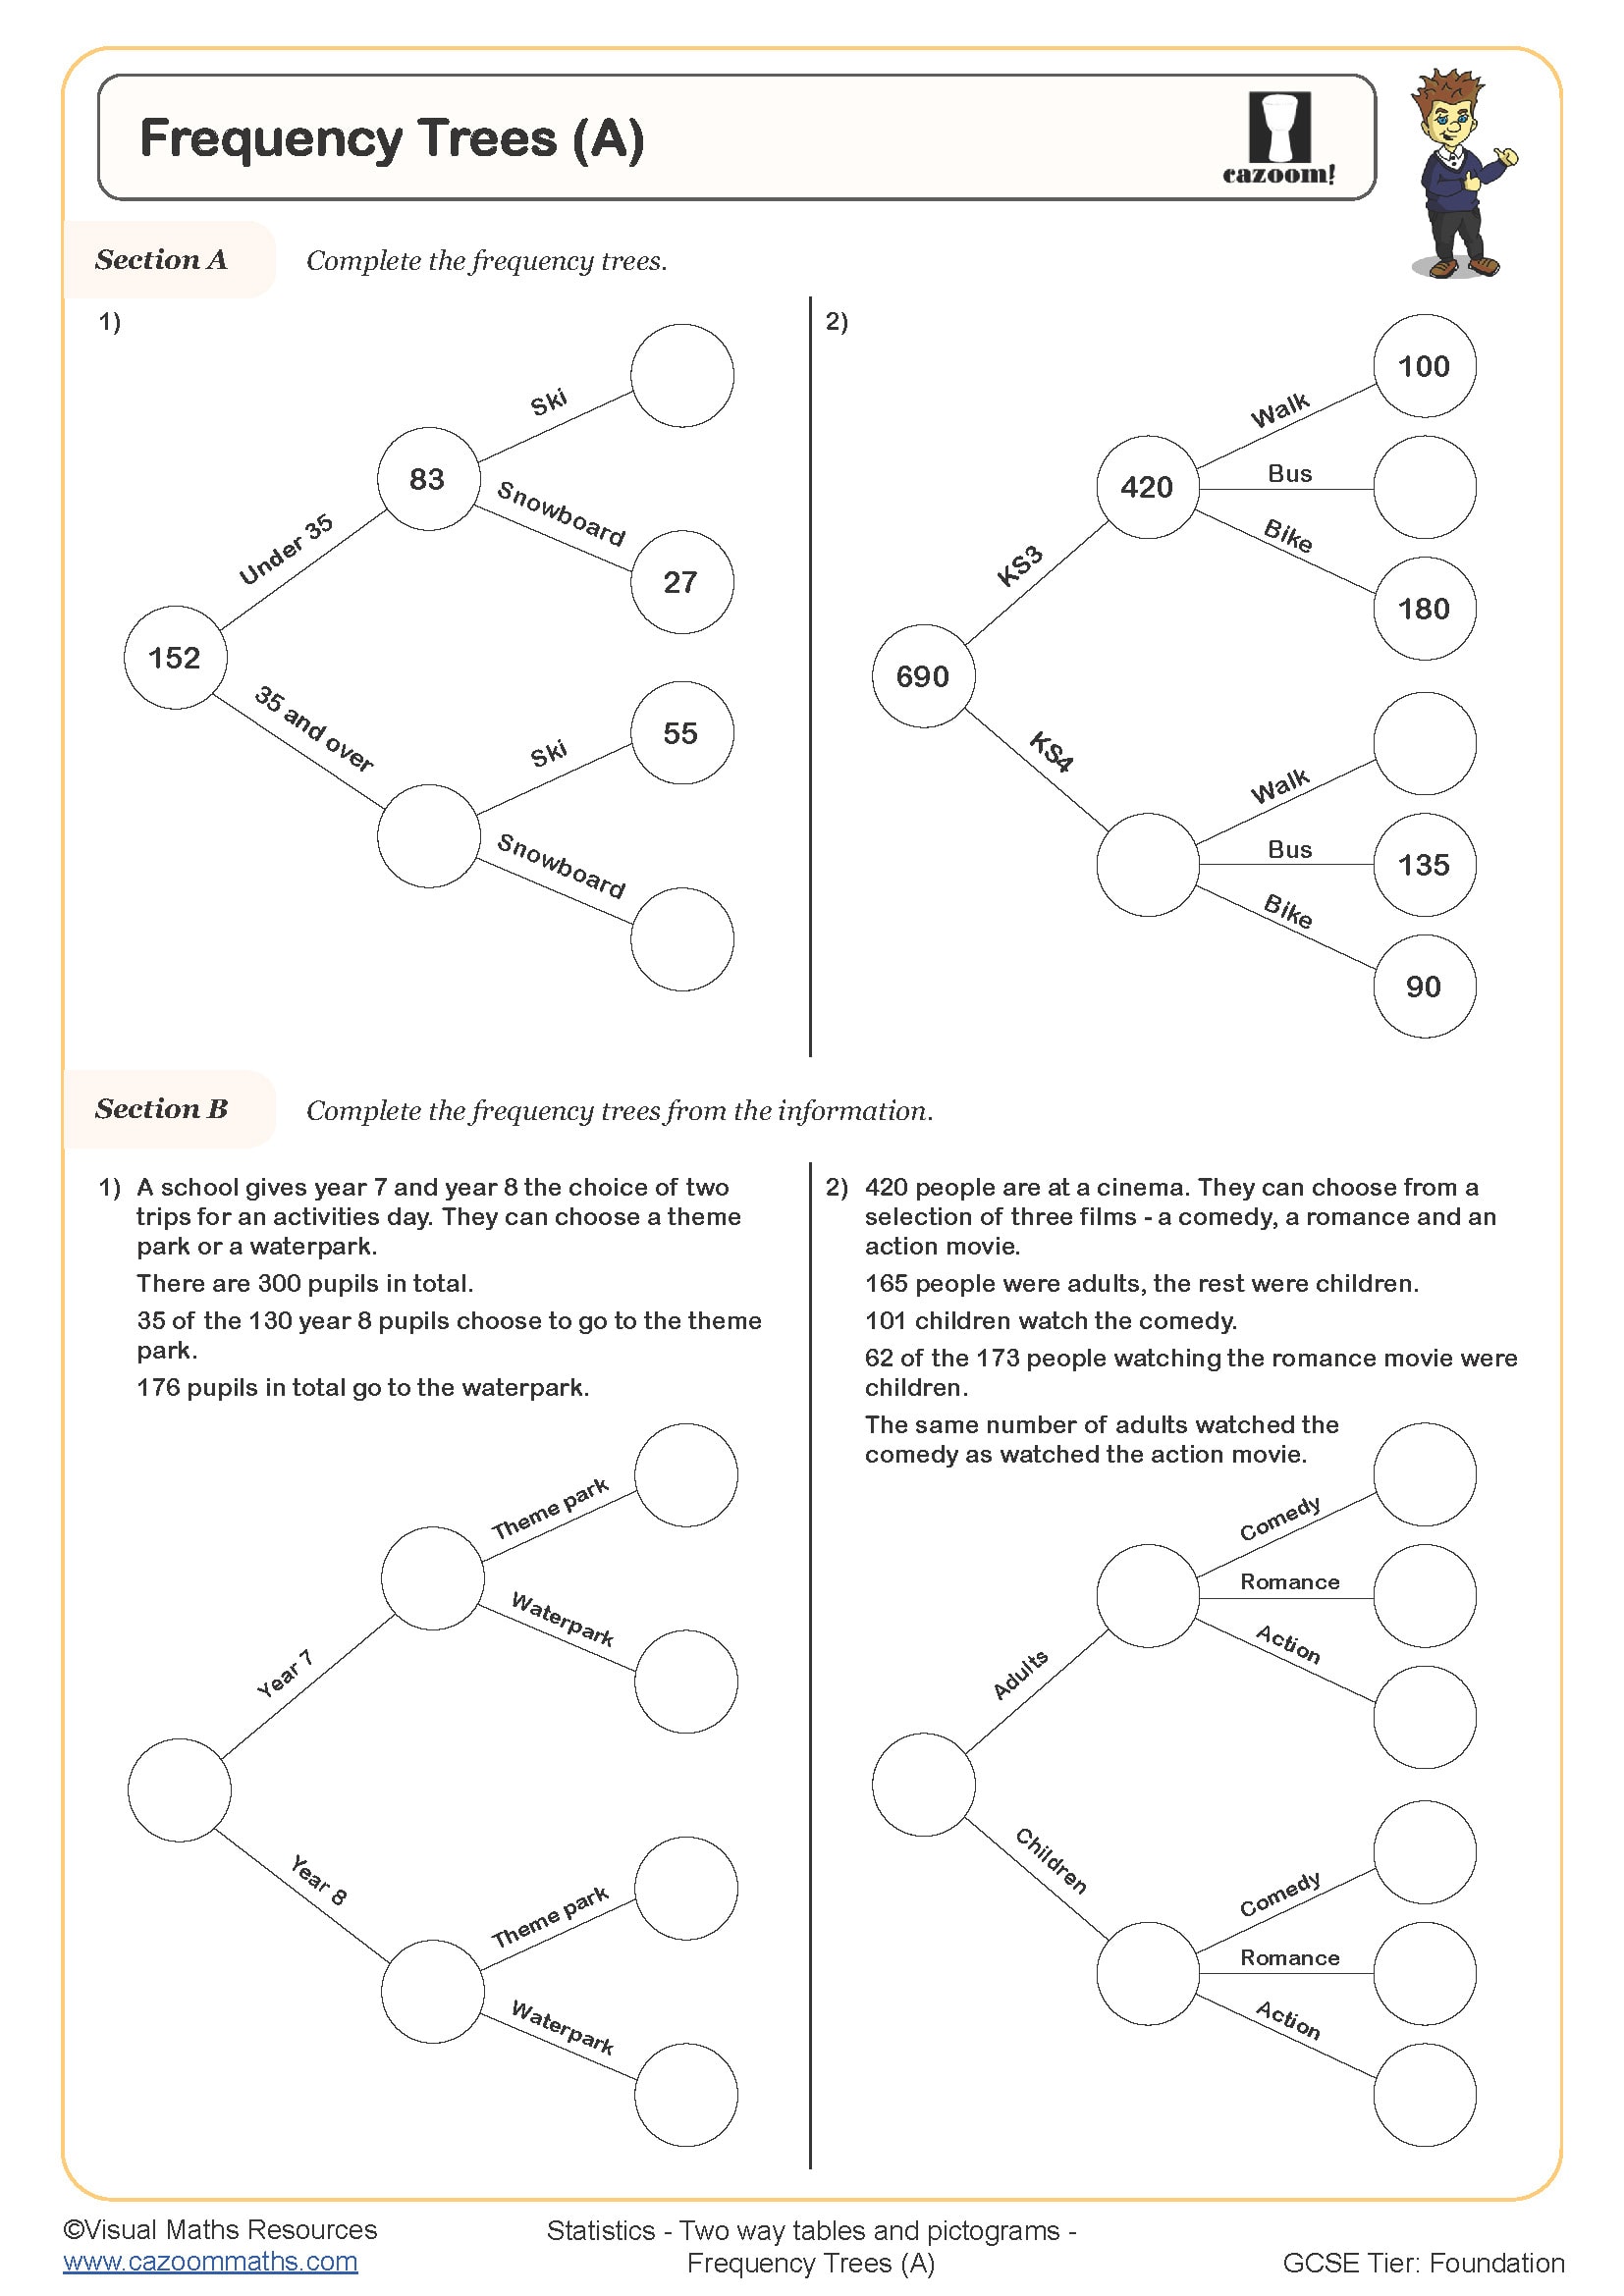
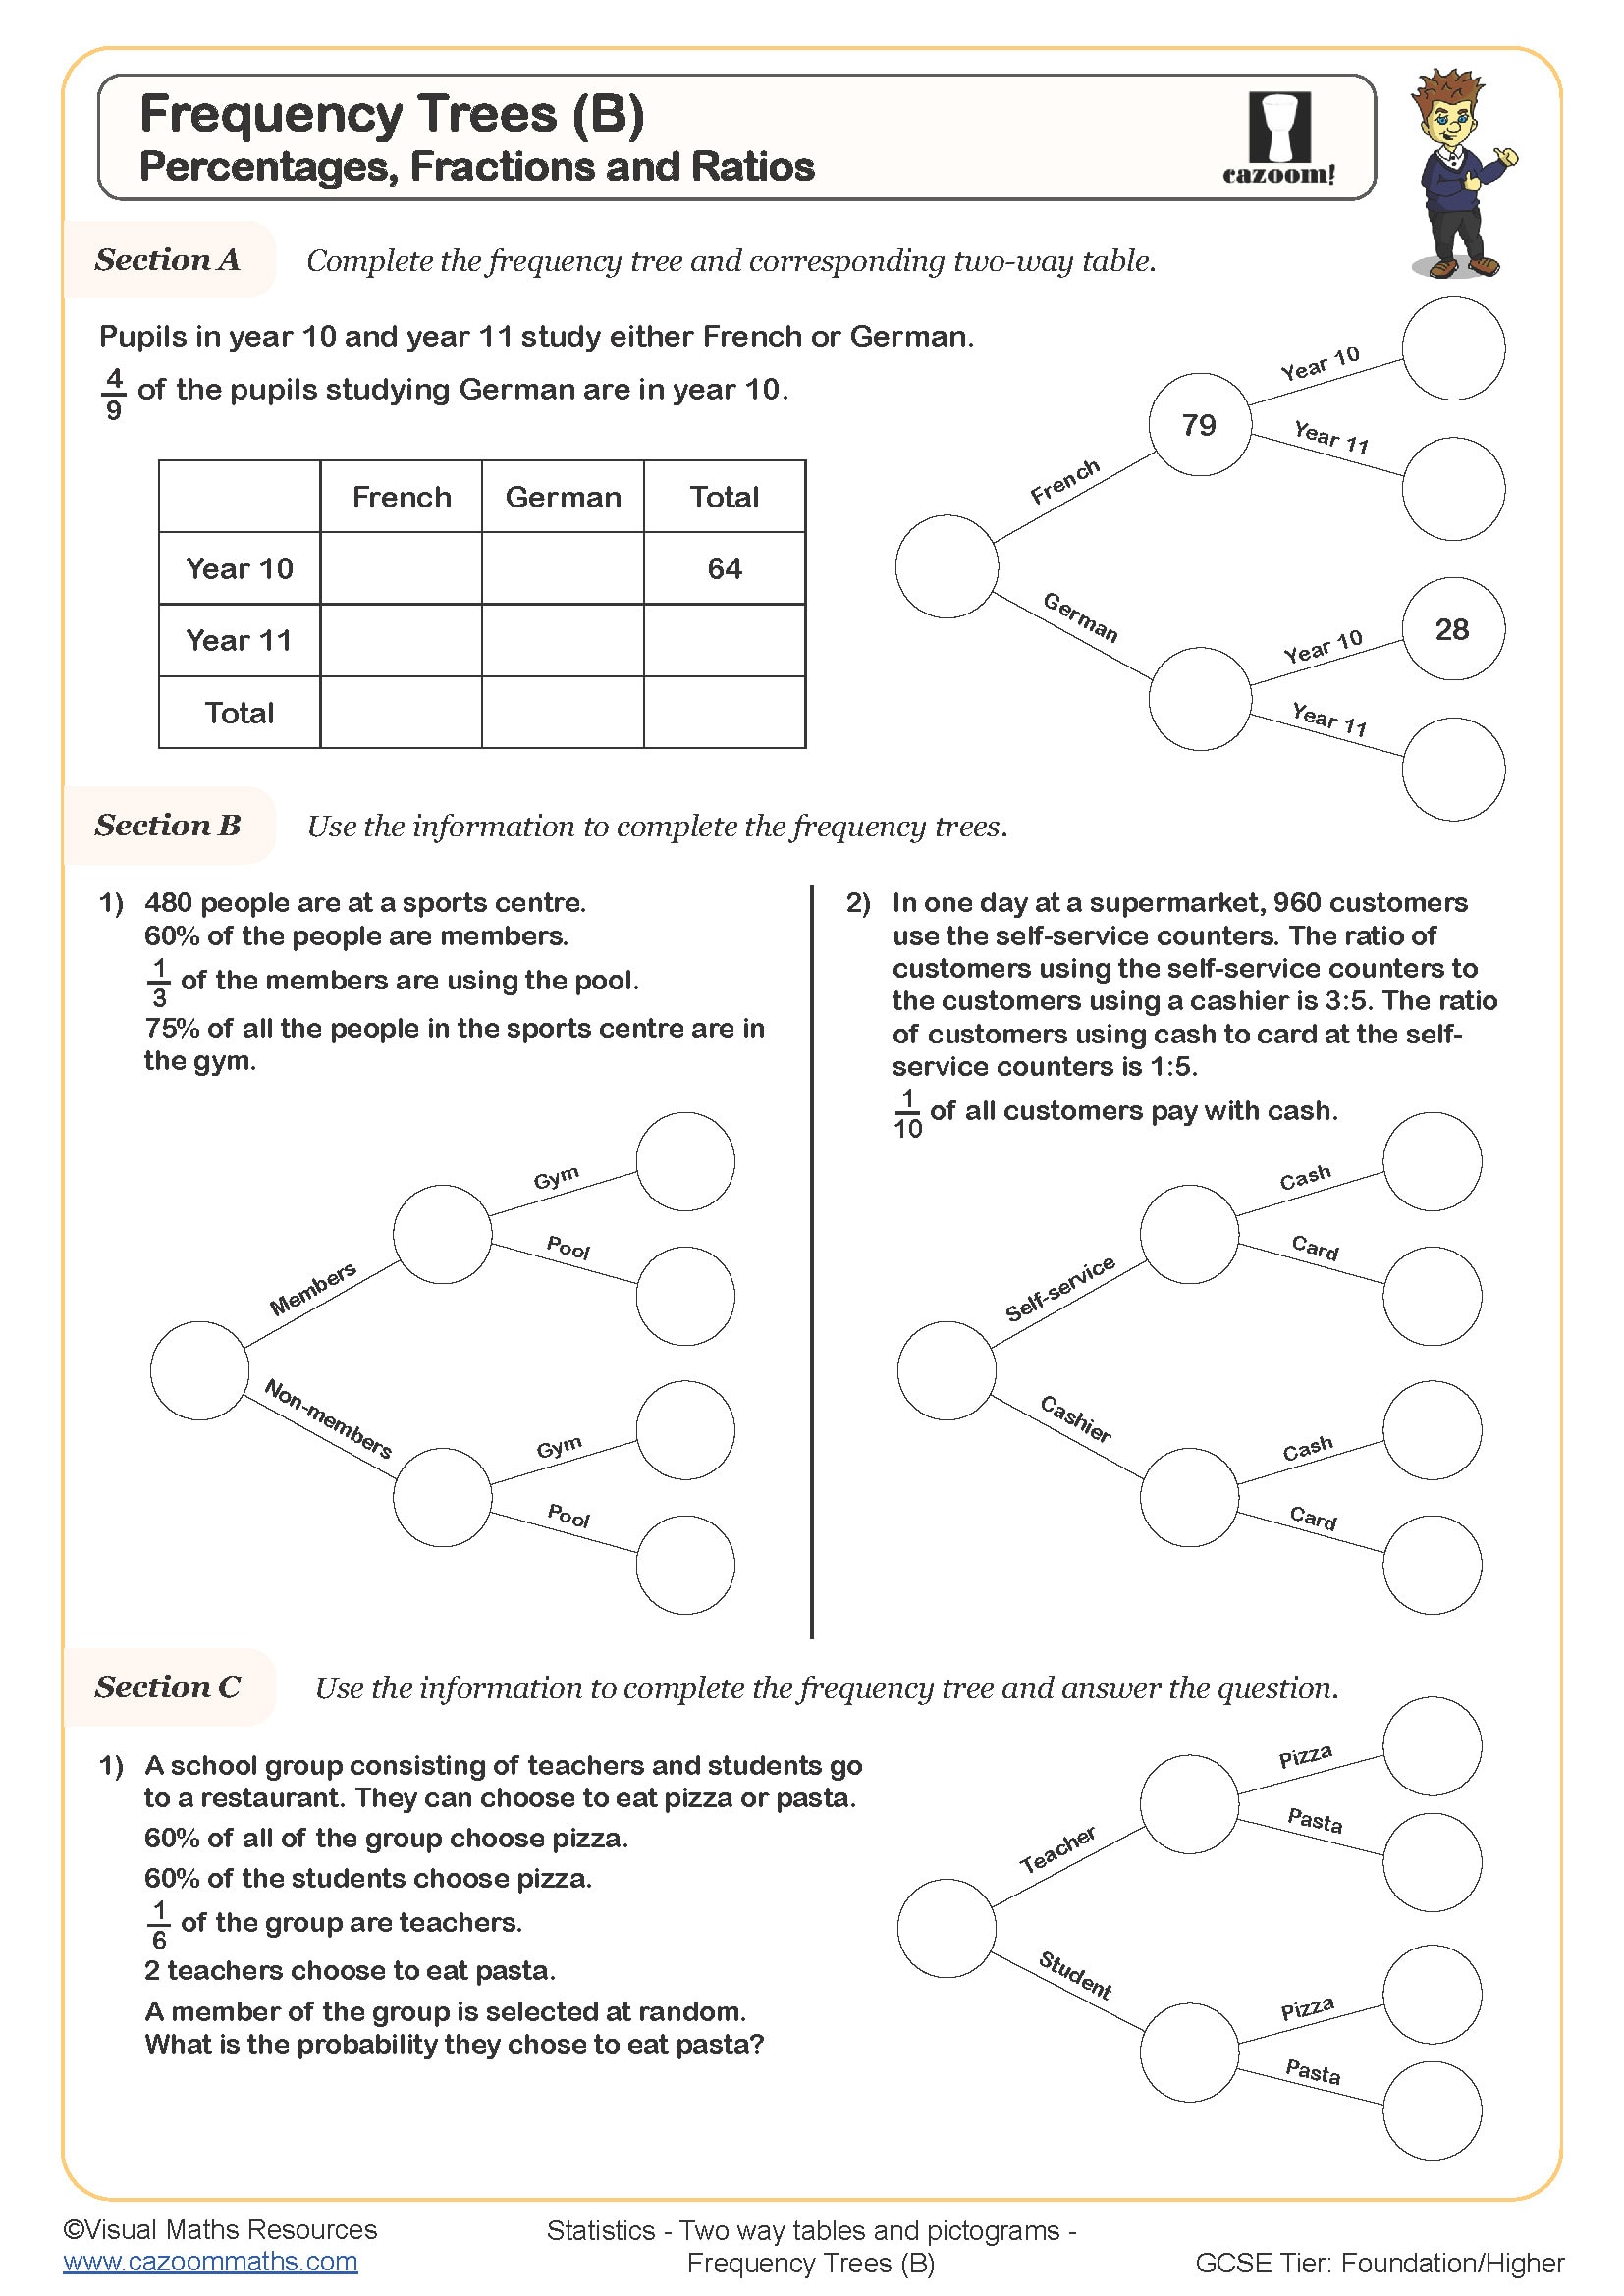
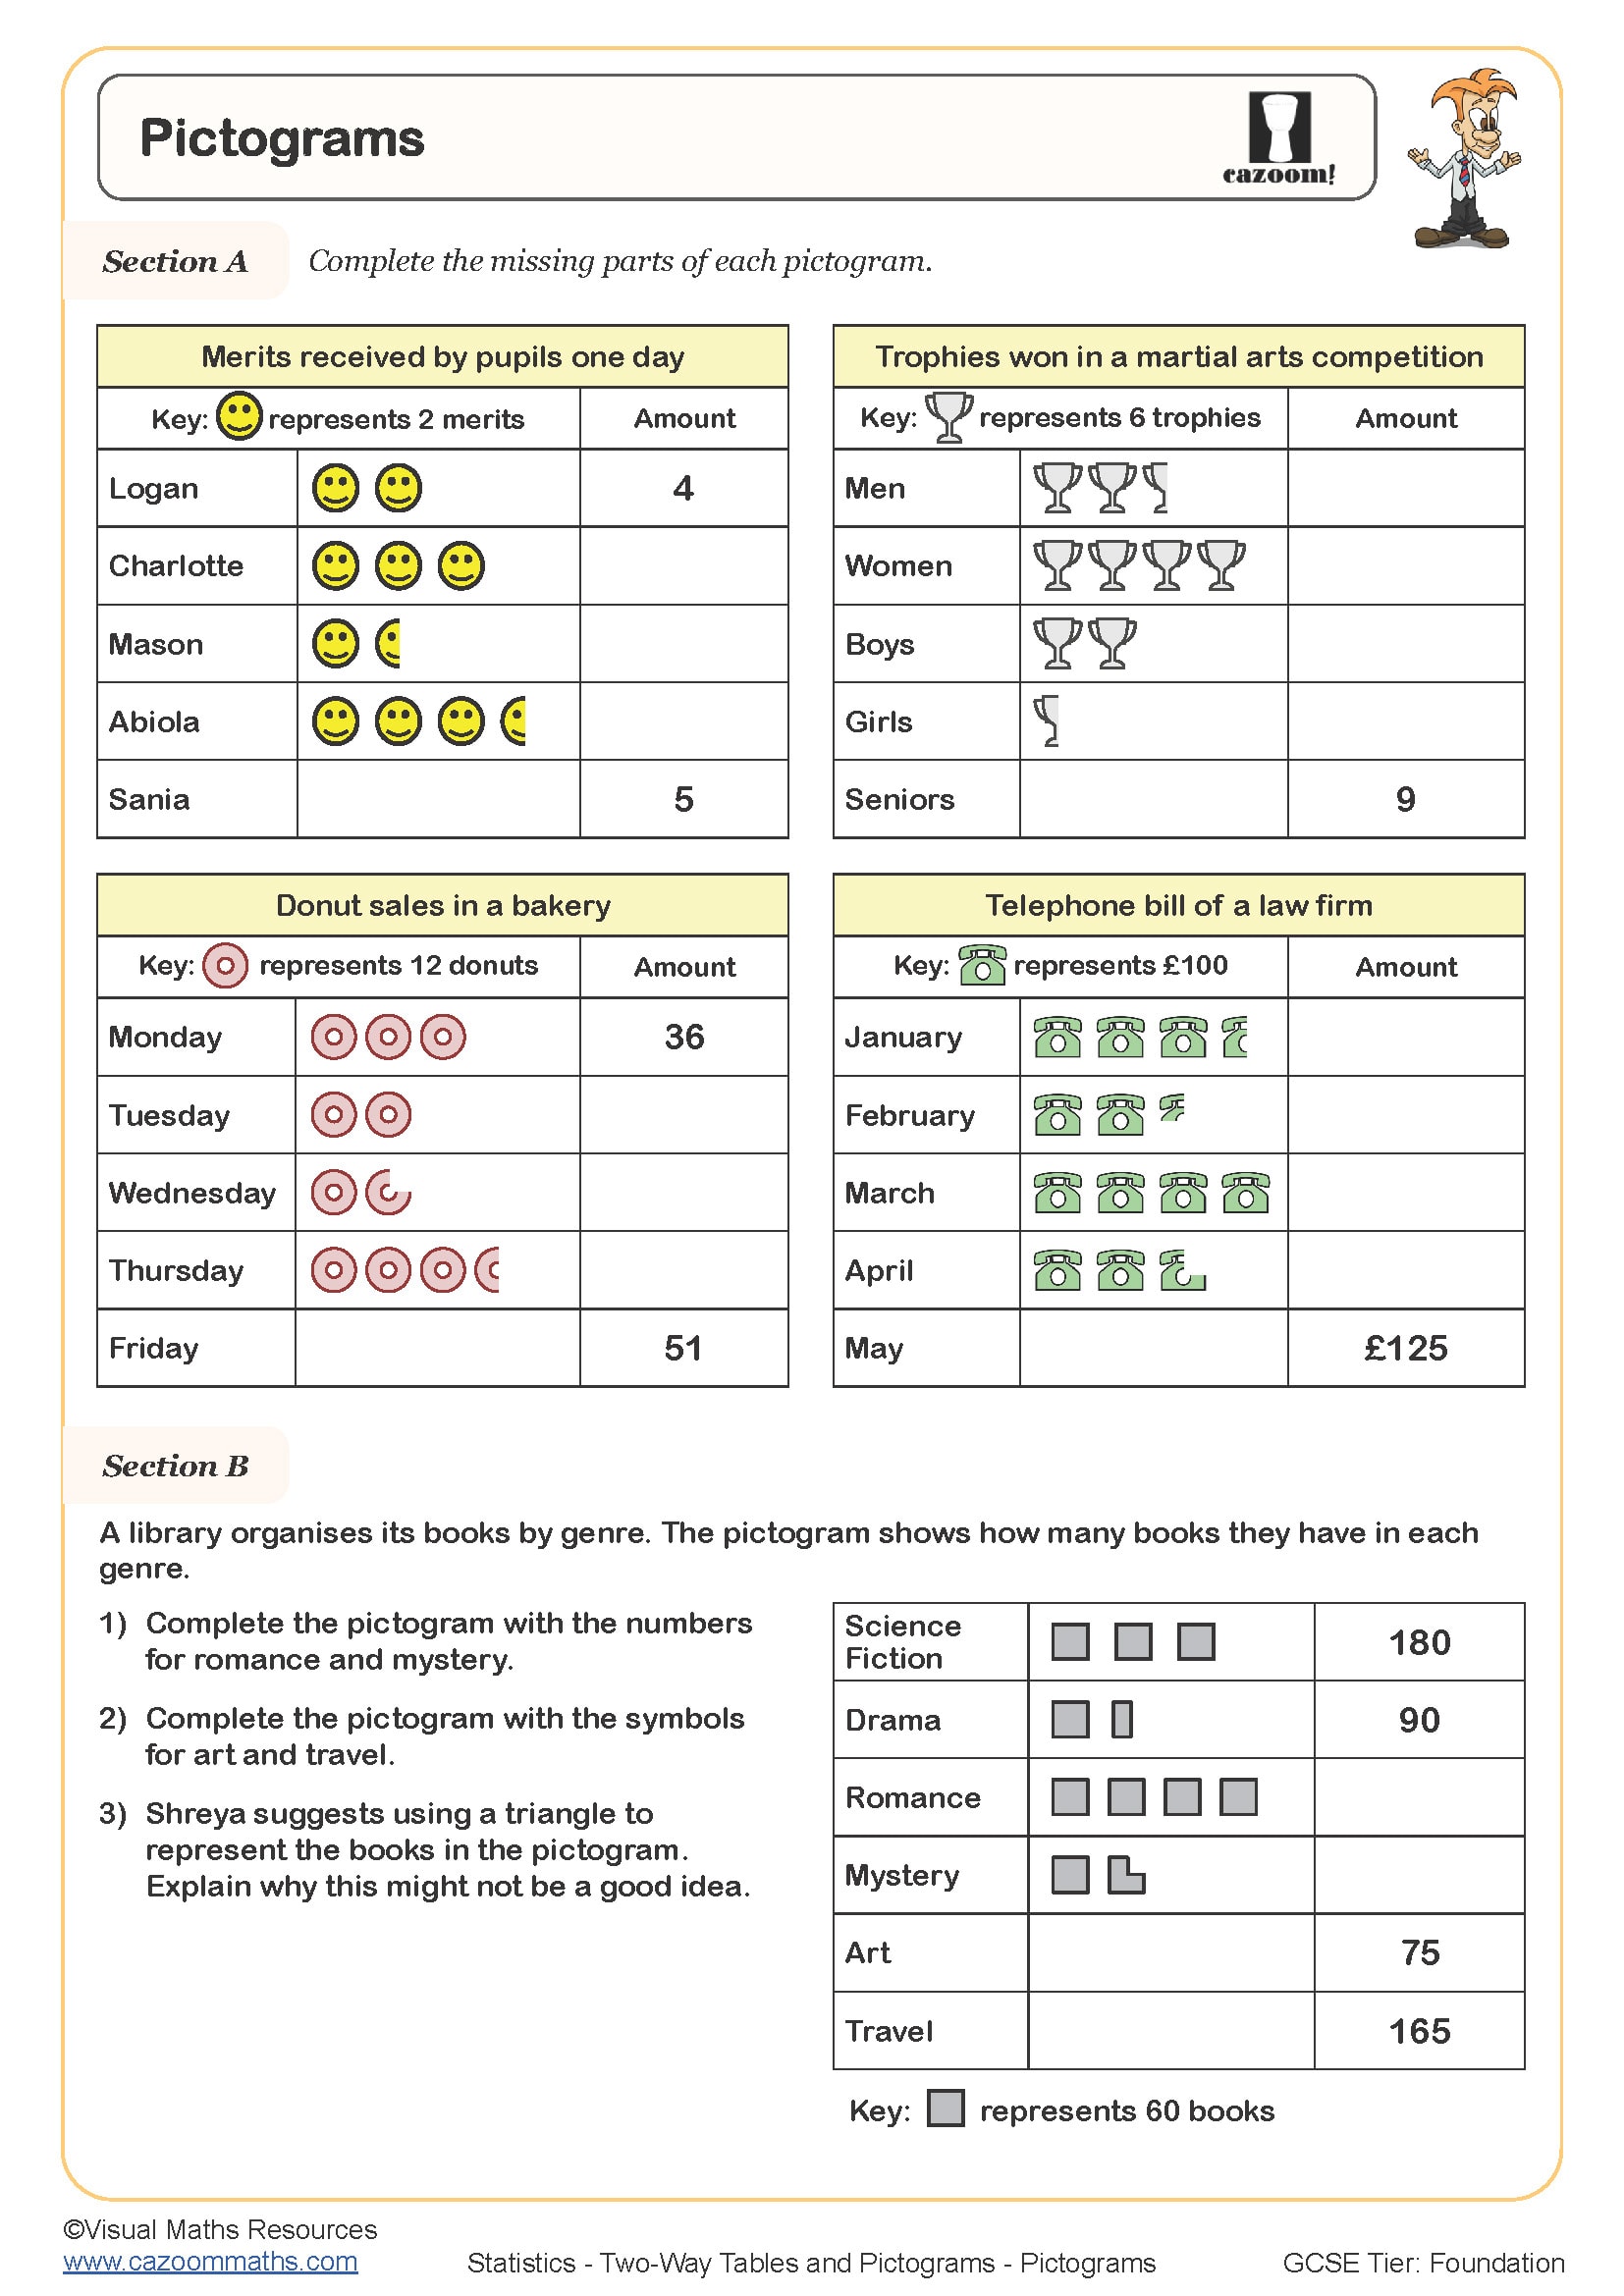
• Converts pictograms to numerical values
• Develops frequency calculation skills
• Strengthens data comparison abilities
• Prepares the foundation for probability work
• Builds cross-curricular connections
From Frequency Trees to Pictograms: Your Worksheet Topic Overview
These worksheets scaffold learning from basic pictogram interpretation through to complex table construction with worked solutions demonstrating step-by-step reasoning processes. Materials balance computational practice with interpretative questions, ensuring comprehensive skill development. Visual representations support different learning styles whilst maintaining mathematical rigour throughout. Each topic builds upon previous knowledge, creating a coherent learning journey through Year 7 statistics. We have included essential concepts like Frequency Trees and Pictograms.
Attention Teachers: Boost Accuracy With Cazoom Maths Statistics Resources
Year 7 students face difficulties in learning abstract statistical concepts because they enter the classroom with different primary school backgrounds, according to professional educators. The worksheets help students fill knowledge gaps by using exercises that are neither too difficult for struggling students nor too easy for advanced students. The use of answer sheets by teachers helps both students and teachers because it saves grading time and helps students understand the assessment criteria better. The natural process of differentiation emerges through worksheet selection, which enables teachers to provide whole-class instruction while offering individualised support. Clear formatting reduces cognitive load, letting students focus on mathematical content rather than decoding instructions. The materials show modern teaching approaches which focus on teaching both procedural fluency and conceptual understanding. Teachers state that these resources boost student involvement in their classroom work and their homework assignments.
Everyday Maths: Where Year 7 Students Use Two-Way Tables and Pictograms in Real Life
Statistical literacy shapes how young people navigate an increasingly data-driven world. Understanding two-way tables enables informed decision-making across countless situations.
• School surveys – analysing student preferences by year group
• Gaming statistics – tracking wins across different game modes
• Social media metrics – comparing engagement across platforms
• Sports performance – recording results by team and venue
• Weather patterns – comparing temperatures across seasons and locations
• Shopping comparisons – evaluating products by price and quality ratings
• Science experiments – recording results with multiple variables
• Geography fieldwork – categorising data by location and characteristic