Year 8 Averages and Range Worksheets
Averages from Frequency Tables

Averages from Grouped Data

Averages from Stem and Leaf Diagrams

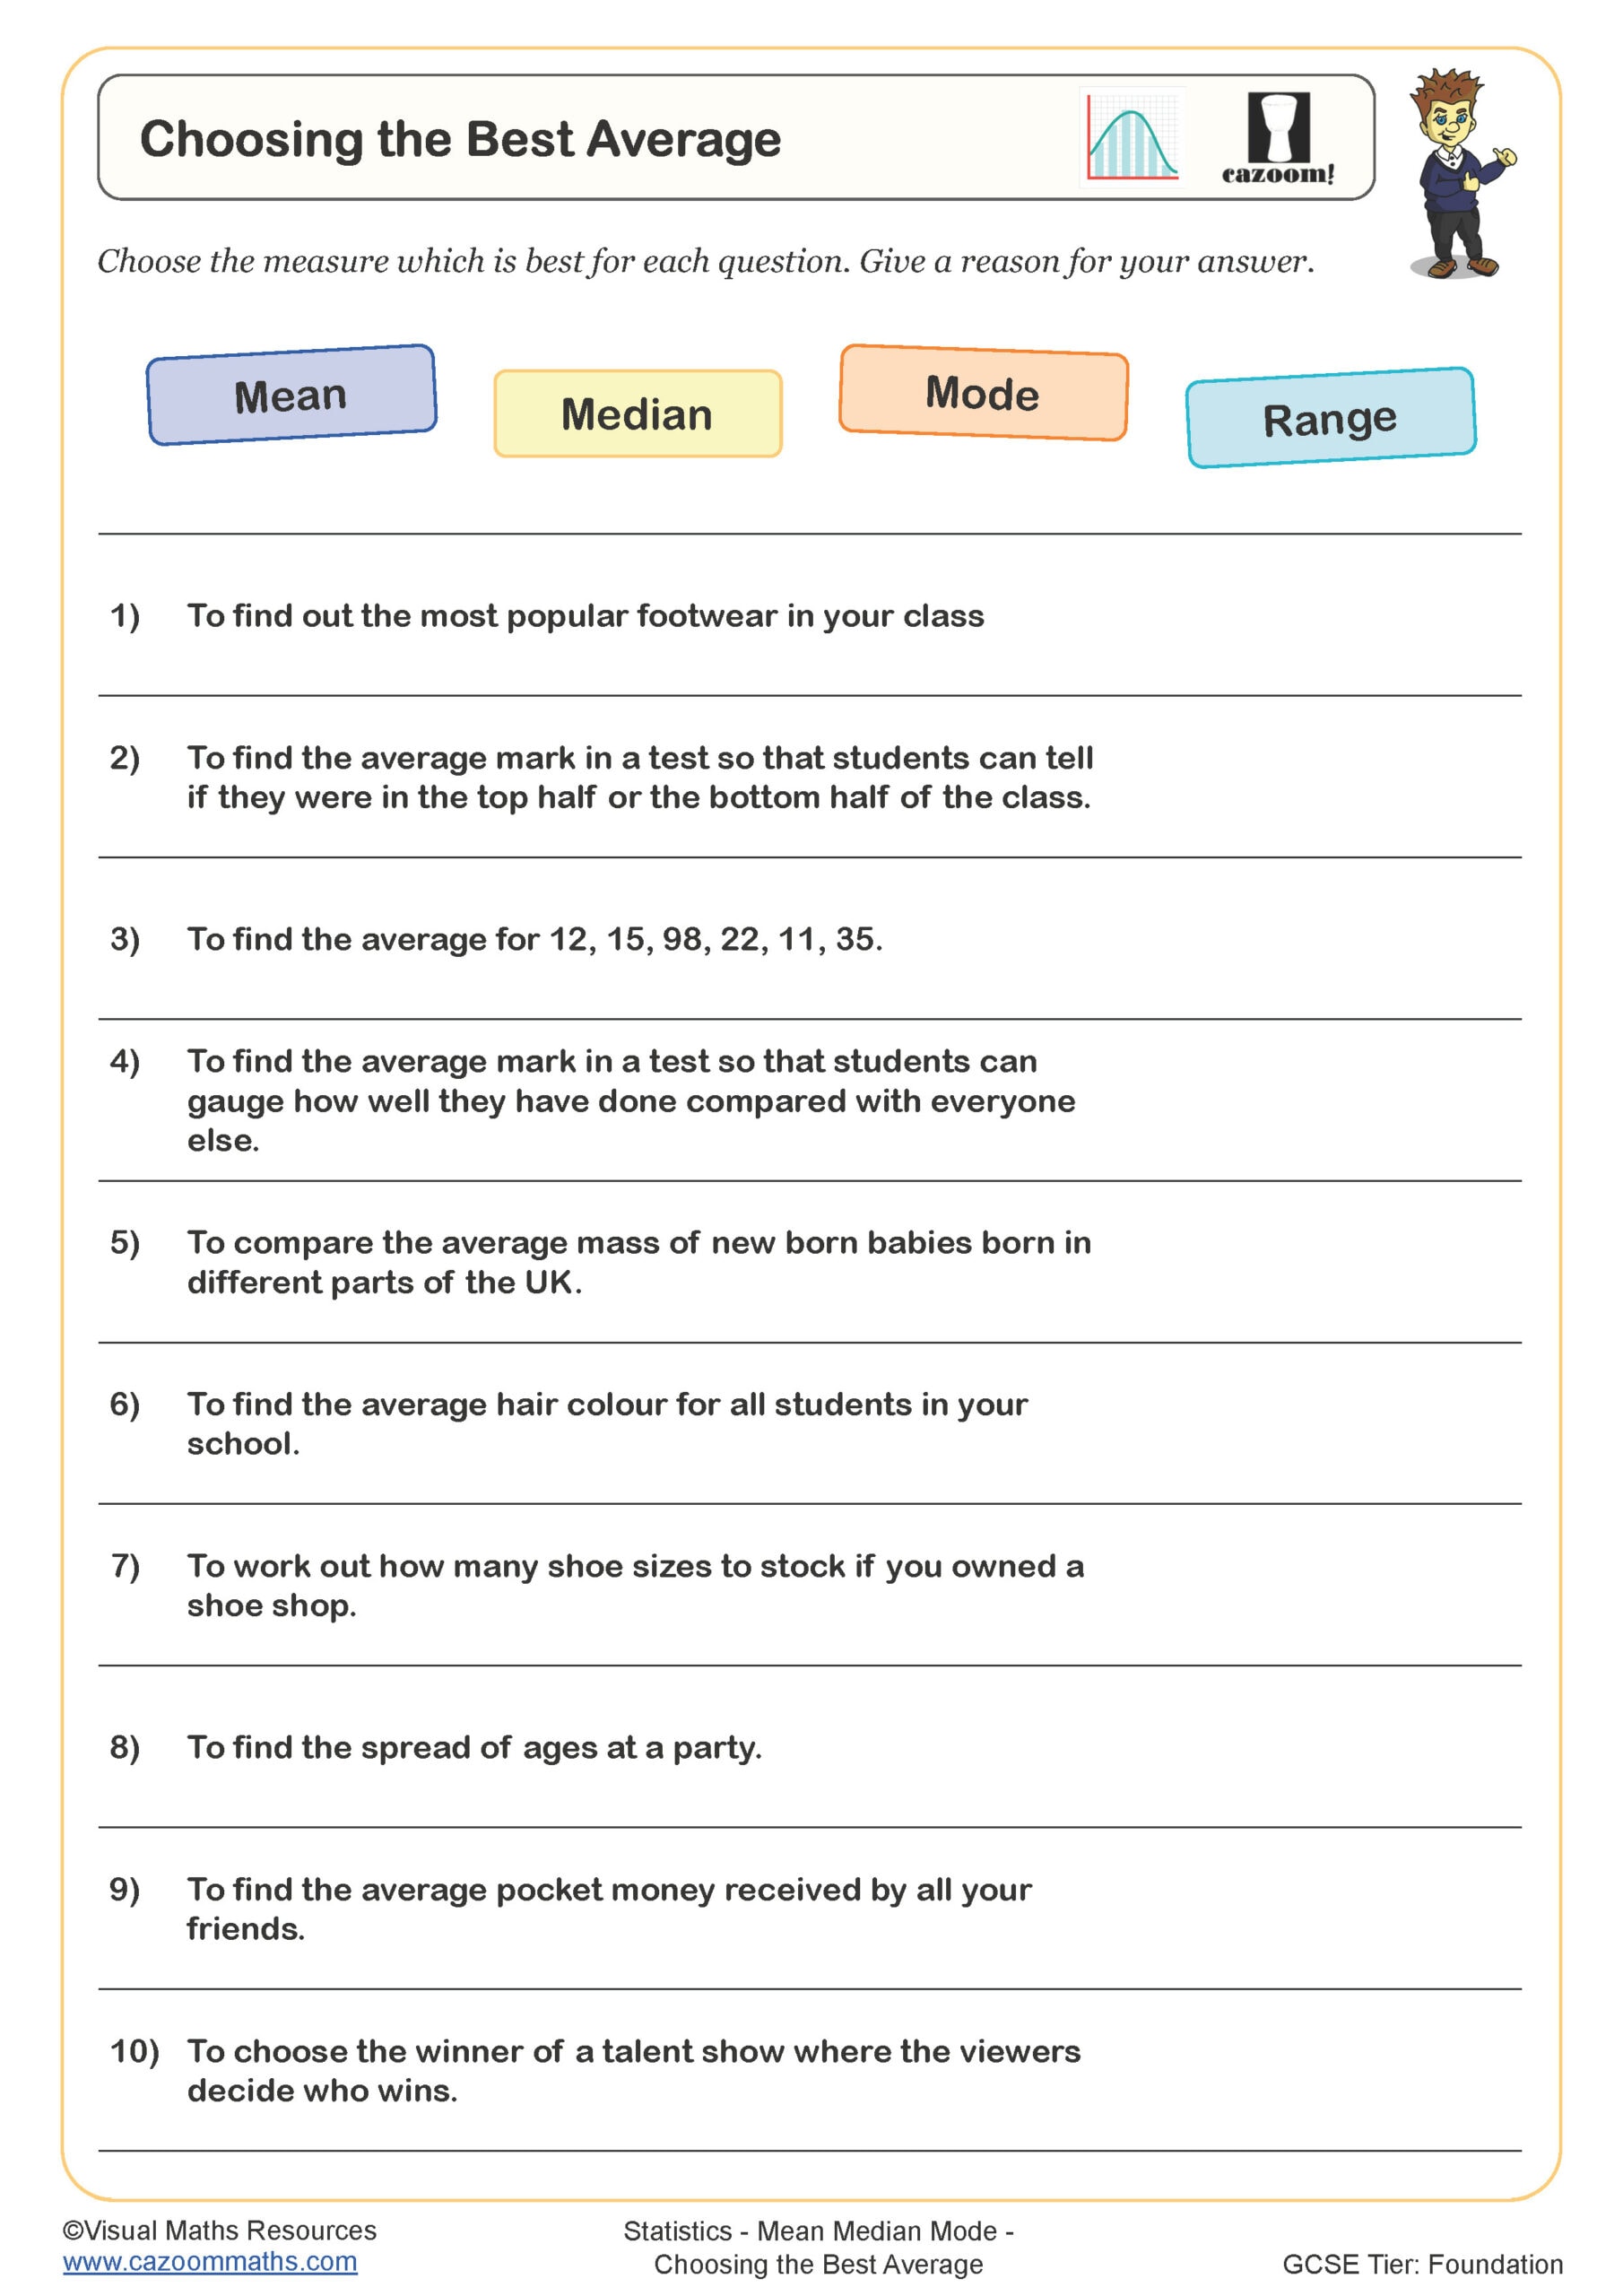
Choosing the Best Average
Comparing Two Sets of Data

Estimate of the Mean

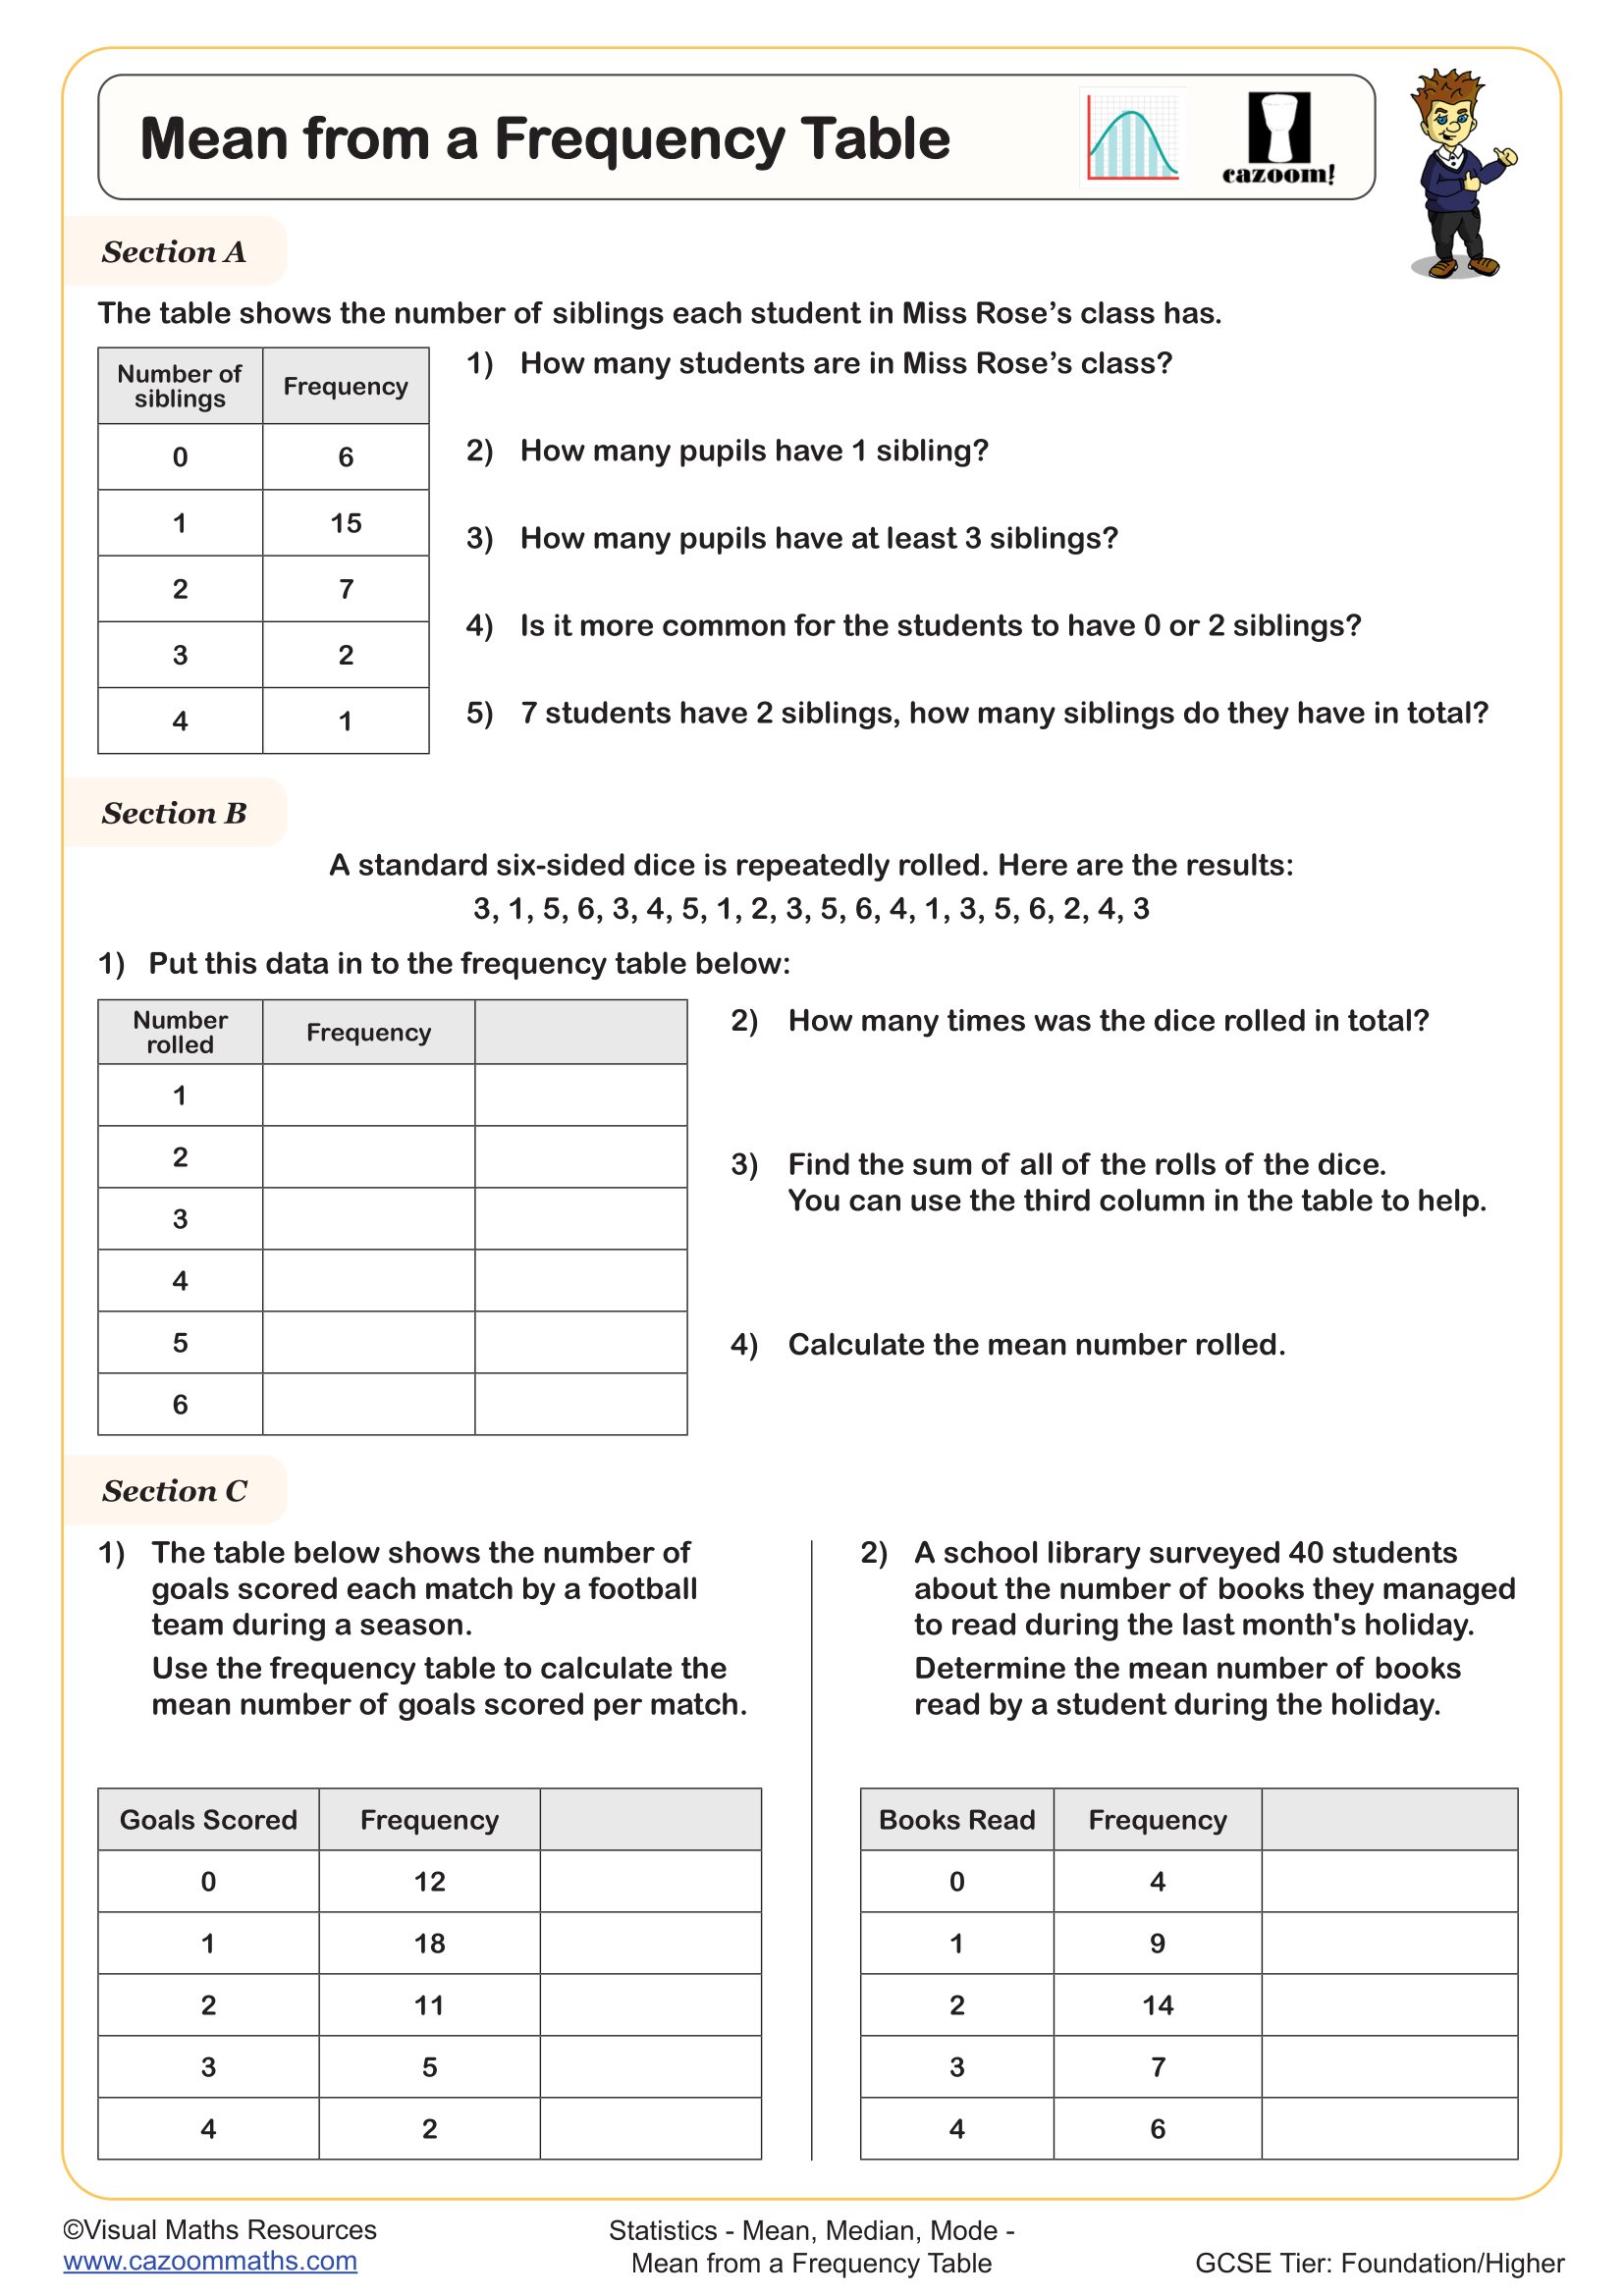
Mean from a Frequency Table
Mean, Median, Mode and Range (A)

Mean, Median, Mode and Range (B)

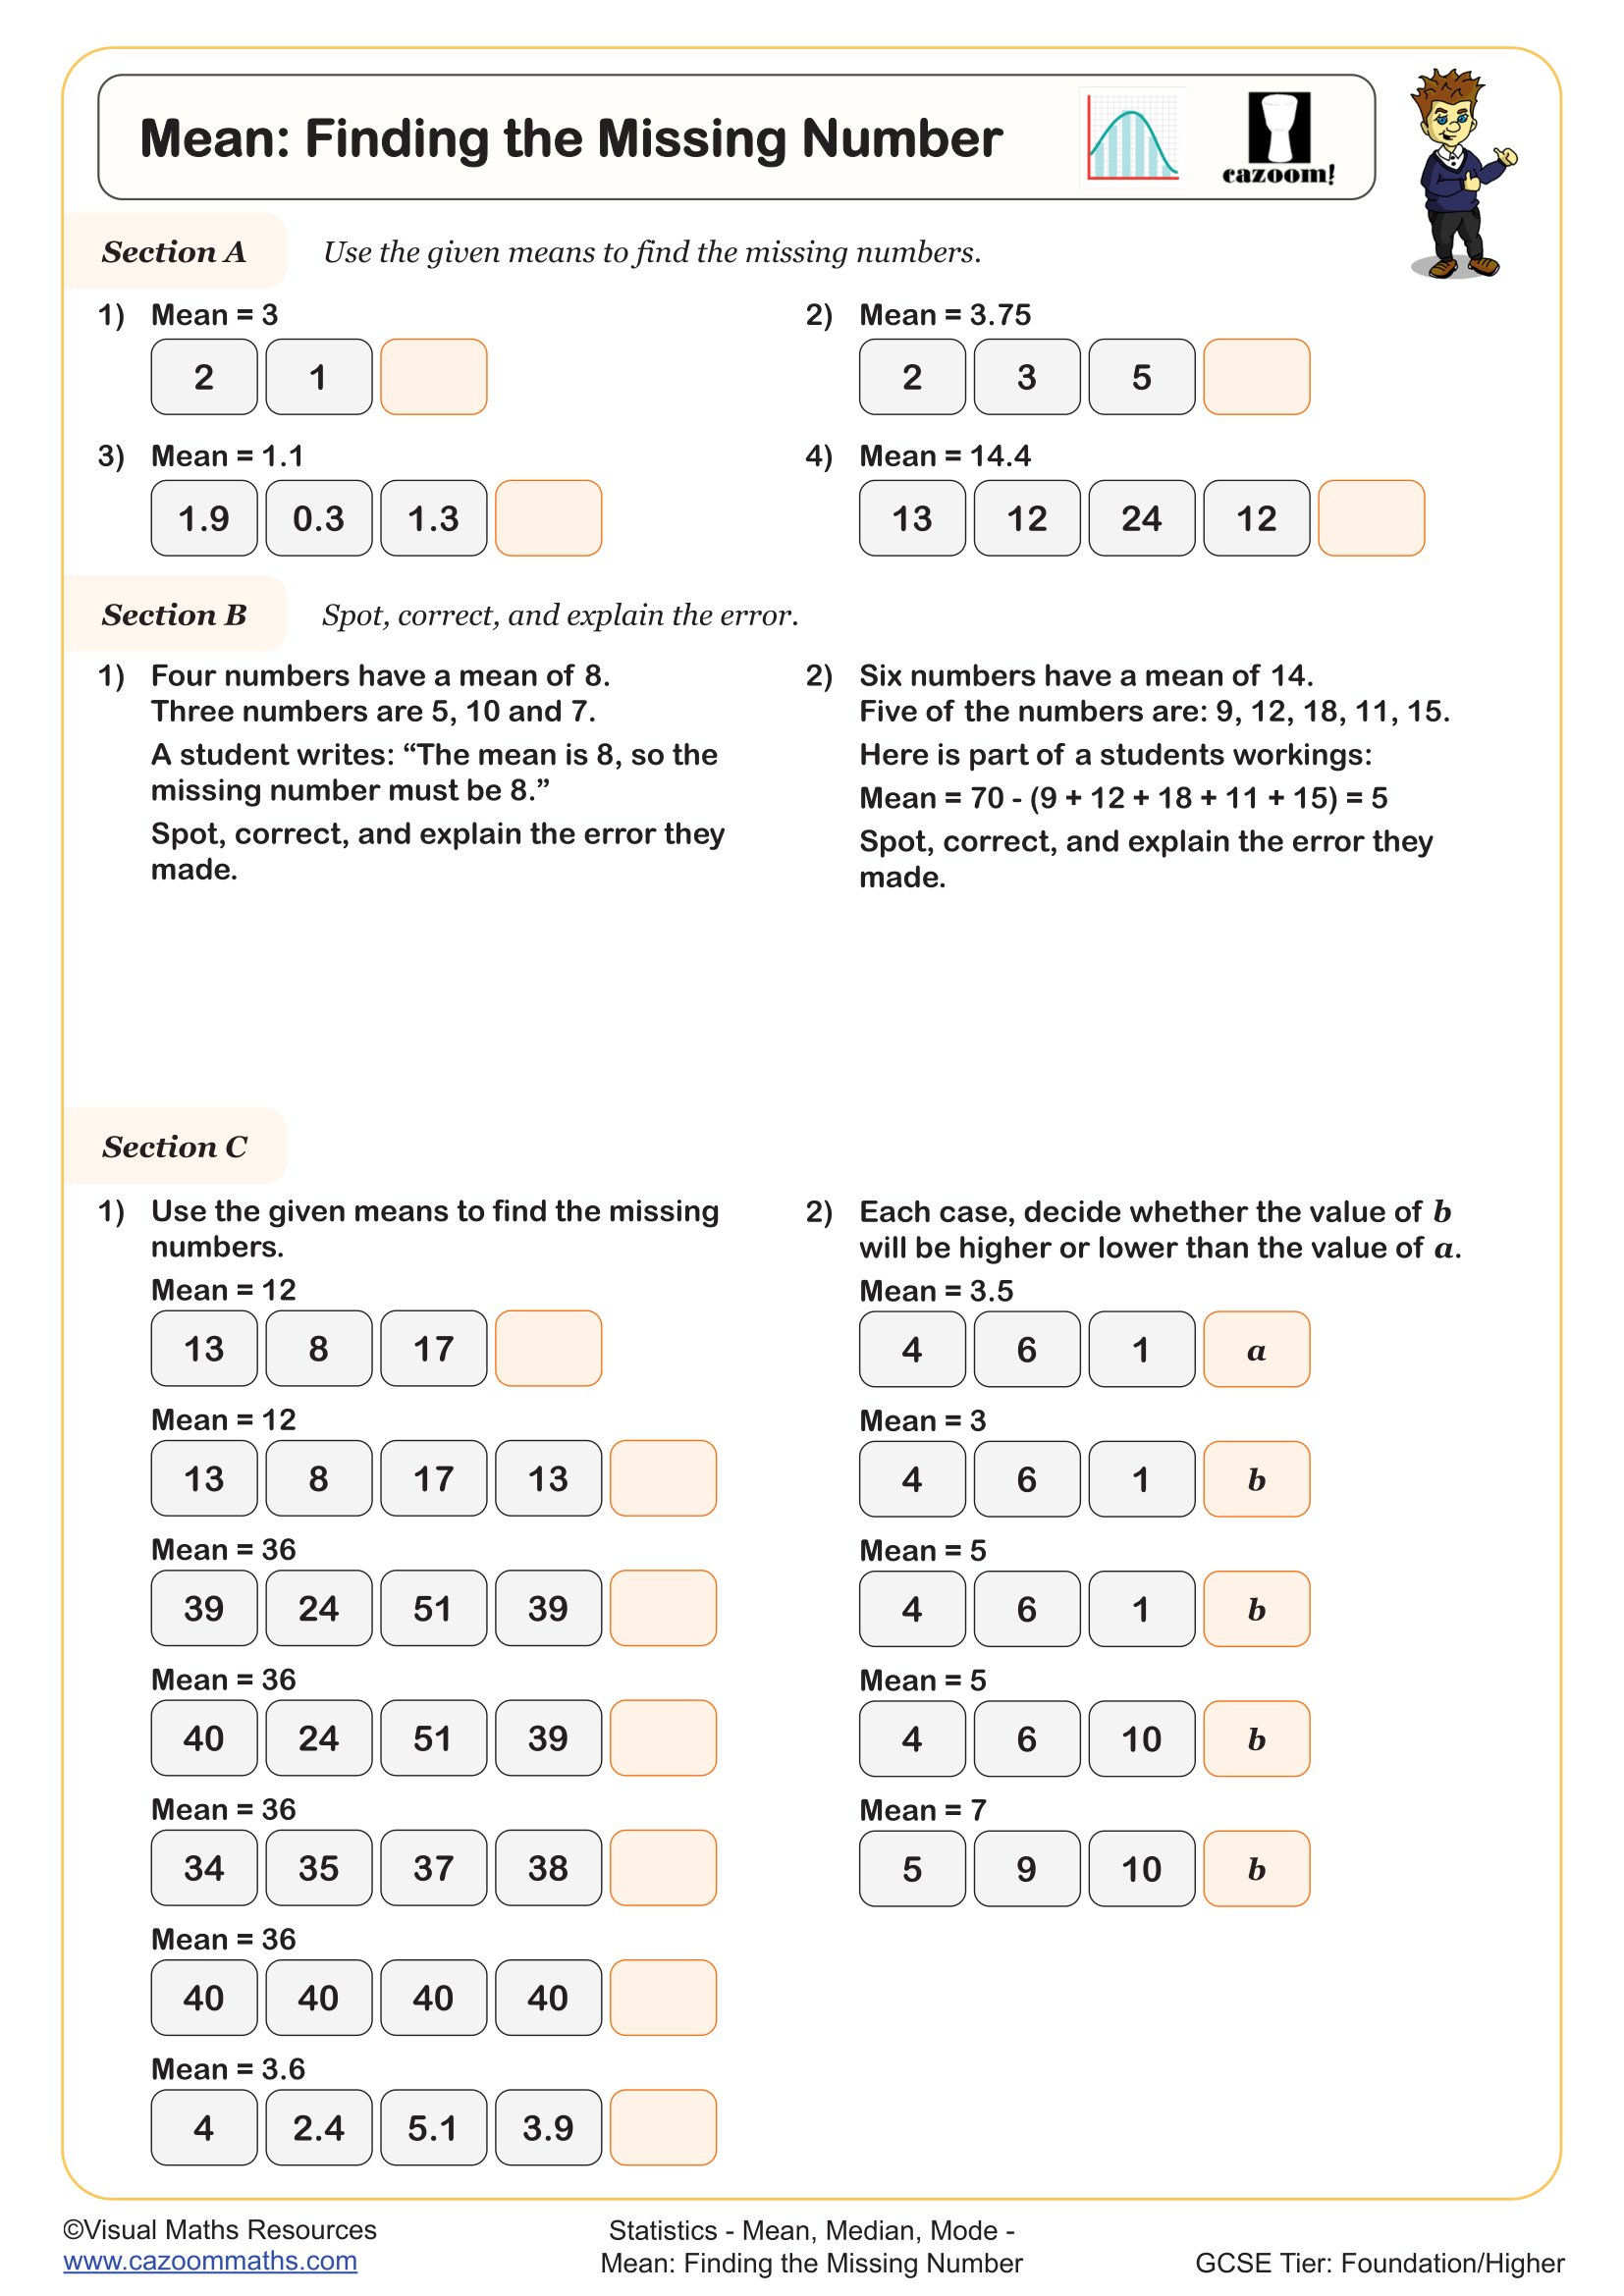
Mean: Finding the Missing Number
The Median

The Median and Range

The Mode and Range

All worksheets are created by the team of experienced teachers at Cazoom Maths.
What are mean, median, mode and range, and how are they taught at Year 8?
Mean, median, mode and range are the four measures of average and spread studied within the KS3 statistics strand of the National Curriculum. At Year 8, students are expected to calculate all four from raw data sets, understand what each measure tells them about the data, and begin to make simple comparisons between data sets using these values. The range measures spread rather than average, which is worth clarifying early.
A common error is treating the mode as the largest value rather than the most frequent one, particularly when students are working quickly. Another area where students lose marks is calculating the mean — dividing by the number of values they added rather than the total count of items in the data set. Drawing attention to these errors explicitly tends to prevent them from becoming ingrained habits.
Which year groups are these averages and range worksheets suitable for?
These worksheets are designed for Year 8 students working within Key Stage 3. Averages and range are typically introduced in Year 7, where students meet mean, median, mode and range for the first time using straightforward whole-number data sets. By Year 8, the expectation shifts towards applying these skills with larger data sets, decimal values and problem-solving contexts that require students to interpret, rather than just calculate.
The progression within these Year 8 materials reflects that shift. Earlier tasks focus on consolidating calculation methods, while later tasks ask students to compare two data sets or work backwards from a known mean to find a missing value. That final skill — finding a missing value given the mean — is where teachers frequently notice students need the most practise before it becomes secure.
How do students find the mean from a frequency table?
Finding the mean from a frequency table requires students to multiply each value by its frequency, sum those products, then divide by the total frequency rather than the number of rows. This is a step beyond calculating the mean from a list, and it trips up a significant number of Year 8 students who divide by the number of categories instead. A breakthrough typically happens when students recognise they are essentially reconstructing what the original data set would look like — the frequency column tells them how many times each value appears.
This skill has clear real-world relevance. Statisticians, scientists and engineers routinely work with summarised data presented in frequency tables rather than raw lists. In biology, for example, frequency tables are used to summarise results from fieldwork, making this a genuinely useful STEM context for students to encounter.
How can teachers use these worksheets effectively in the classroom?
The worksheets are structured to support teachers across different phases of a lesson or unit. Scaffolded tasks in the earlier sections allow students to build confidence with each measure individually before tackling questions that require them to select the appropriate average for a given context — a skill that GCSE mark schemes expect students to justify. The included answer sheets make self-marking or peer-marking straightforward, freeing up teacher time during practice phases.
In practice, many teachers use these resources flexibly: as consolidation homework after introducing averages in class, as targeted intervention for students who struggled in Year 7, or as paired revision tasks where students take turns explaining their reasoning. The PDF format means they print cleanly and can also be used digitally for students working remotely or in a one-to-one setting.