Year 8 Histograms and Frequency Polygons Worksheets
All worksheets are created by the team of experienced teachers at Cazoom Maths.
The Hidden Benefits of Our Printable Year 8 Frequency Polygons and Histograms Worksheets
Your secondary school students must develop proportional thinking about data representation when they transition from basic bar charts to frequency density calculations. These worksheets teach students to choose suitable graphs and comprehend how area measurements represent frequency in histograms instead of height. Students learn to identify patterns in grouped data while making significant comparisons between distribution patterns. Students learn essential mathematical concepts about intervals and boundaries when they transition from working with discrete to continuous variables. Students who practice creating and interpreting these graphs develop analytical reasoning skills which become necessary for advanced statistics.
Specific learning benefits include:
• Learn grouped data organisation techniques
• Develops frequency density calculation skills
• Strengthens distribution comparison abilities
• Improves scale selection and axis labelling
• Connects area concepts with data representation
• Builds interpolation and estimation skills
• Enhances critical evaluation of statistical claims
Year 8 Statistics Concepts: Histograms and Frequency Polygons Explained
These worksheets present a structured approach to teaching students the technical methods of creating precise statistical graphs. The educational sequence starts with frequency tables for ungrouped data before moving to the process of selecting appropriate class intervals for continuous variables. The materials provide explicit instruction about frequency density calculations to explain why unequal class widths need this adjustment. The instruction for polygon construction includes activities that teach students how to accurately plot midpoints and join coordinates. The worksheets contain complete mark schemes which present calculation procedures in a step-by-step format.
The core skills covered include:
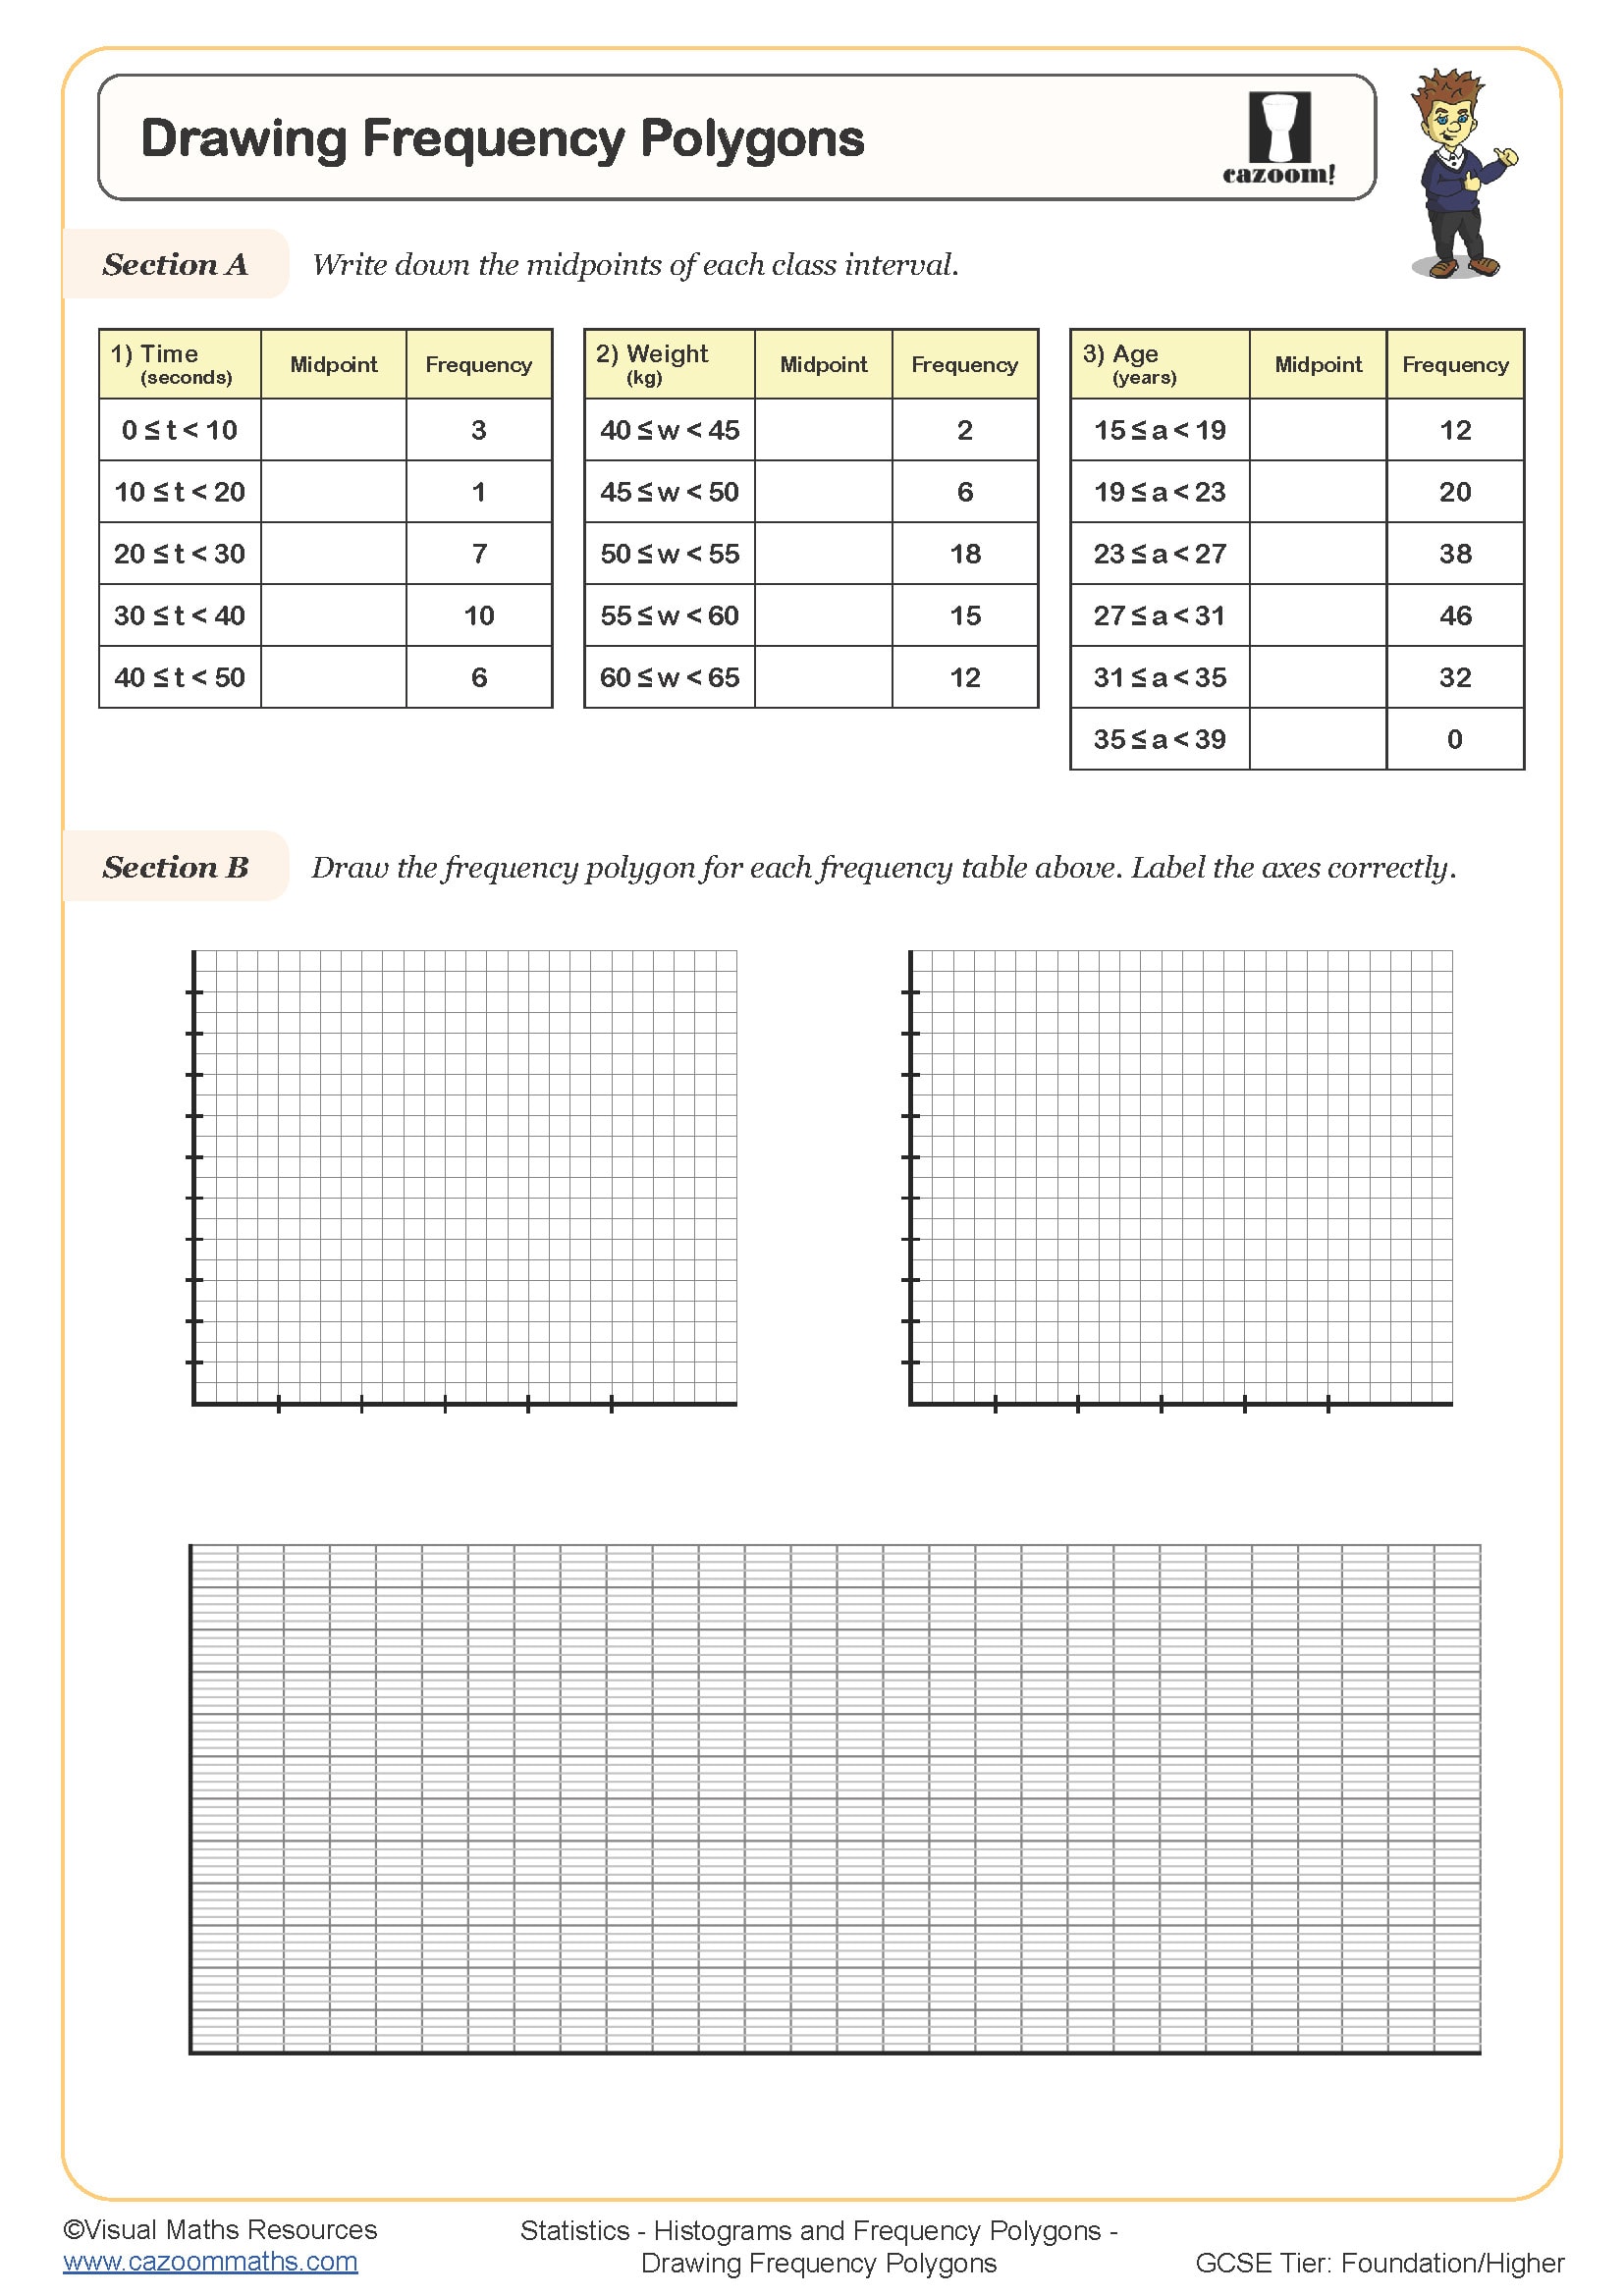
• Drawing Frequency Polygons
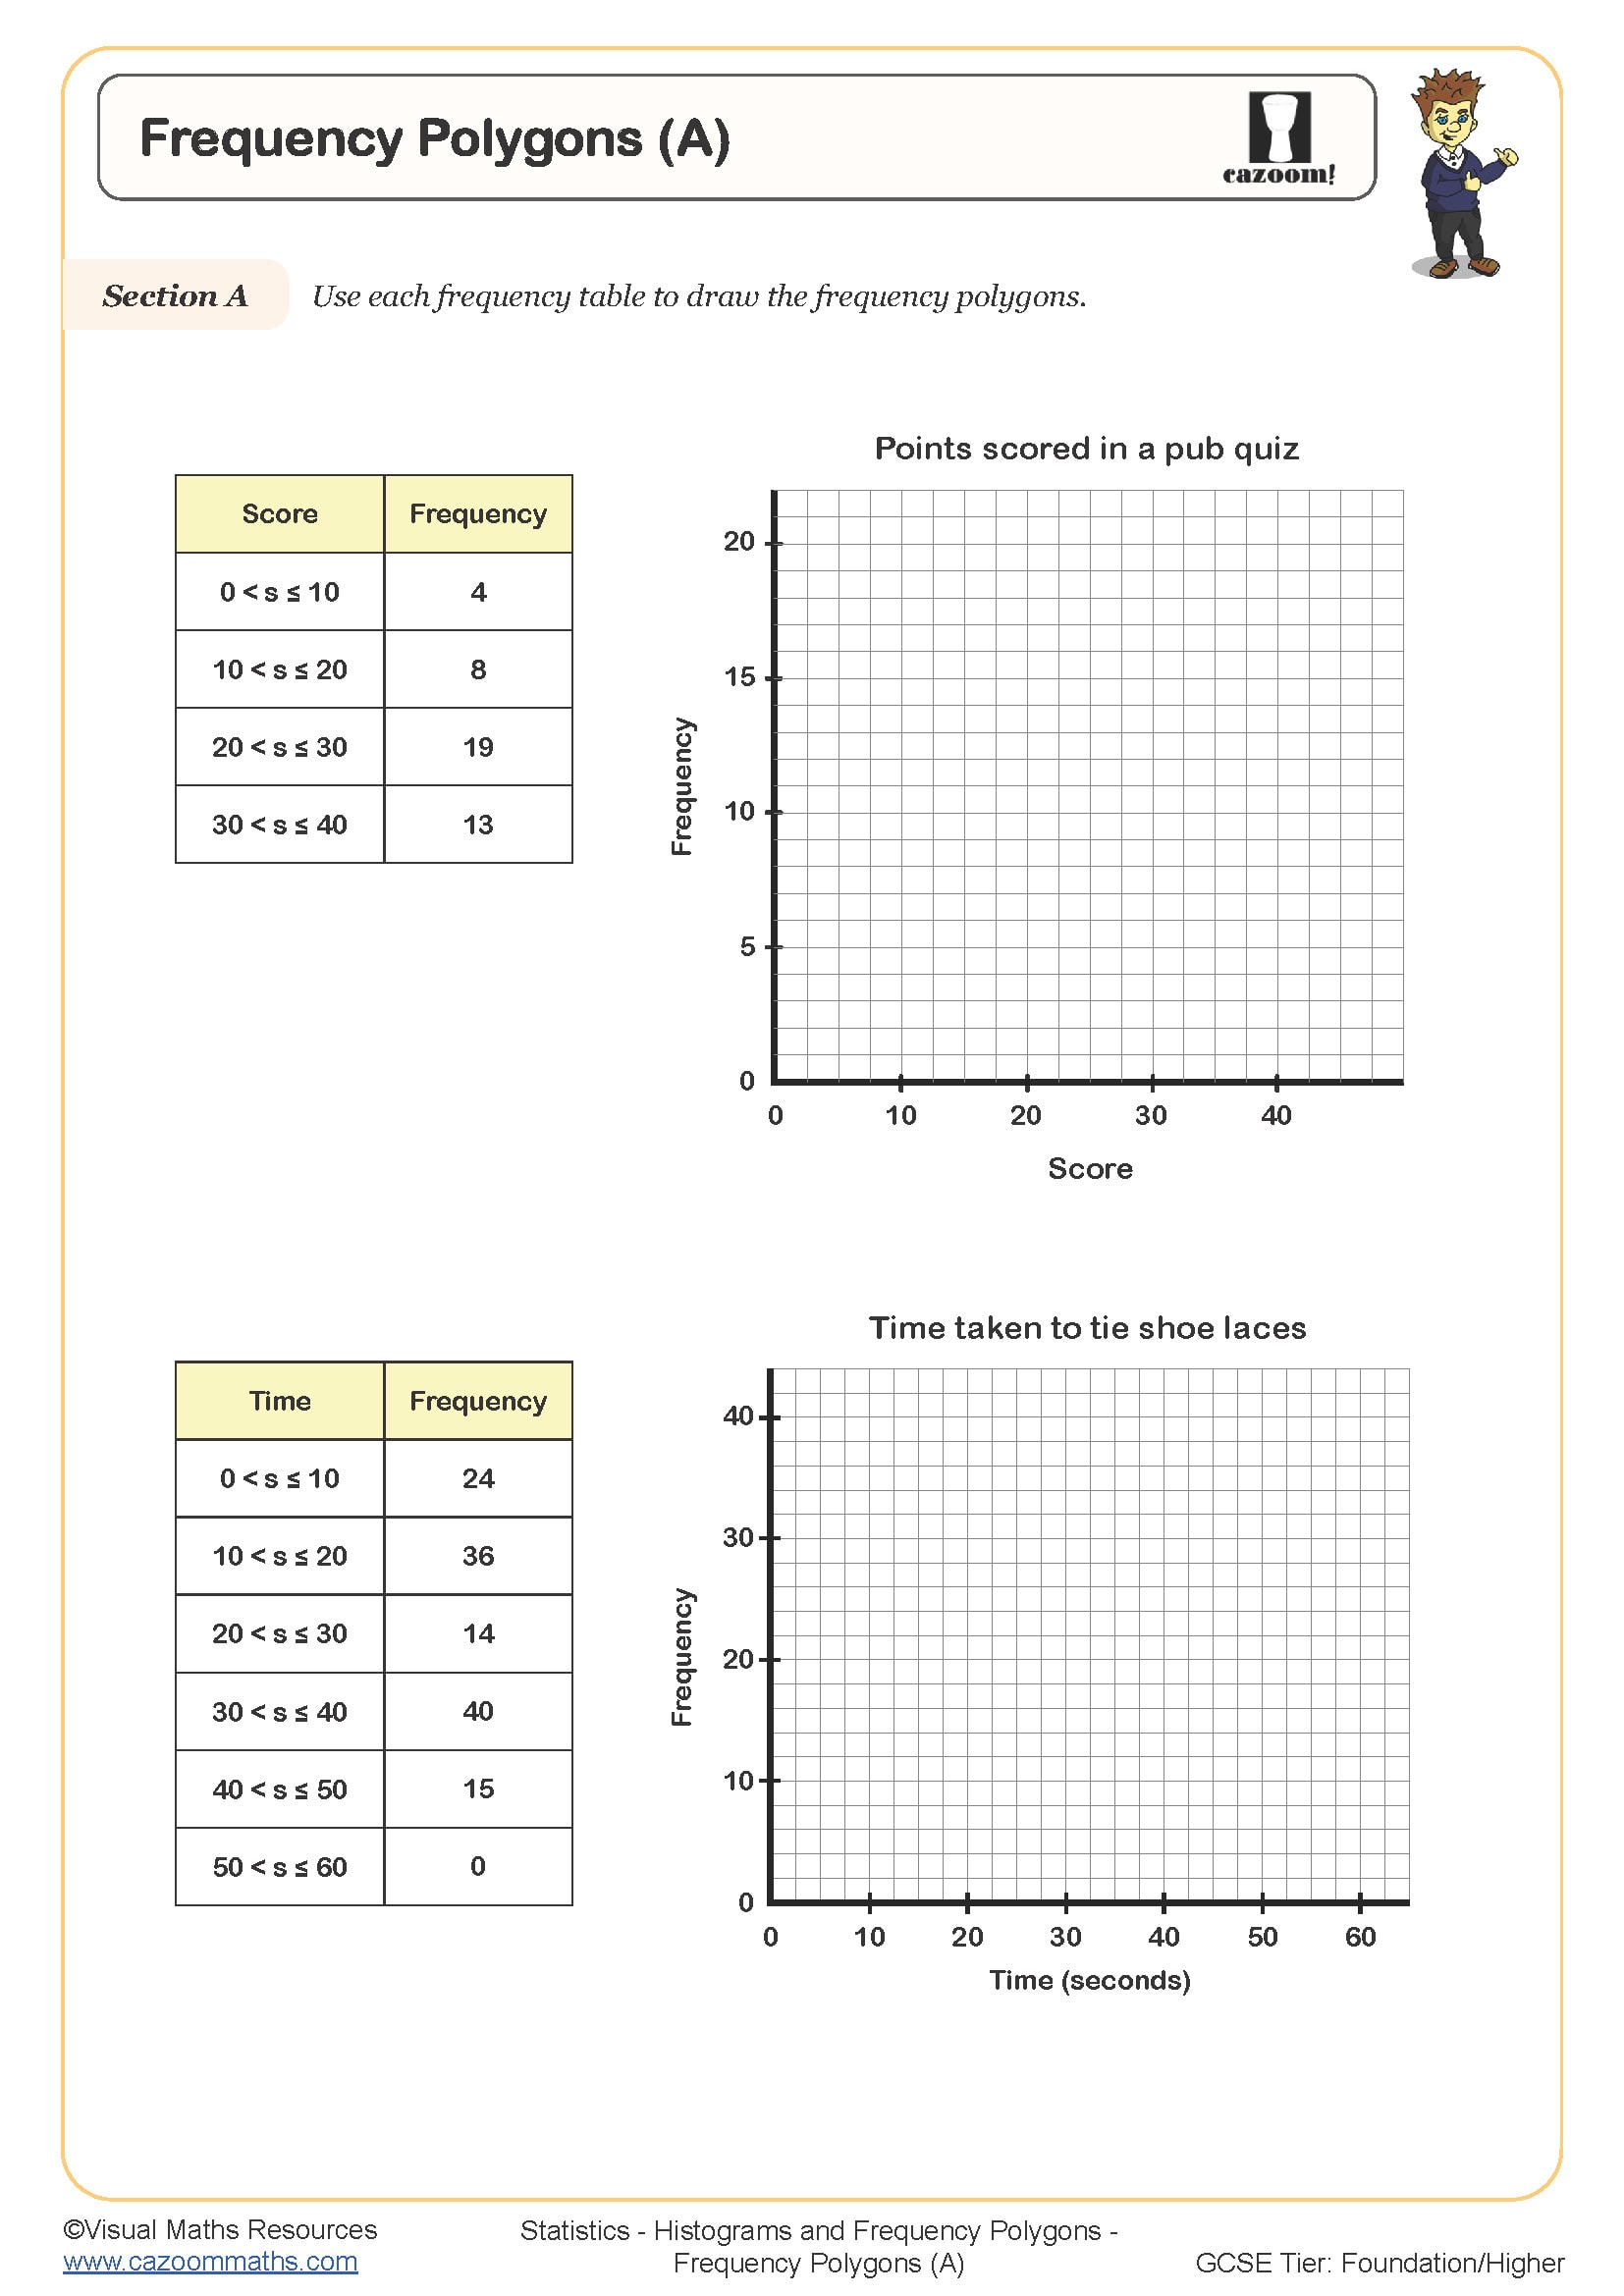
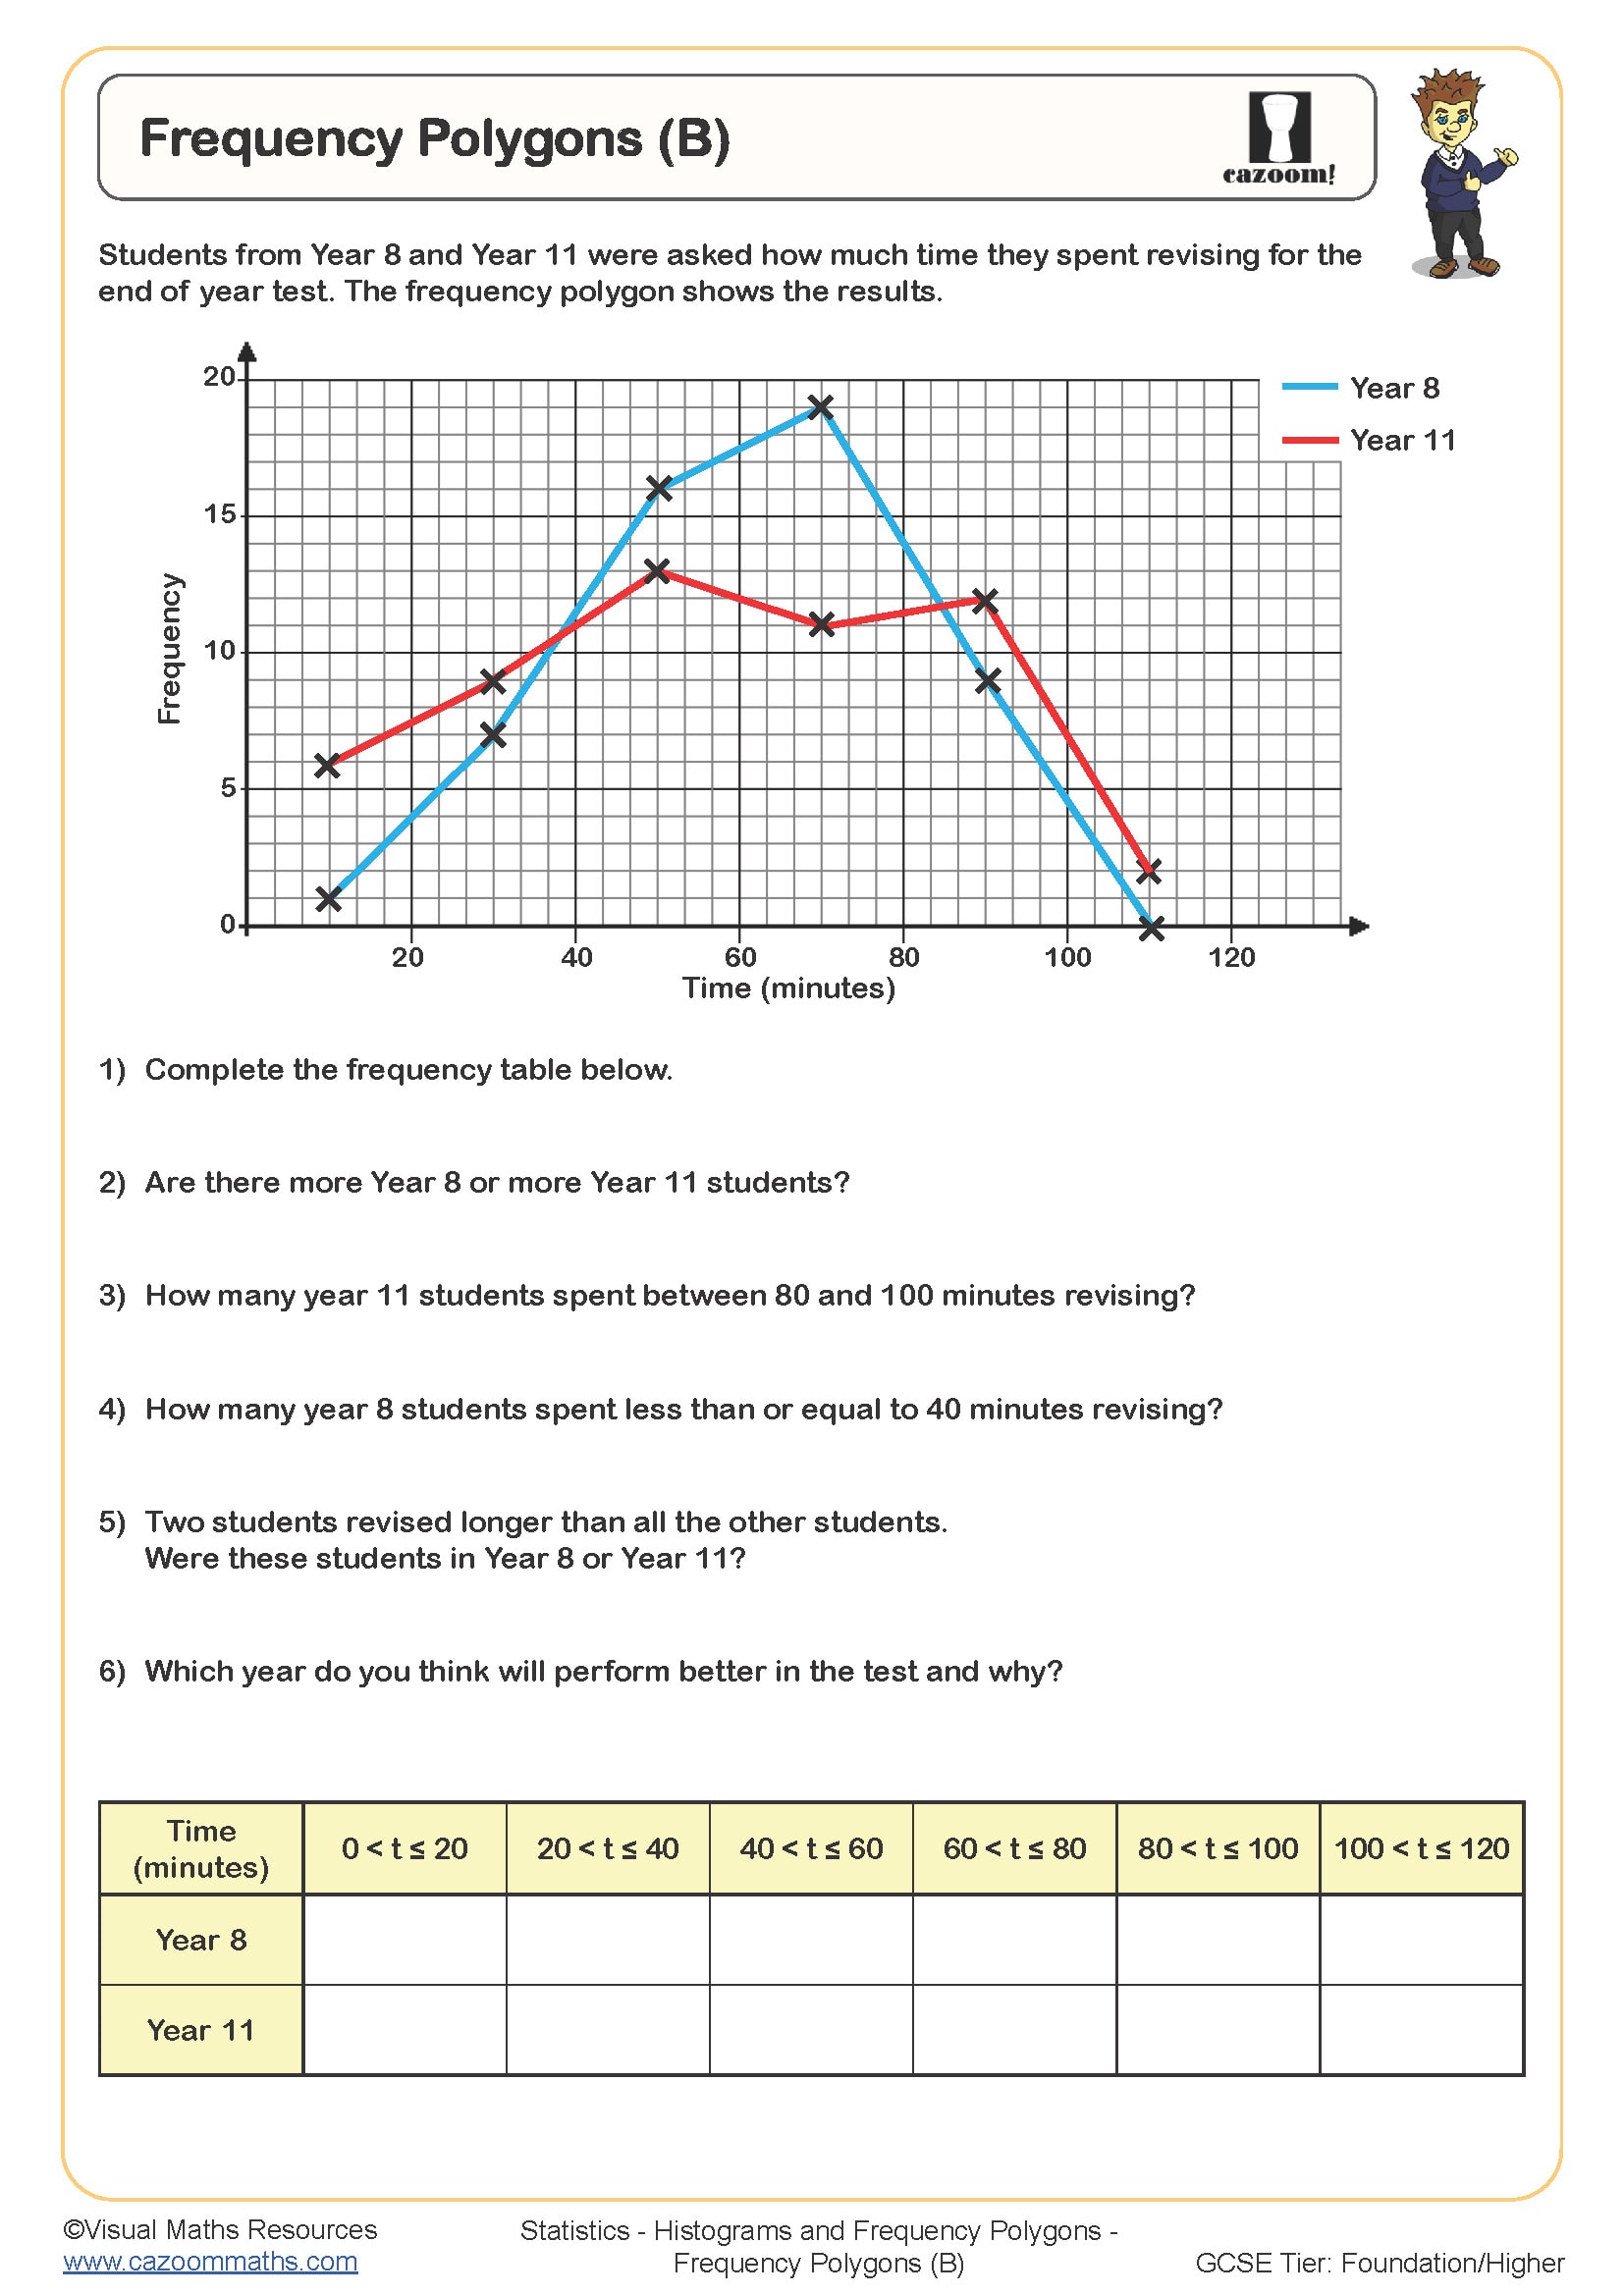
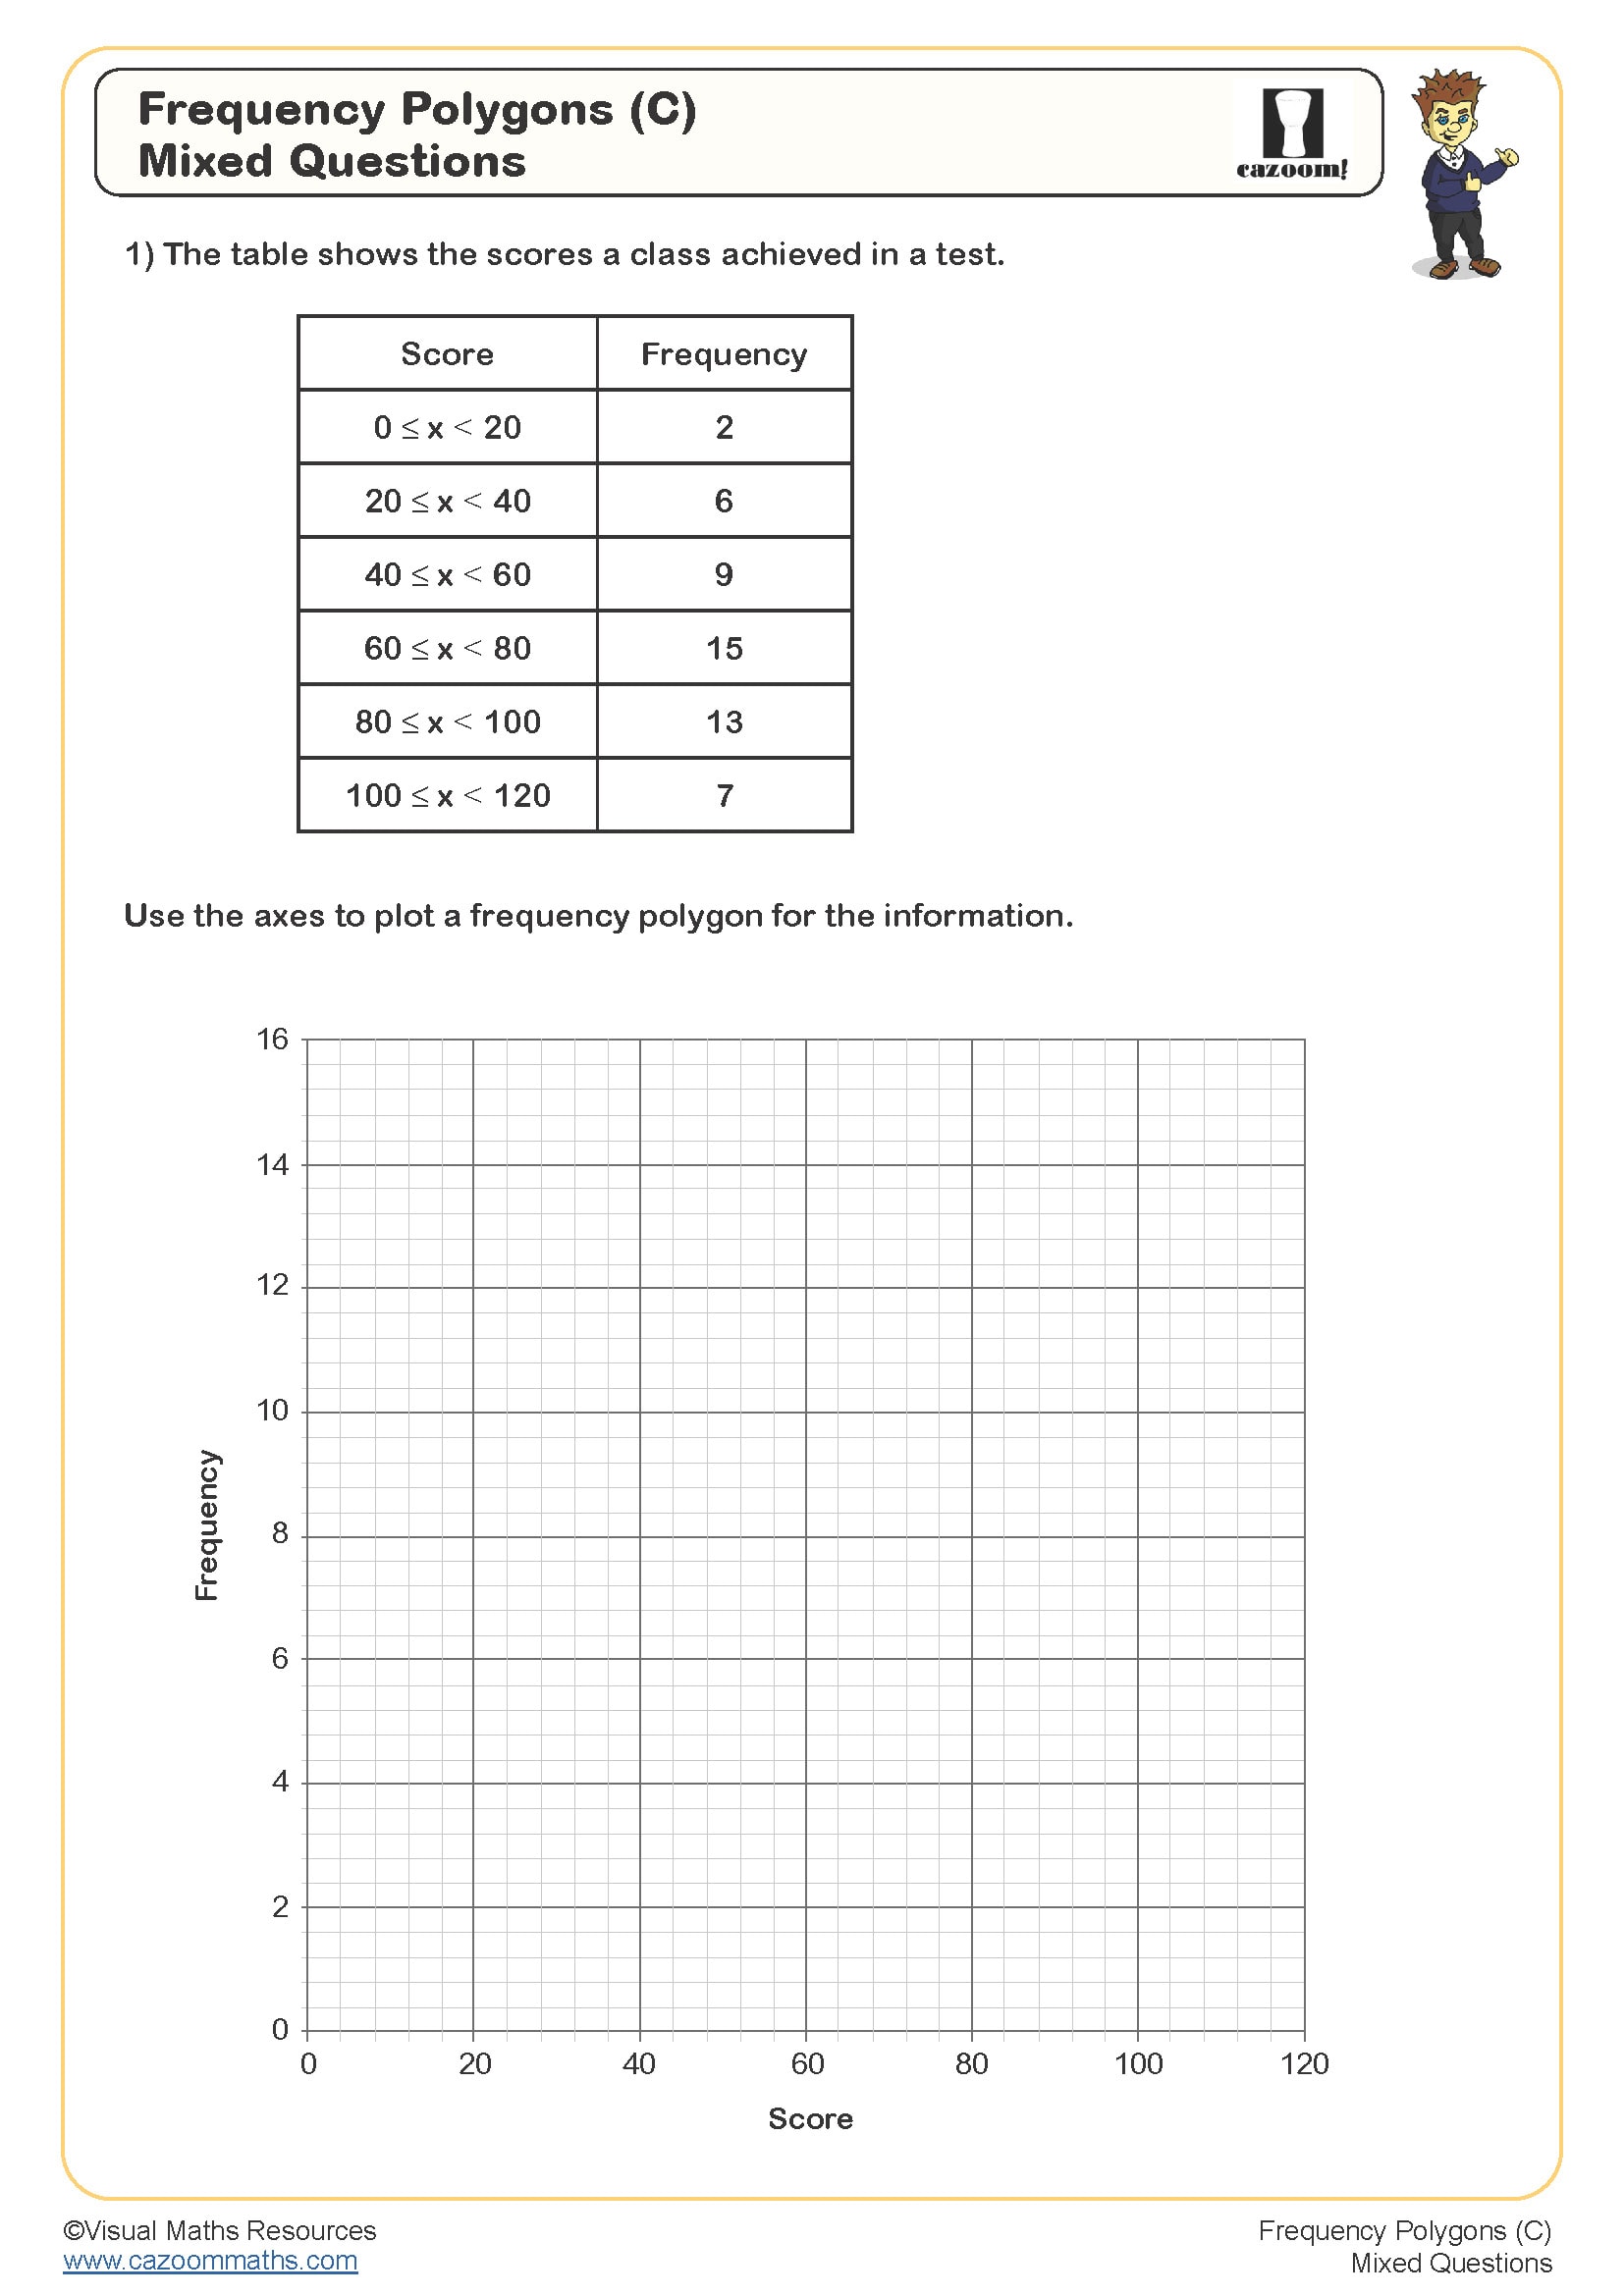
• Different Concepts of Frequency Polygons
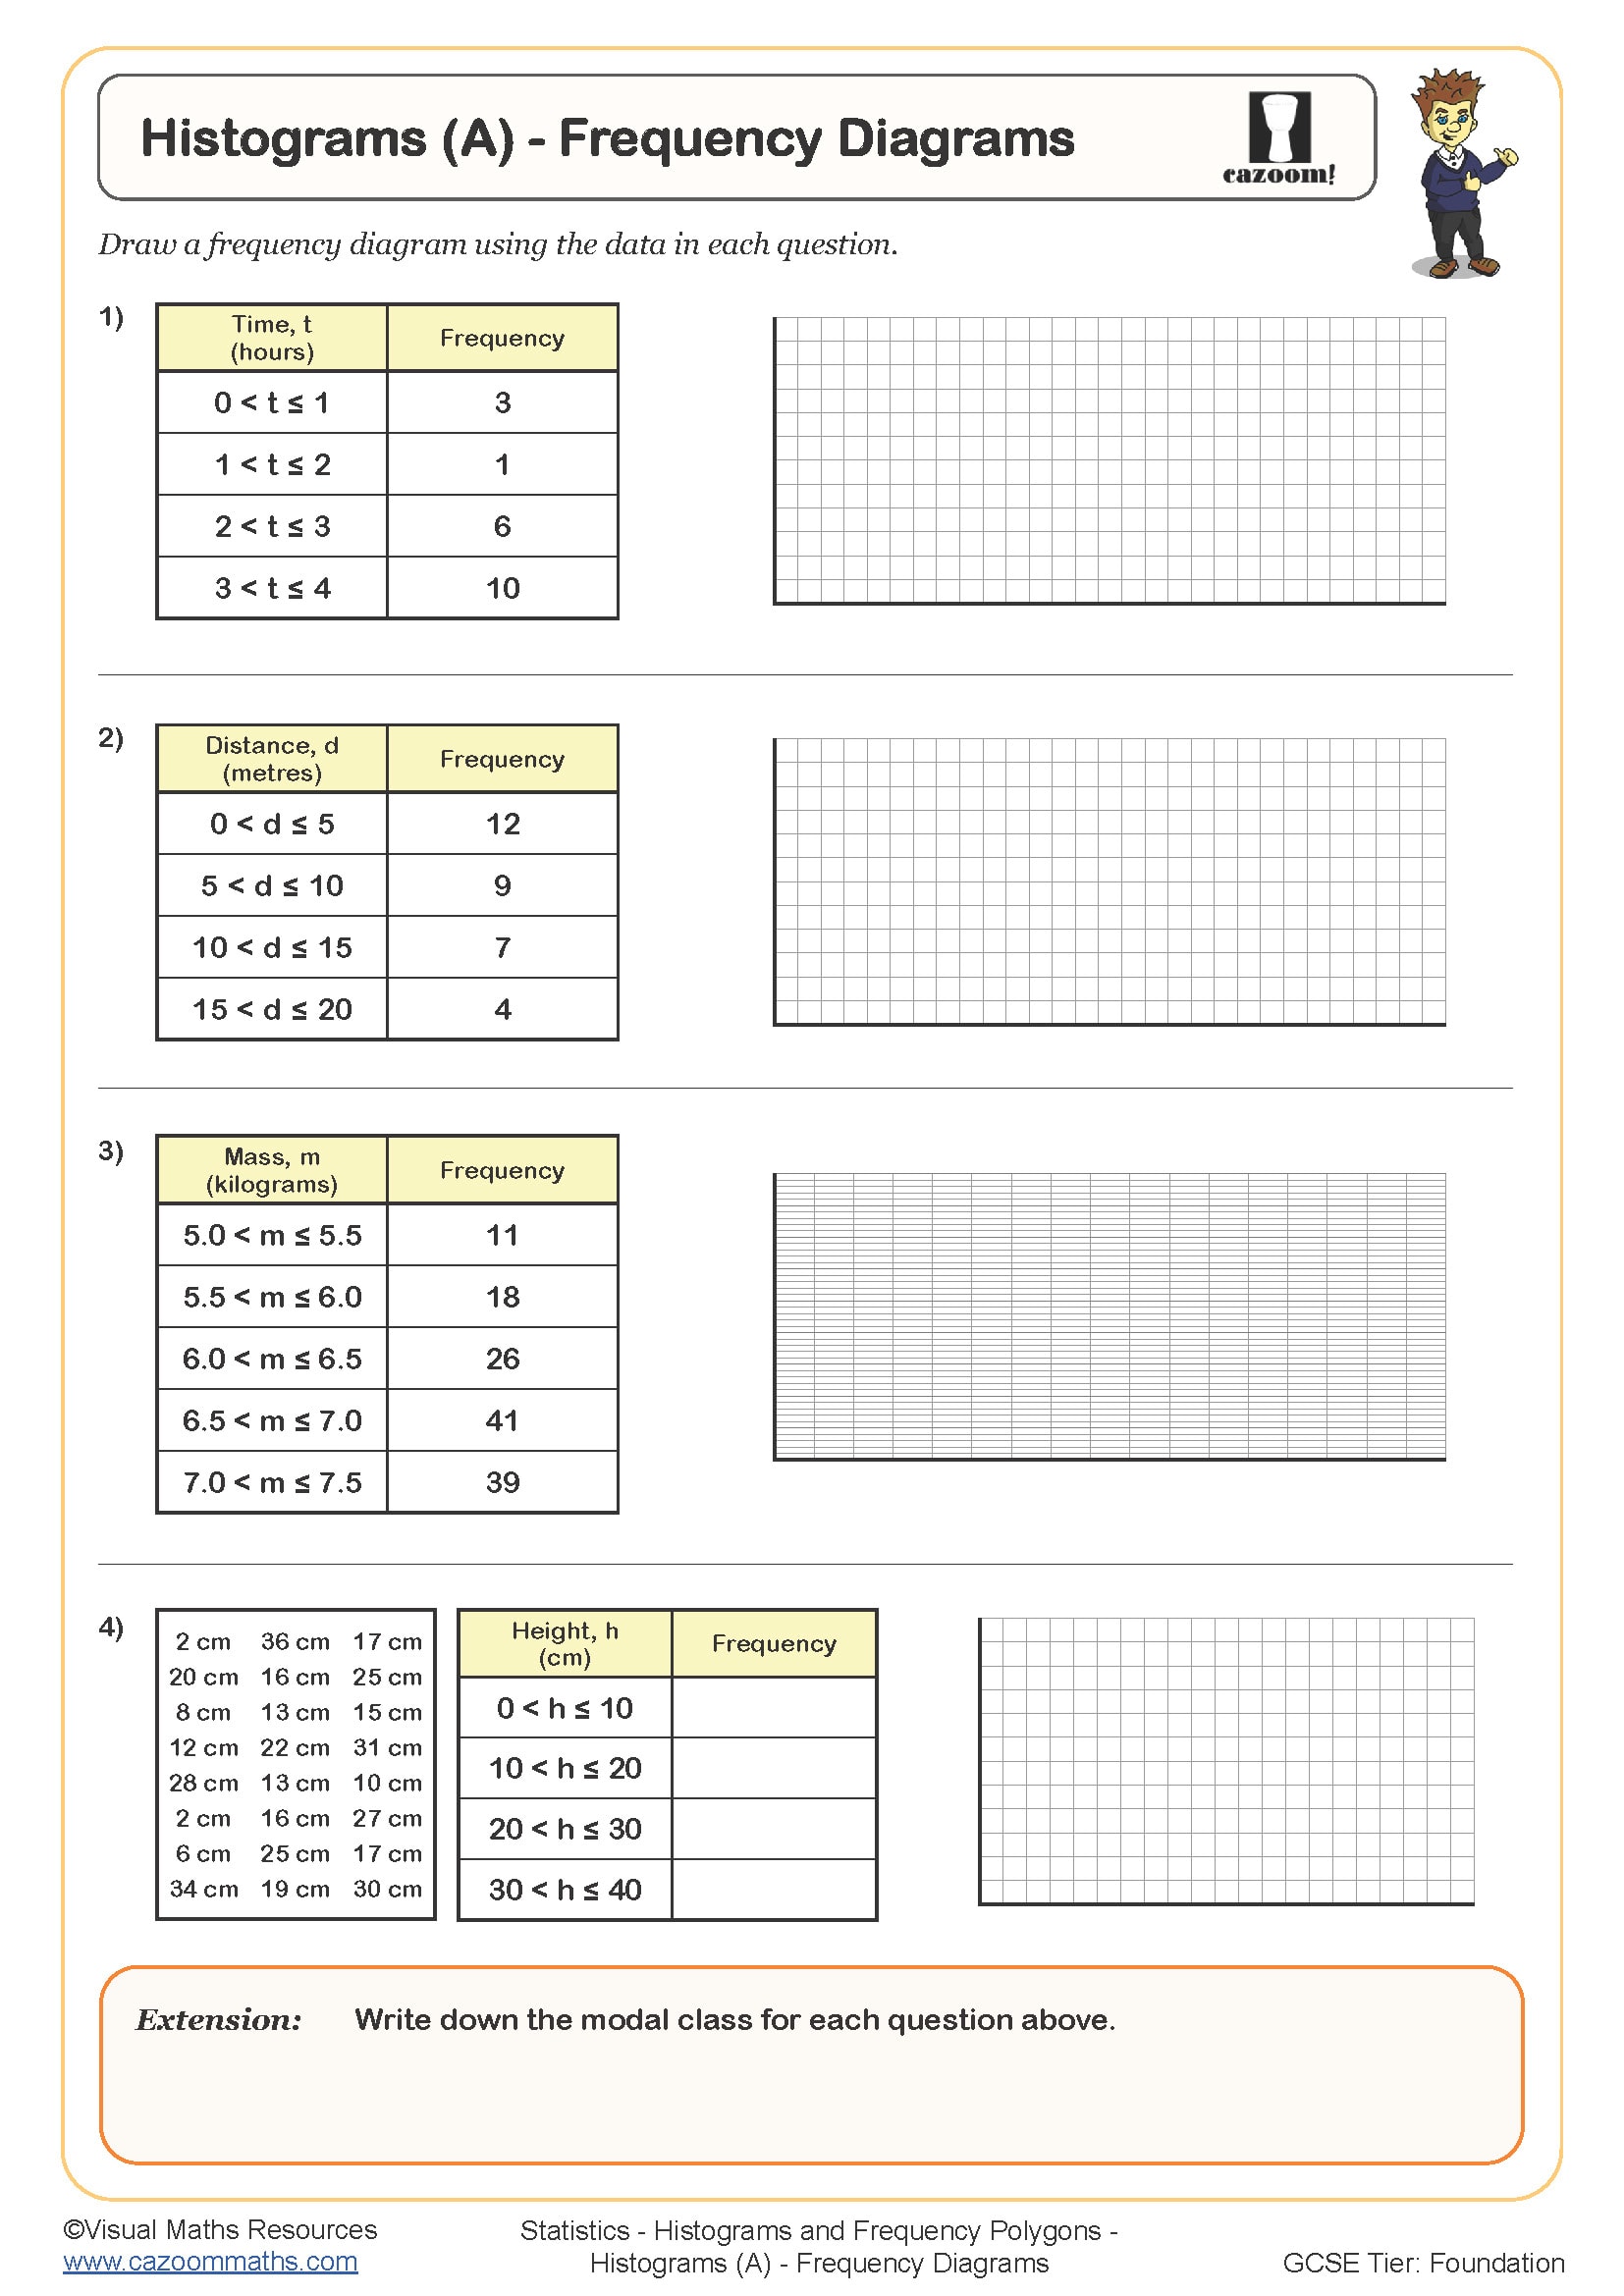
• Histograms (A) - Frequency Diagrams
Improve Test Confidence With KS3 Histograms and Frequency Polygons Worksheets
The worksheets find favour with mathematics departments because they present ready-to-use materials with clear pathways for differentiation. The three-tier difficulty structure enables teachers to instruct students of different abilities simultaneously through extension questions for advanced learners and foundation tasks for learners who need review. The answer keys contain both common student errors and grading instructions, which shortens the preparation process. The uniform design structure creates efficient learning practices, but the multiple subject examples prevent student boredom during multiple class sessions. The teaching staff values the emphasis on mathematical communication because questions demand both written explanations and numerical solutions.
Applying Histogram and Frequency Polygon Skills Beyond the Classroom
Statistical graphs communicate complex information efficiently, making these skills valuable across numerous fields and everyday situations.
Real-world applications include:
• Scientific experiments – recording continuous measurements like reaction times
• Sports analysis – comparing player performance distributions across teams
• Weather patterns – interpreting rainfall data and temperature variations
• Market research – analysing consumer spending habits and age demographics
• Medical studies – understanding patient recovery times and dosage effects
• Environmental monitoring – tracking pollution levels and wildlife populations
• Social media analytics – examining user engagement patterns throughout the day
• Quality control – monitoring manufacturing consistency and product specifications