Year 8 Mean Median Mode Worksheets
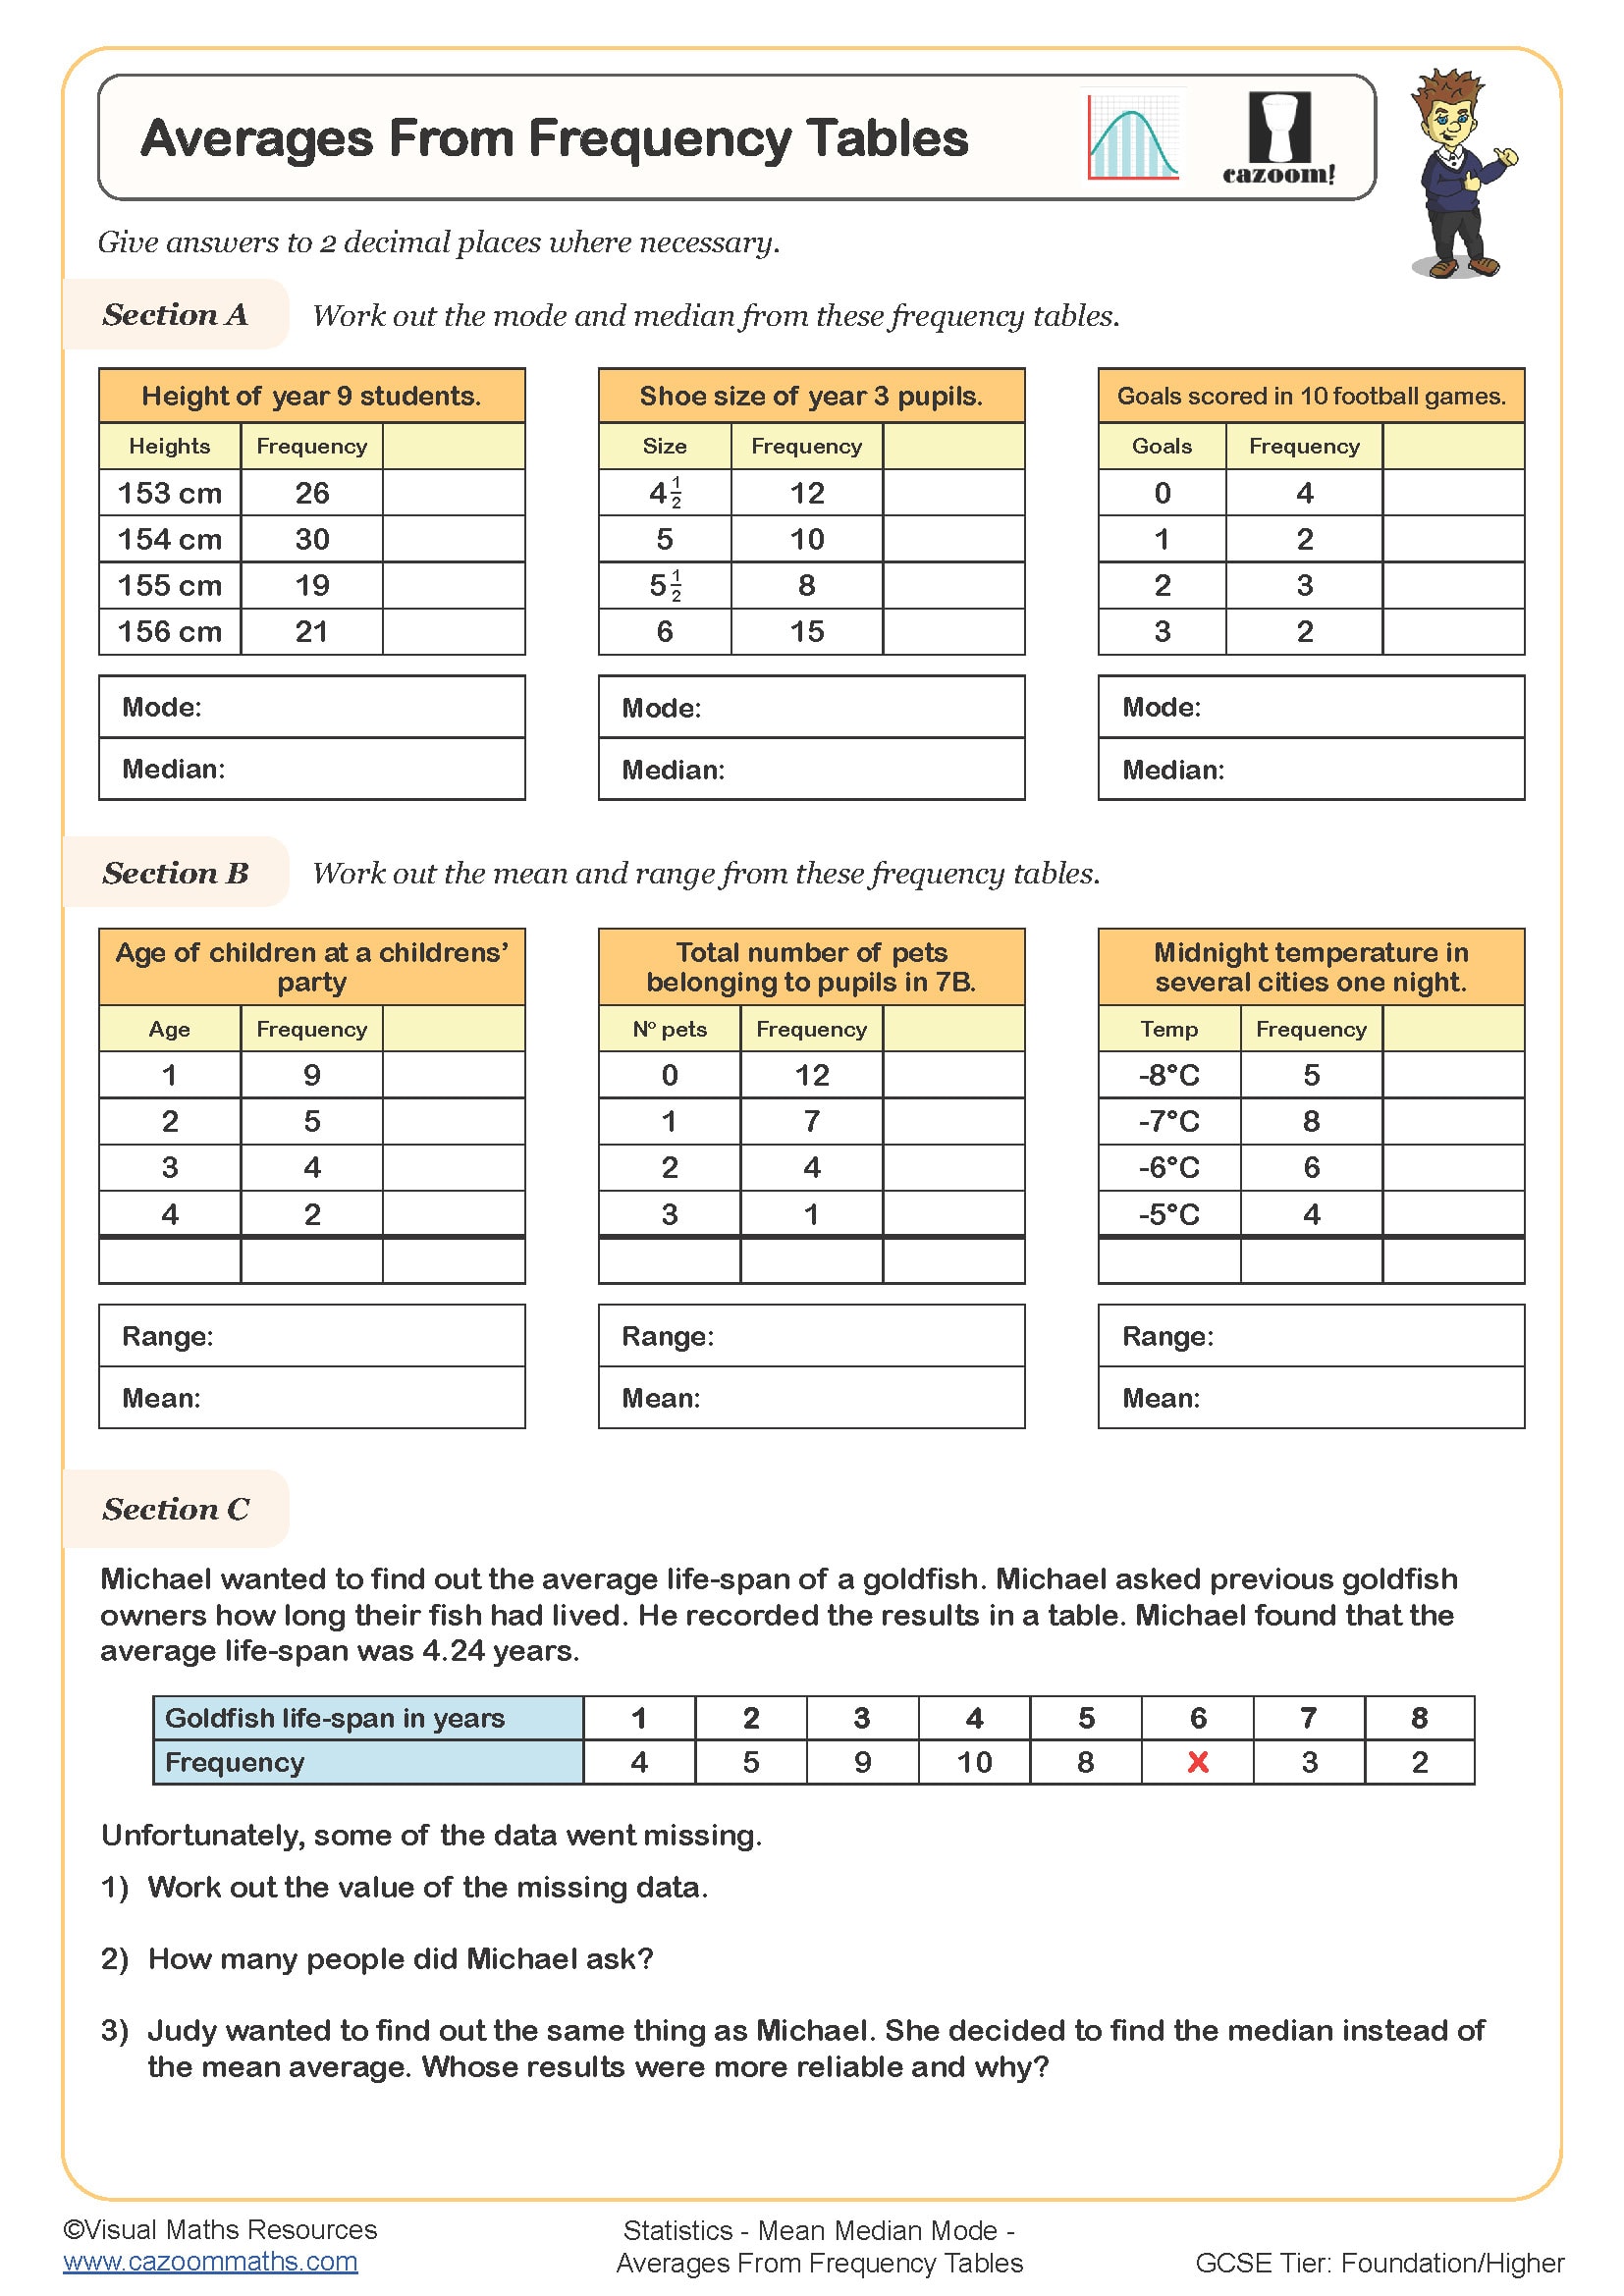
Averages from Frequency Tables
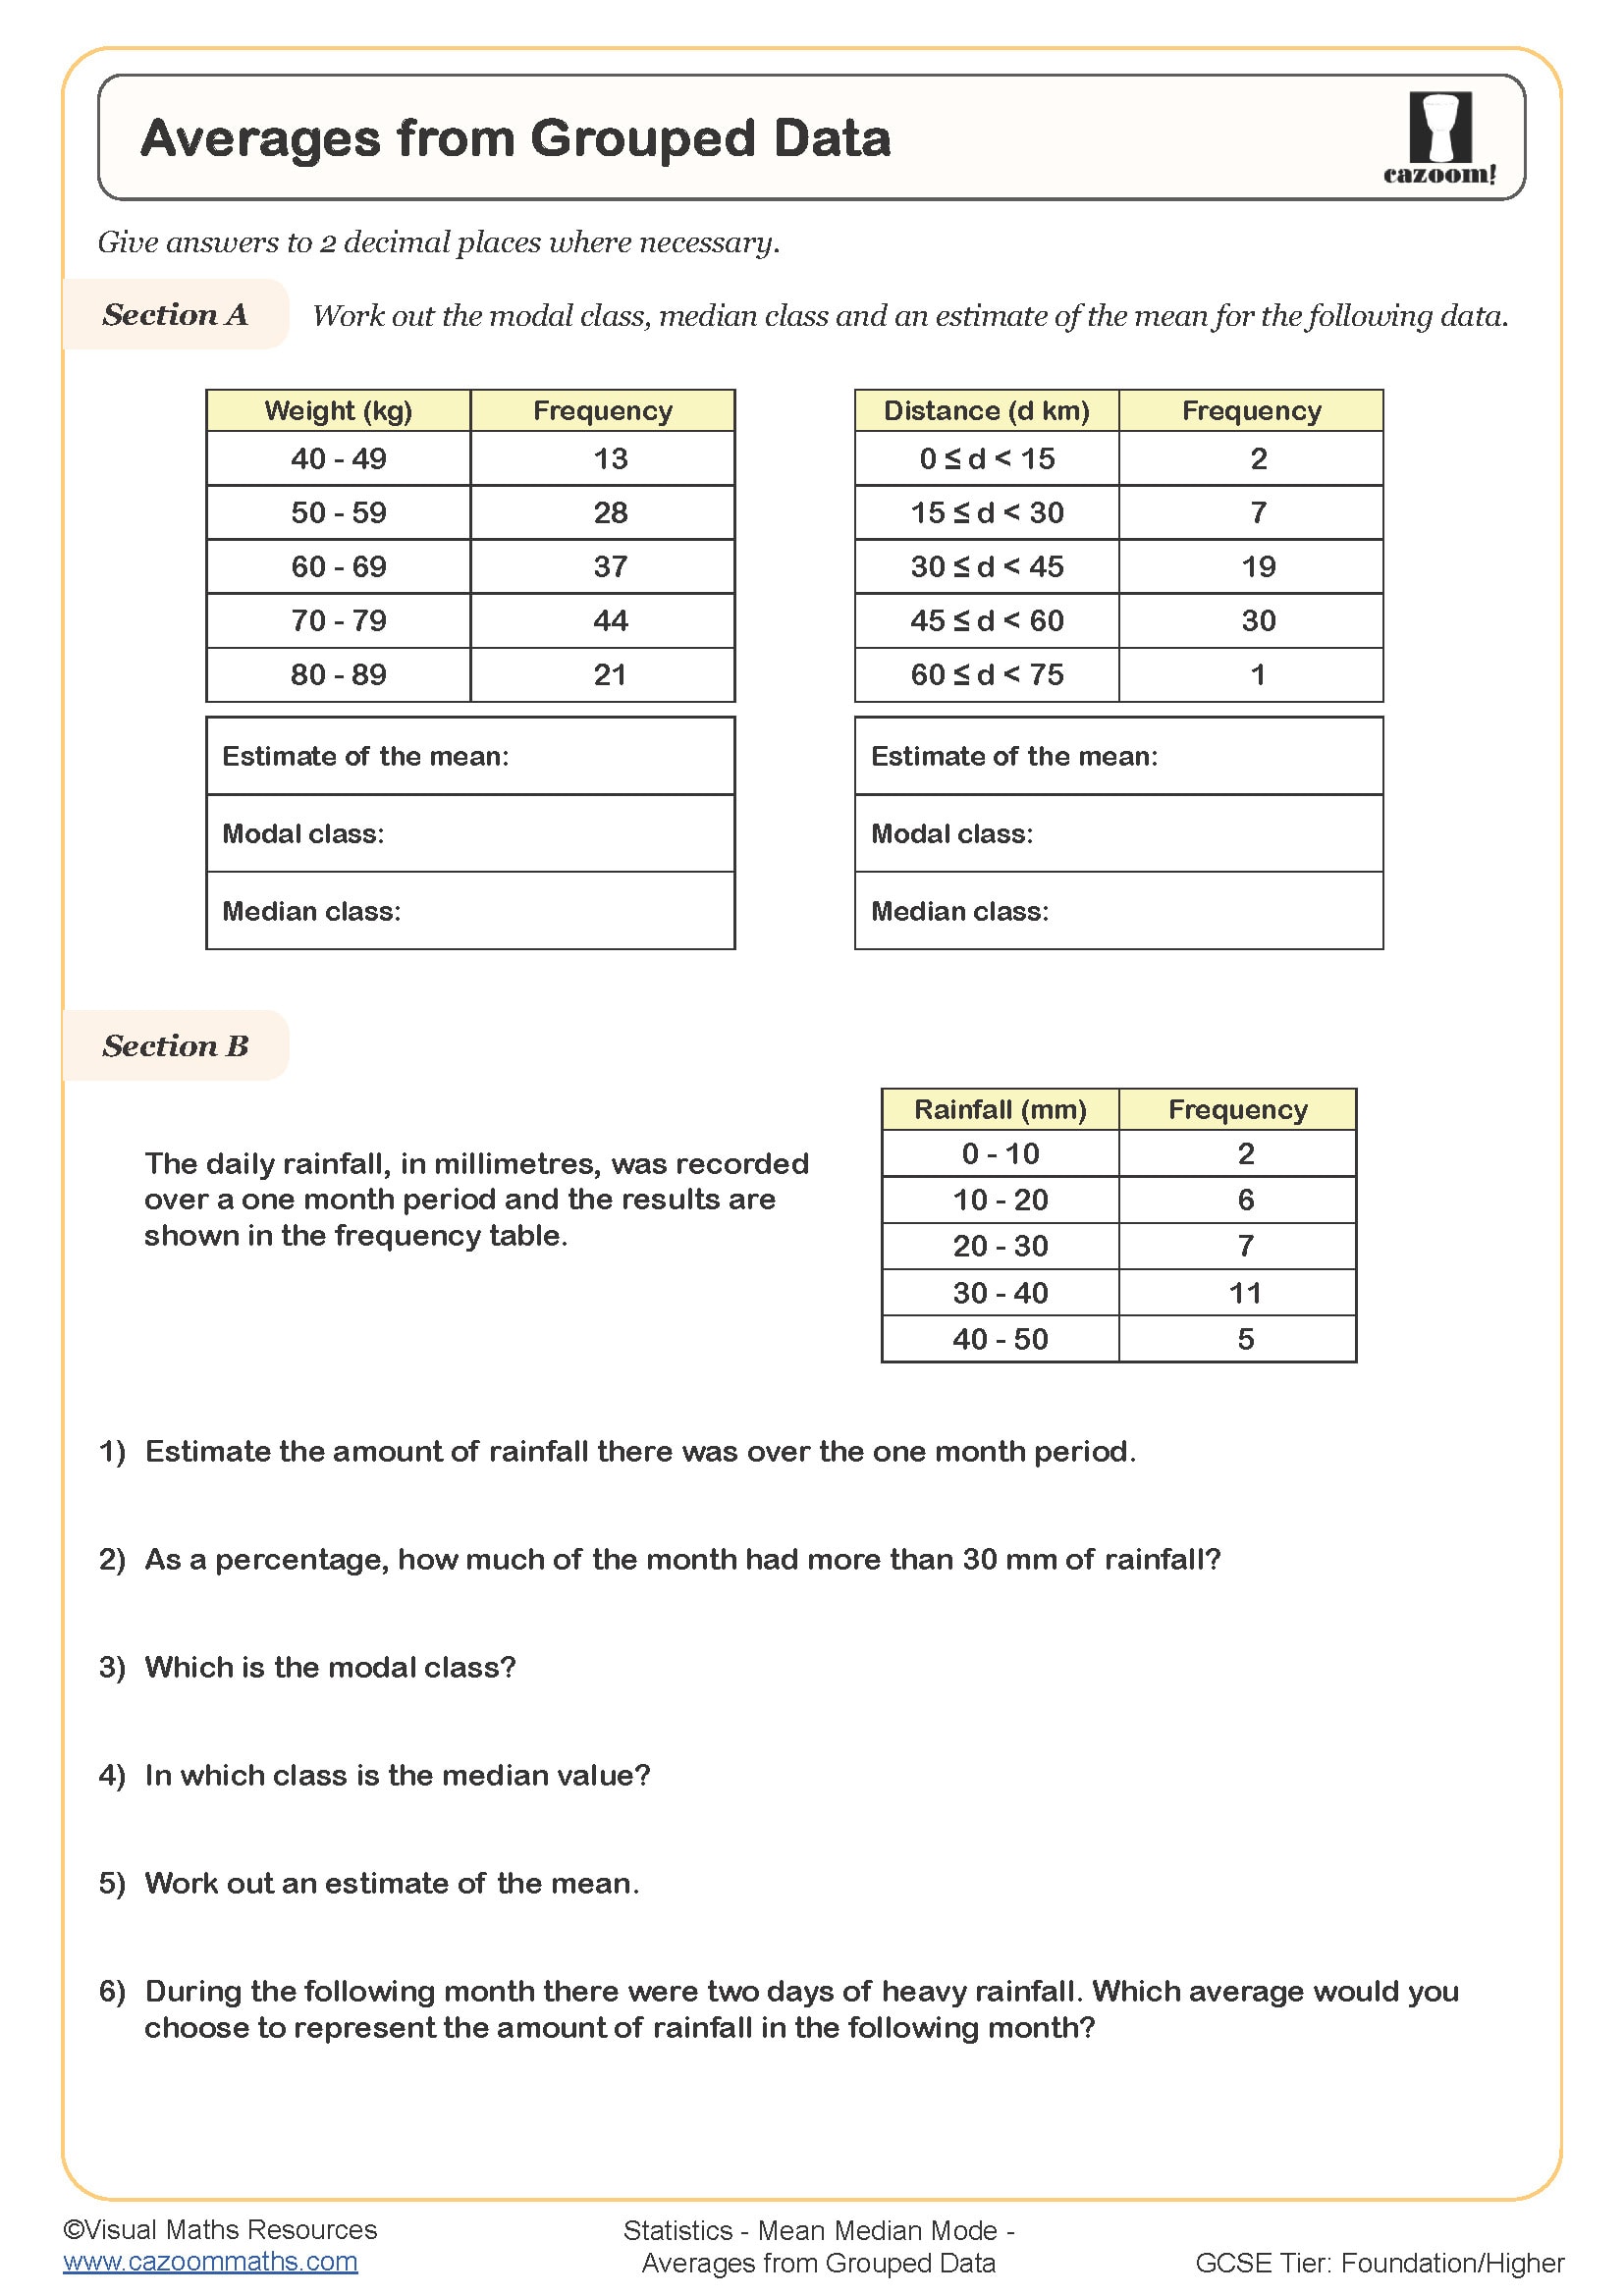
Averages from Grouped Data
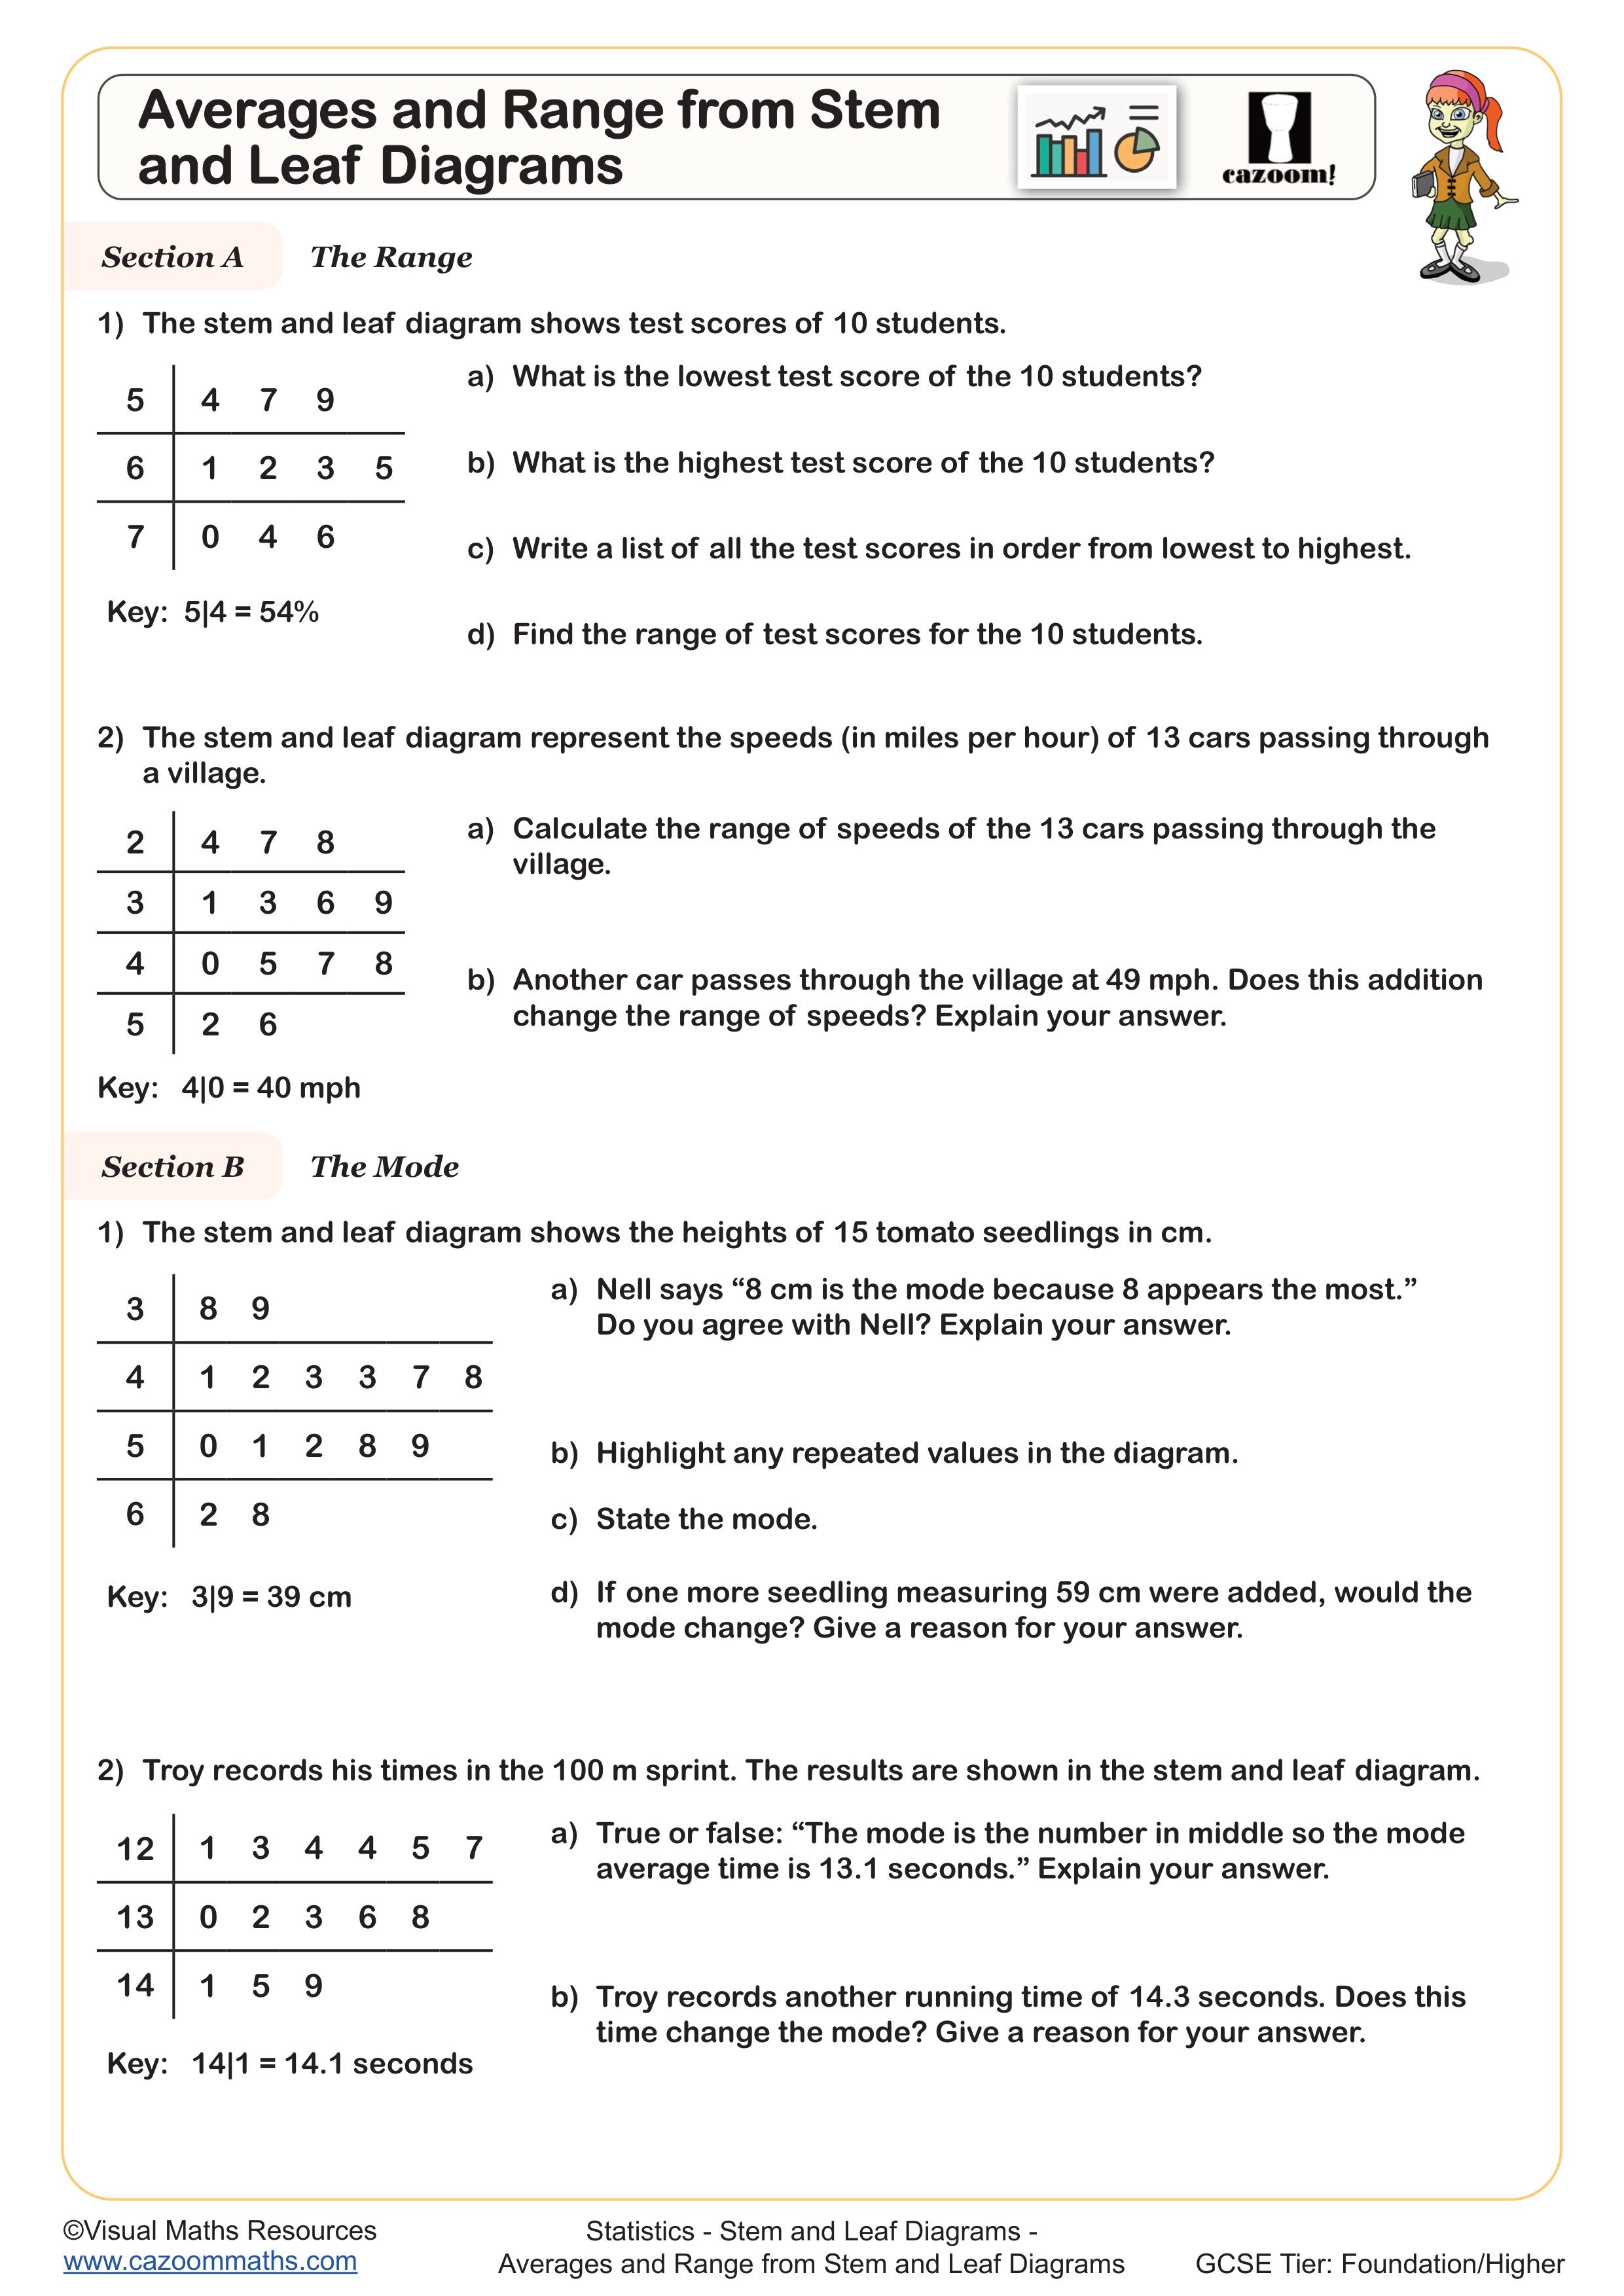
Averages from Stem and Leaf Diagrams
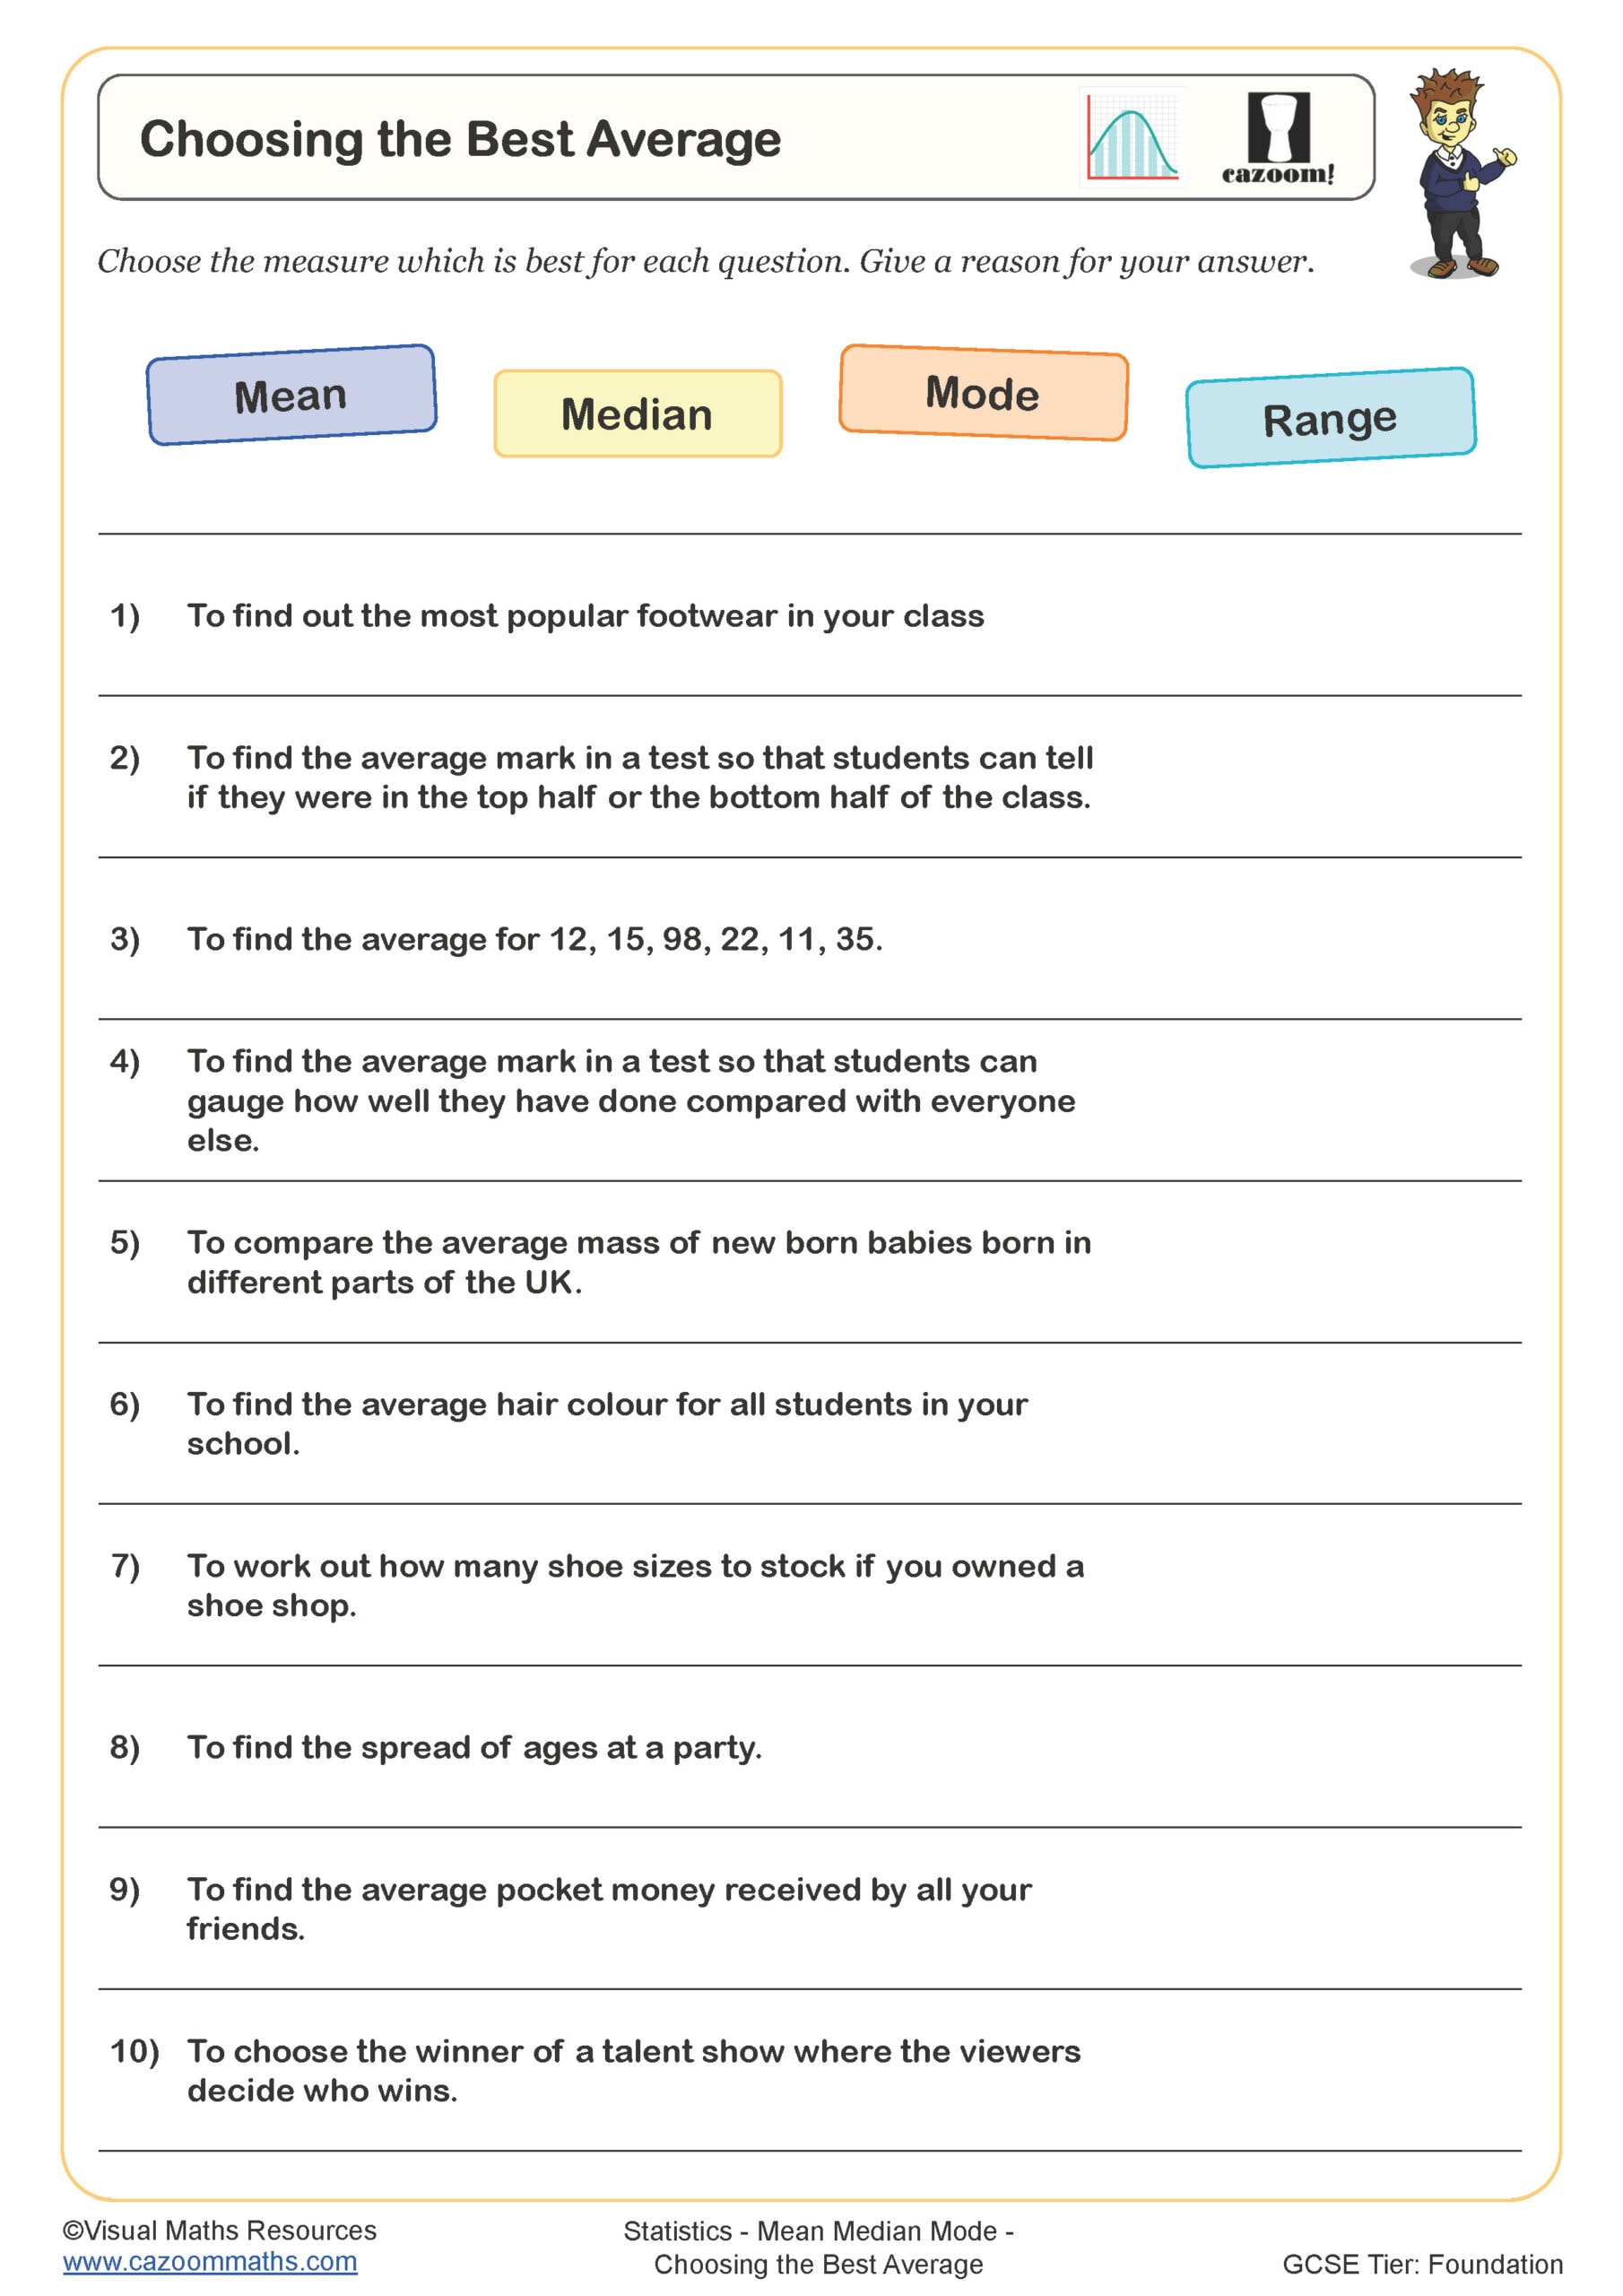
Choosing the Best Average
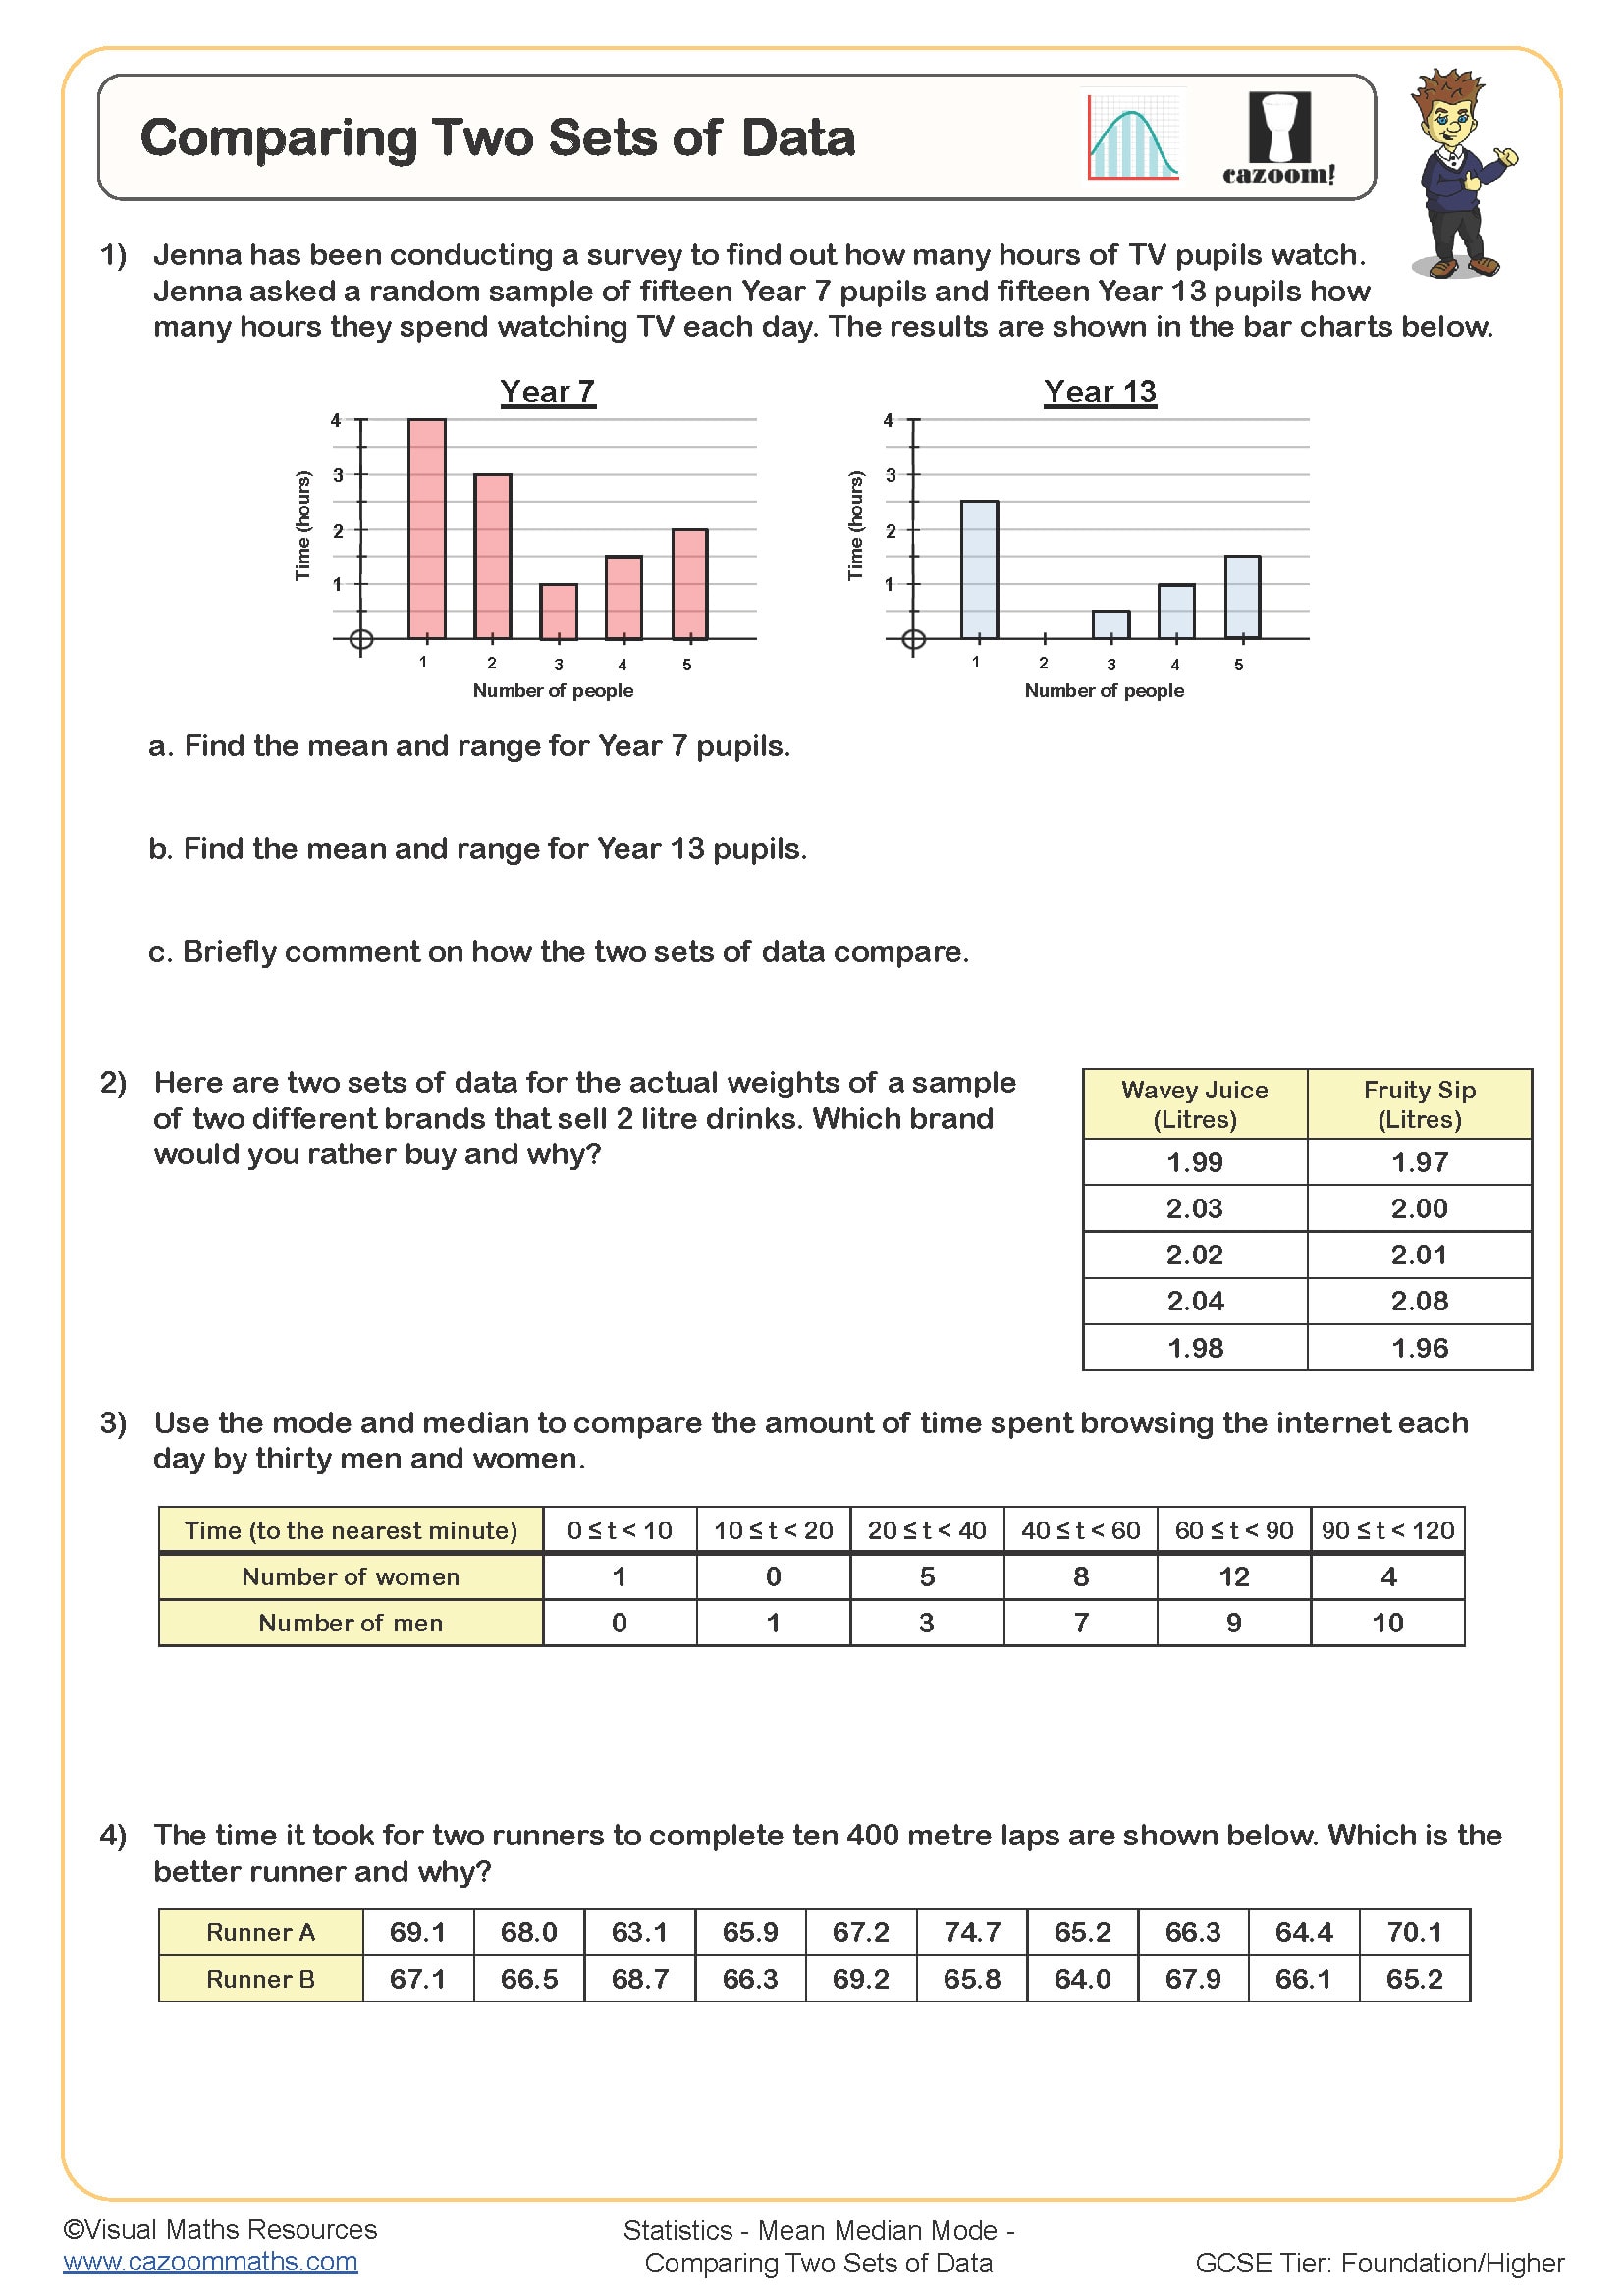
Comparing Two Sets of Data
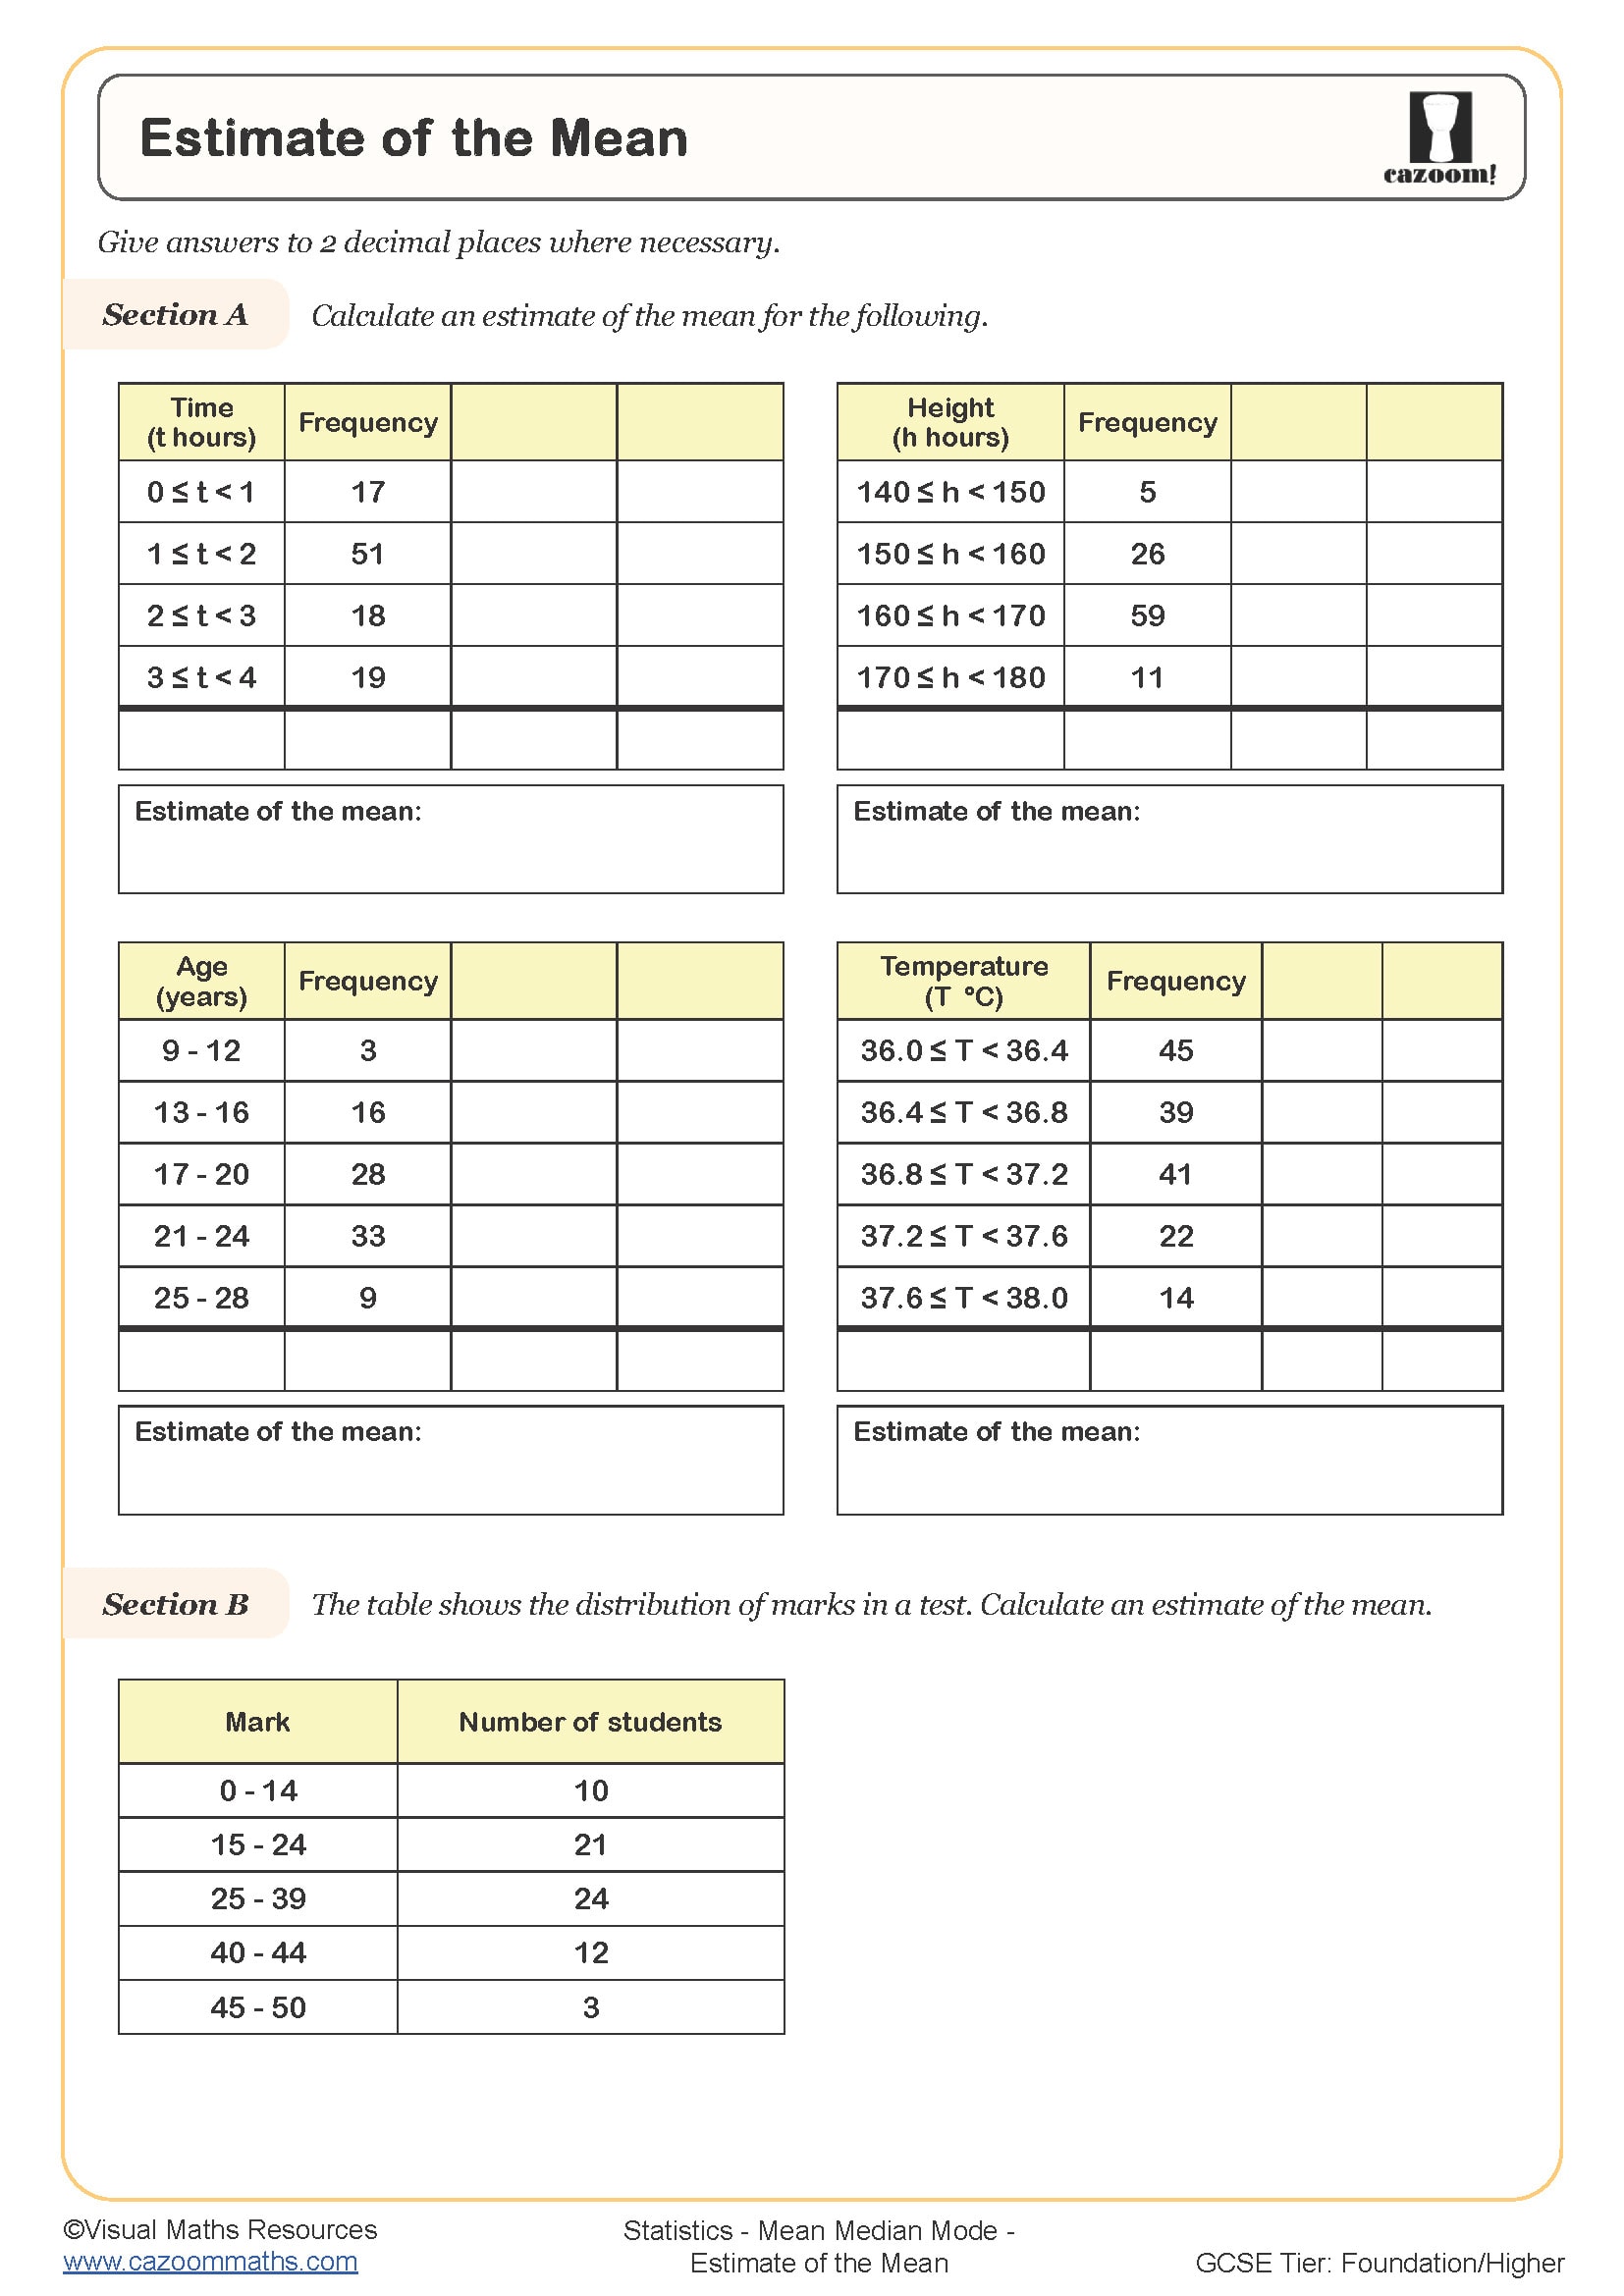
Estimate of the Mean
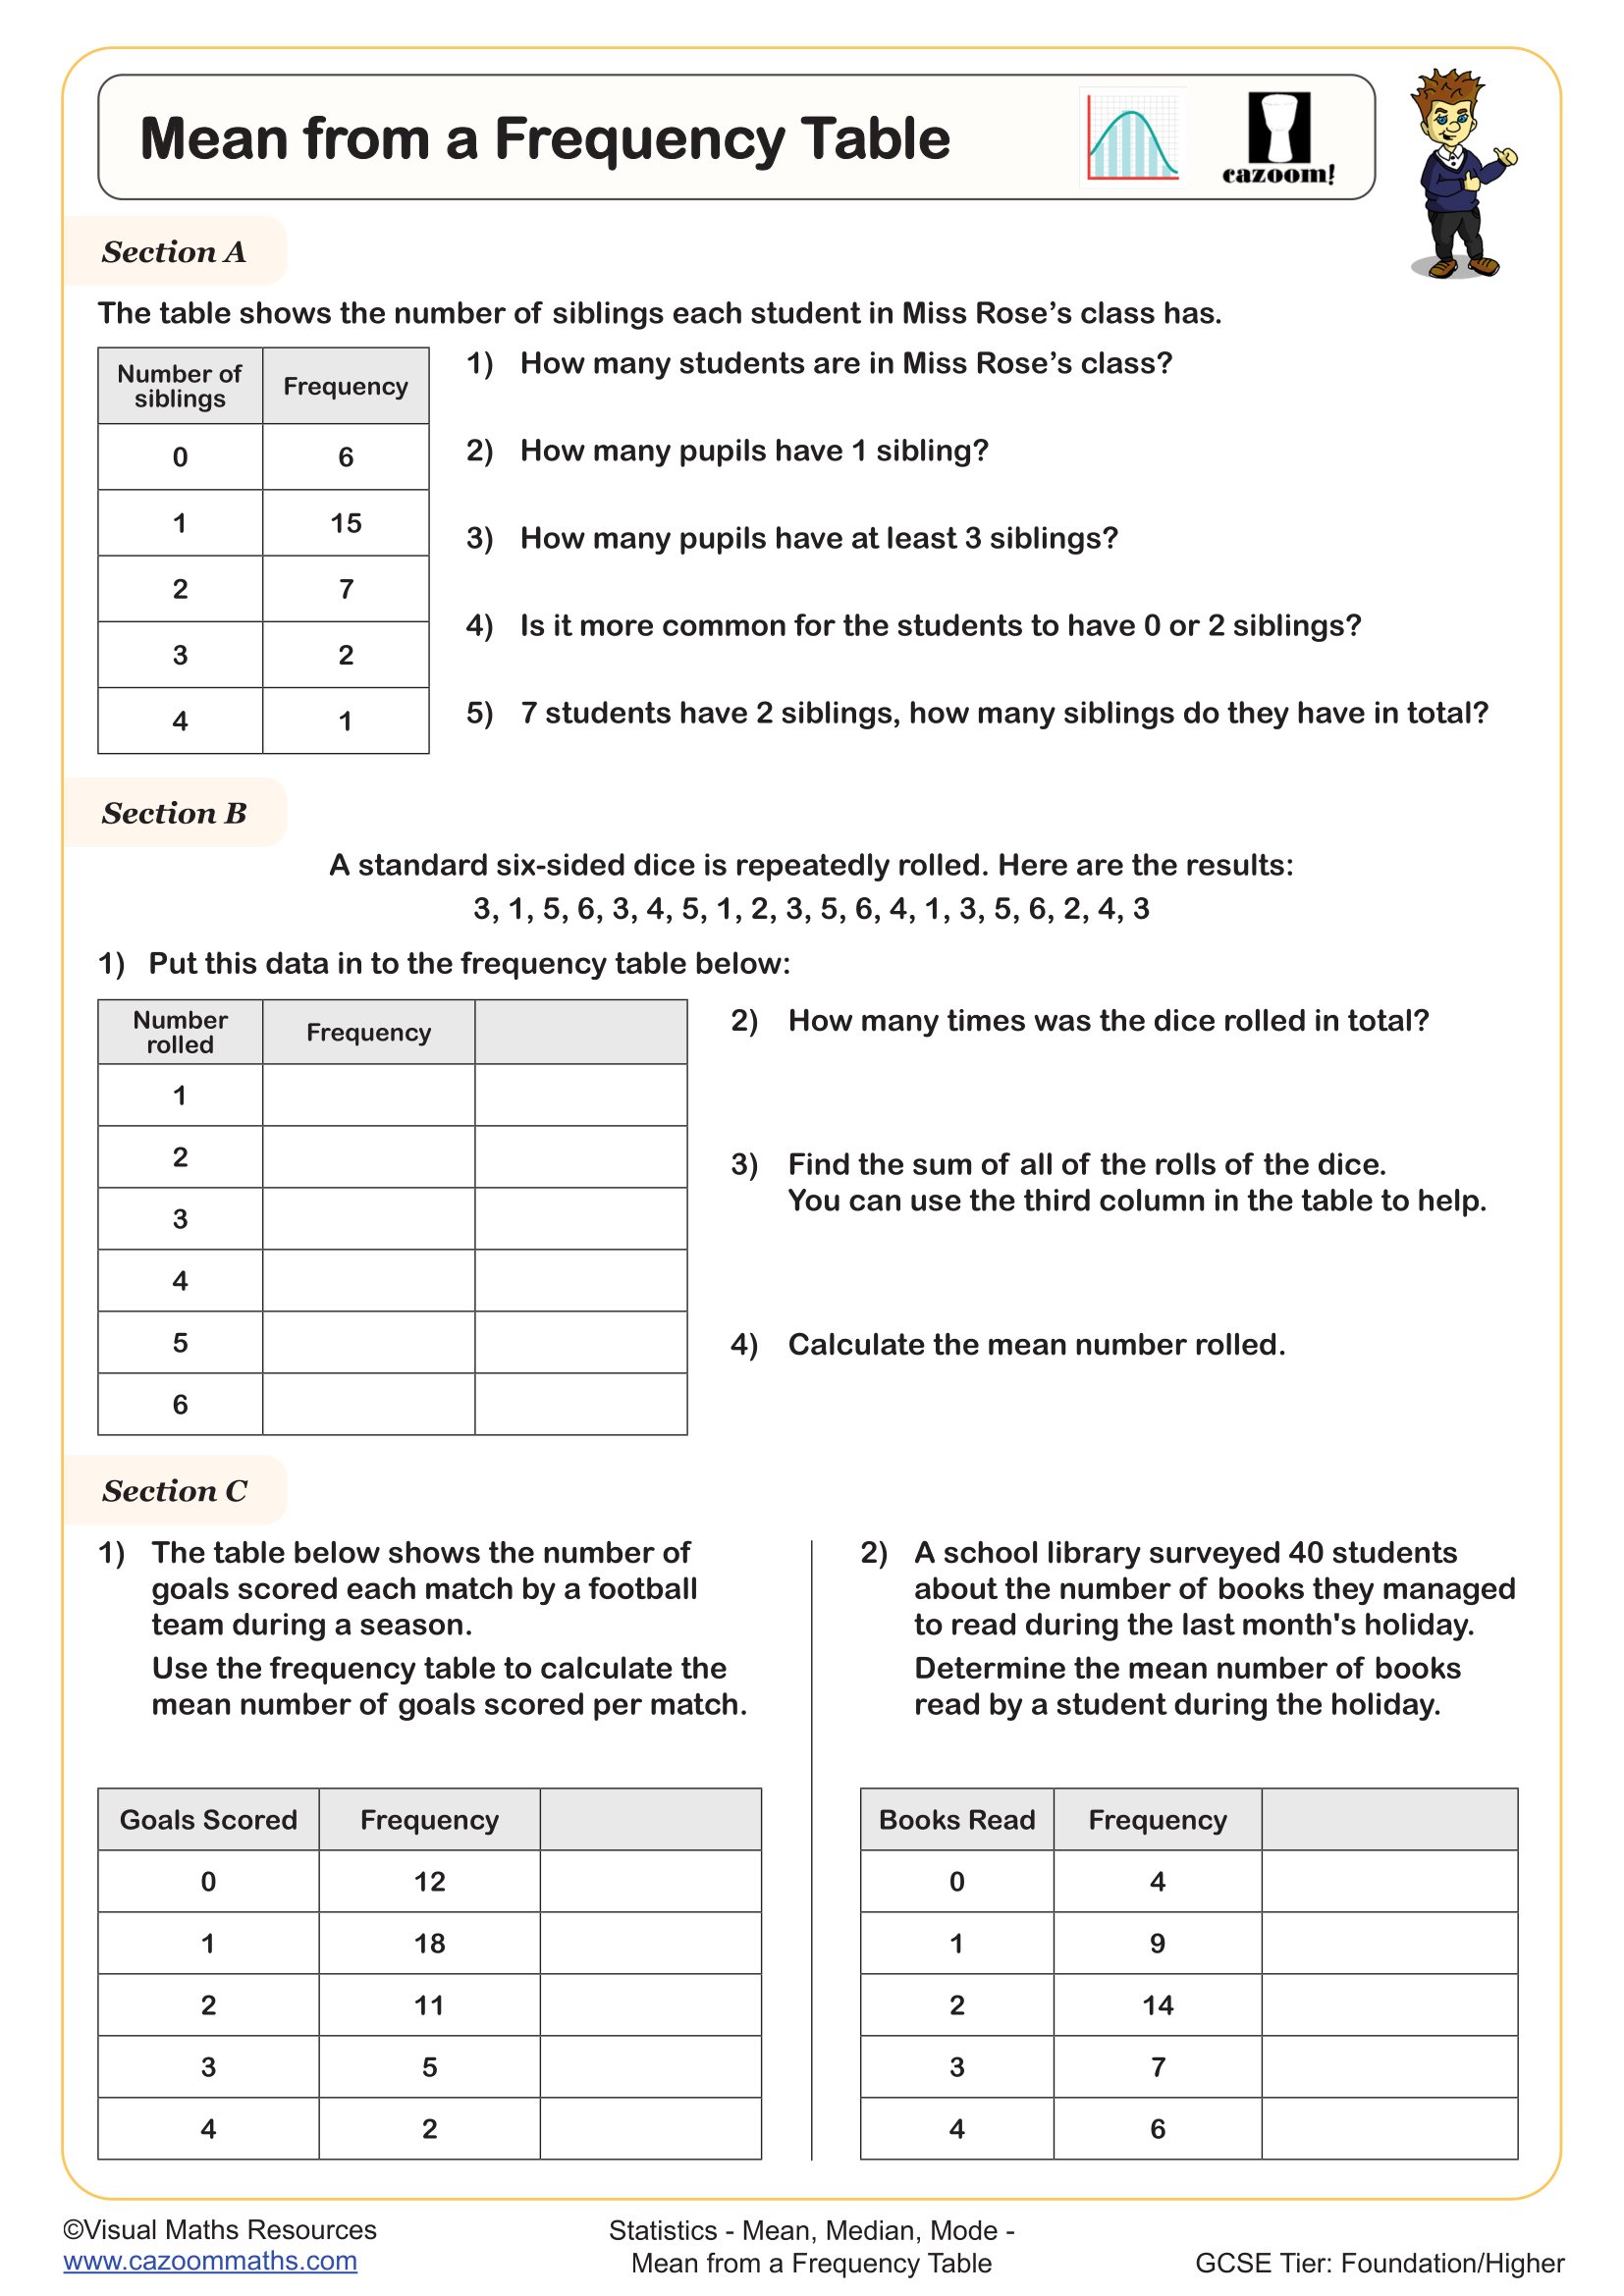
Mean from a Frequency Table
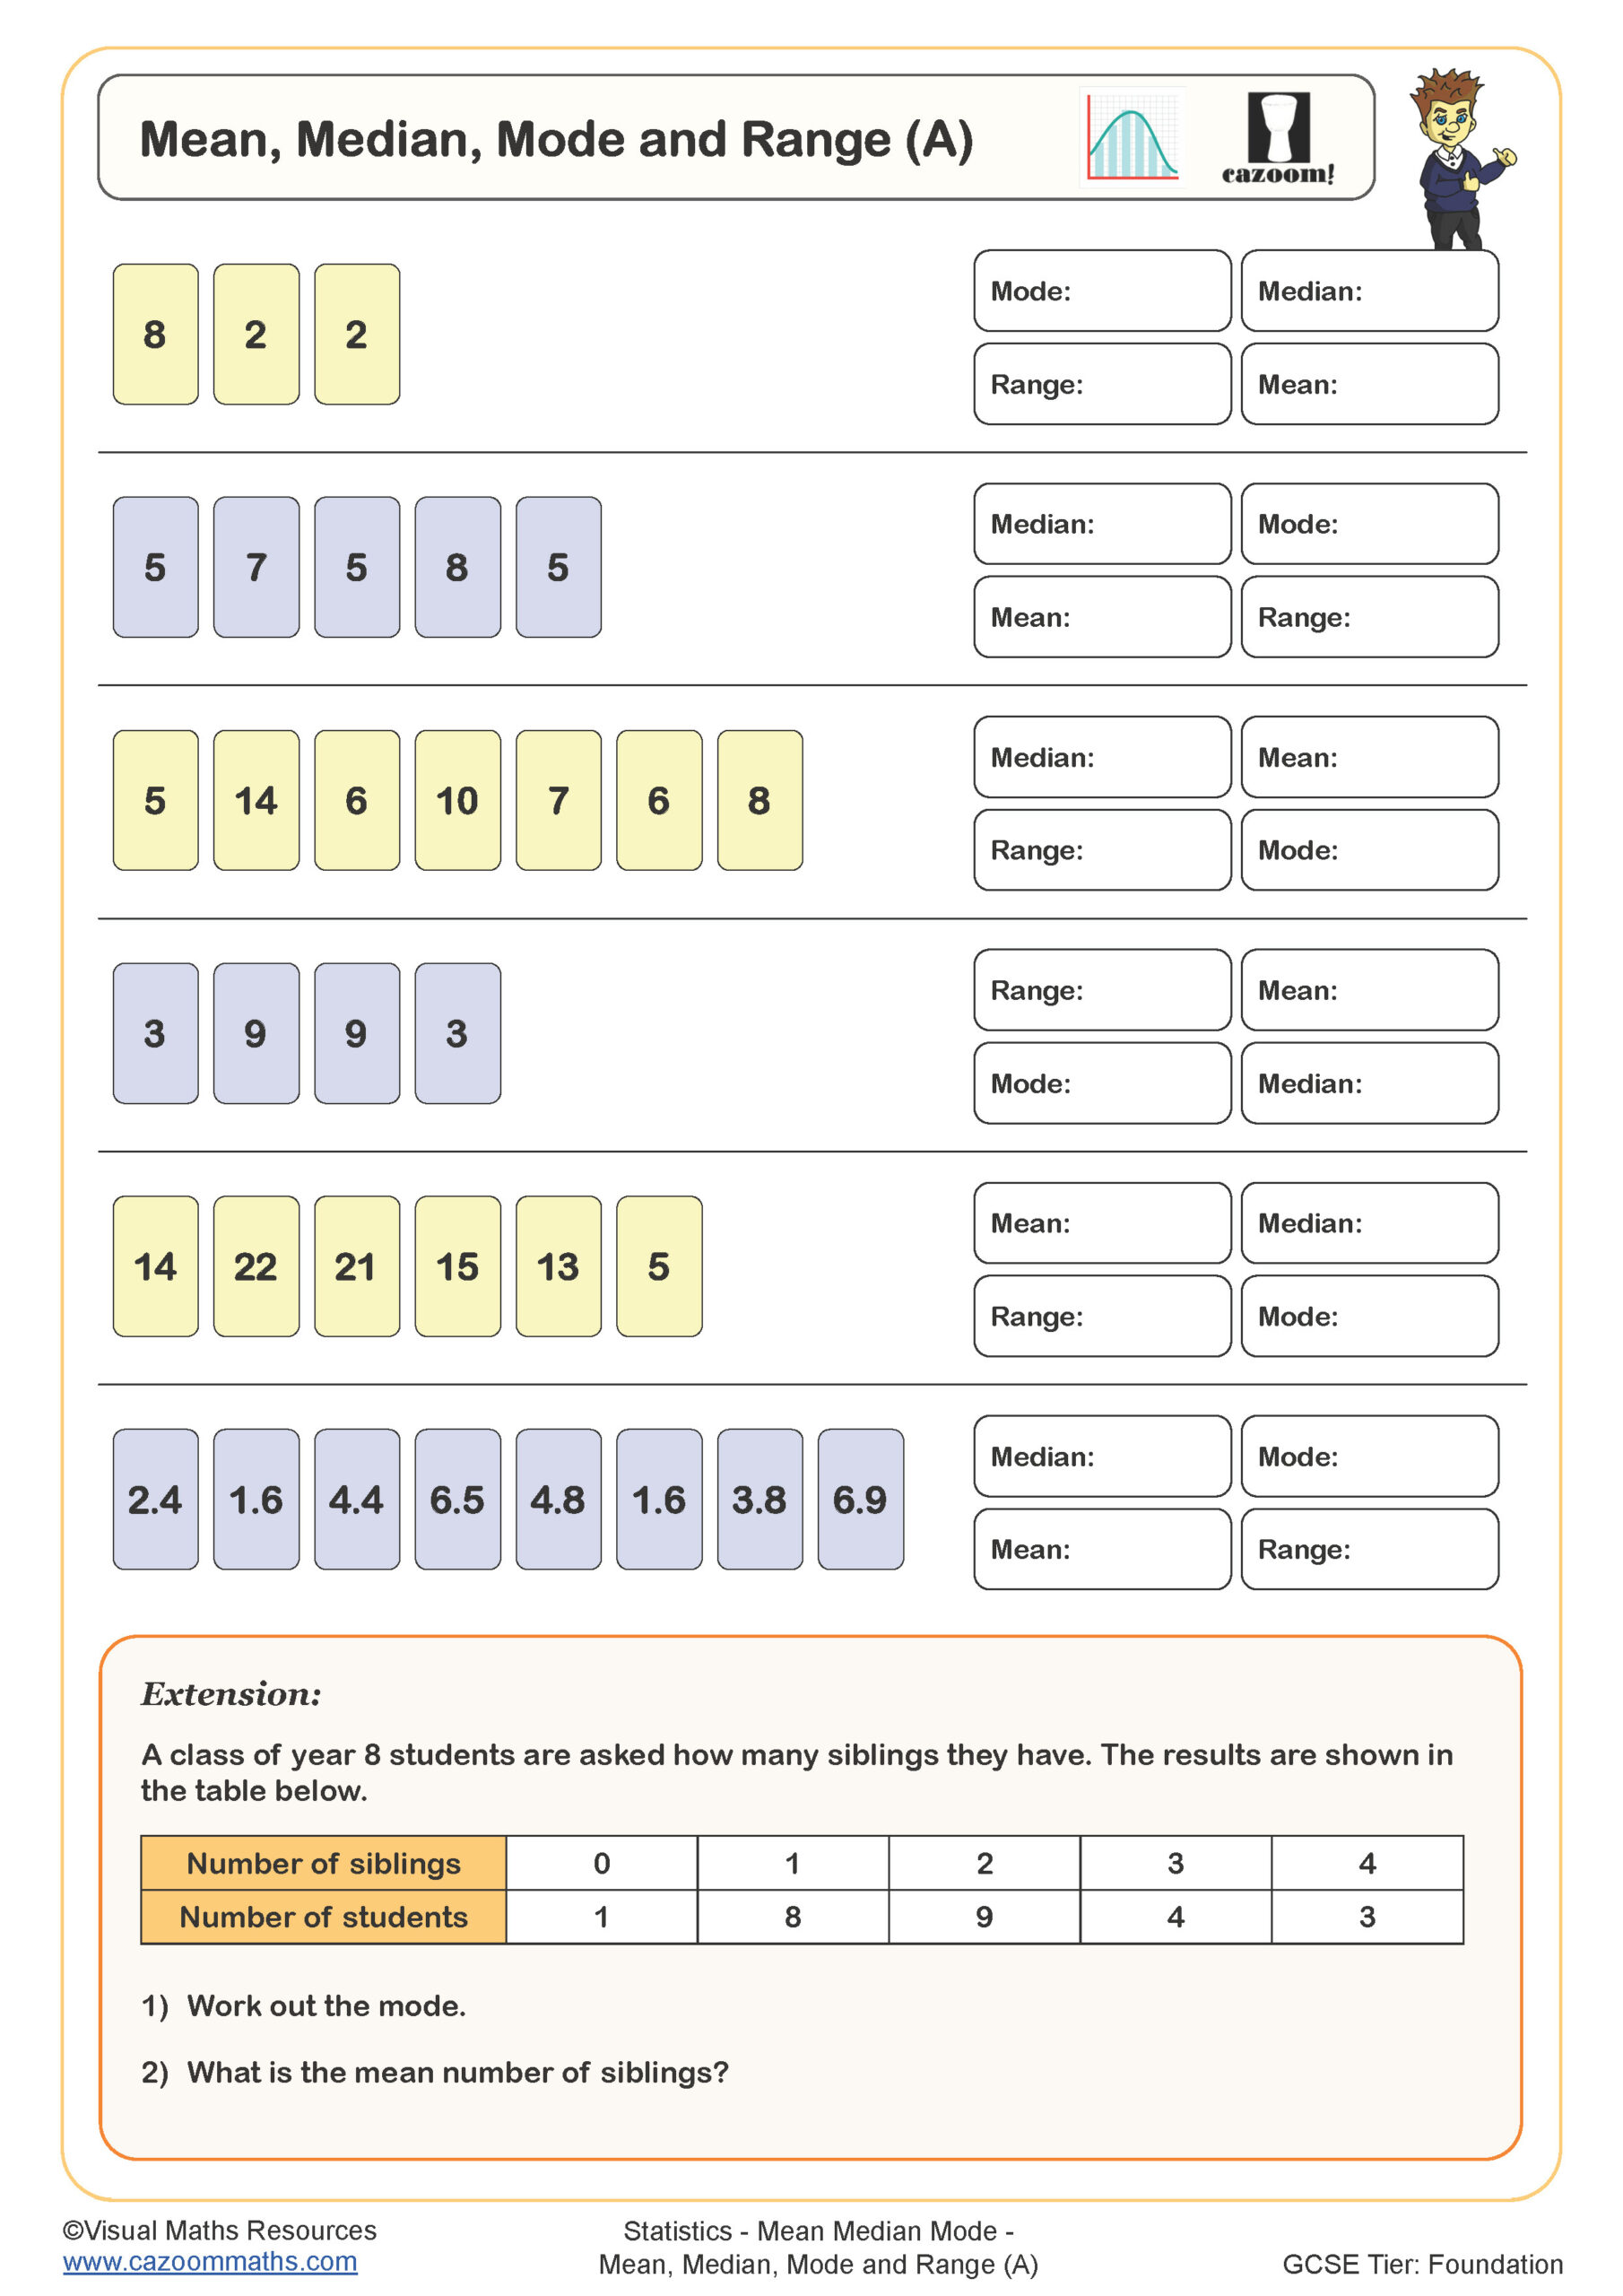
Mean, Median, Mode and Range (A)
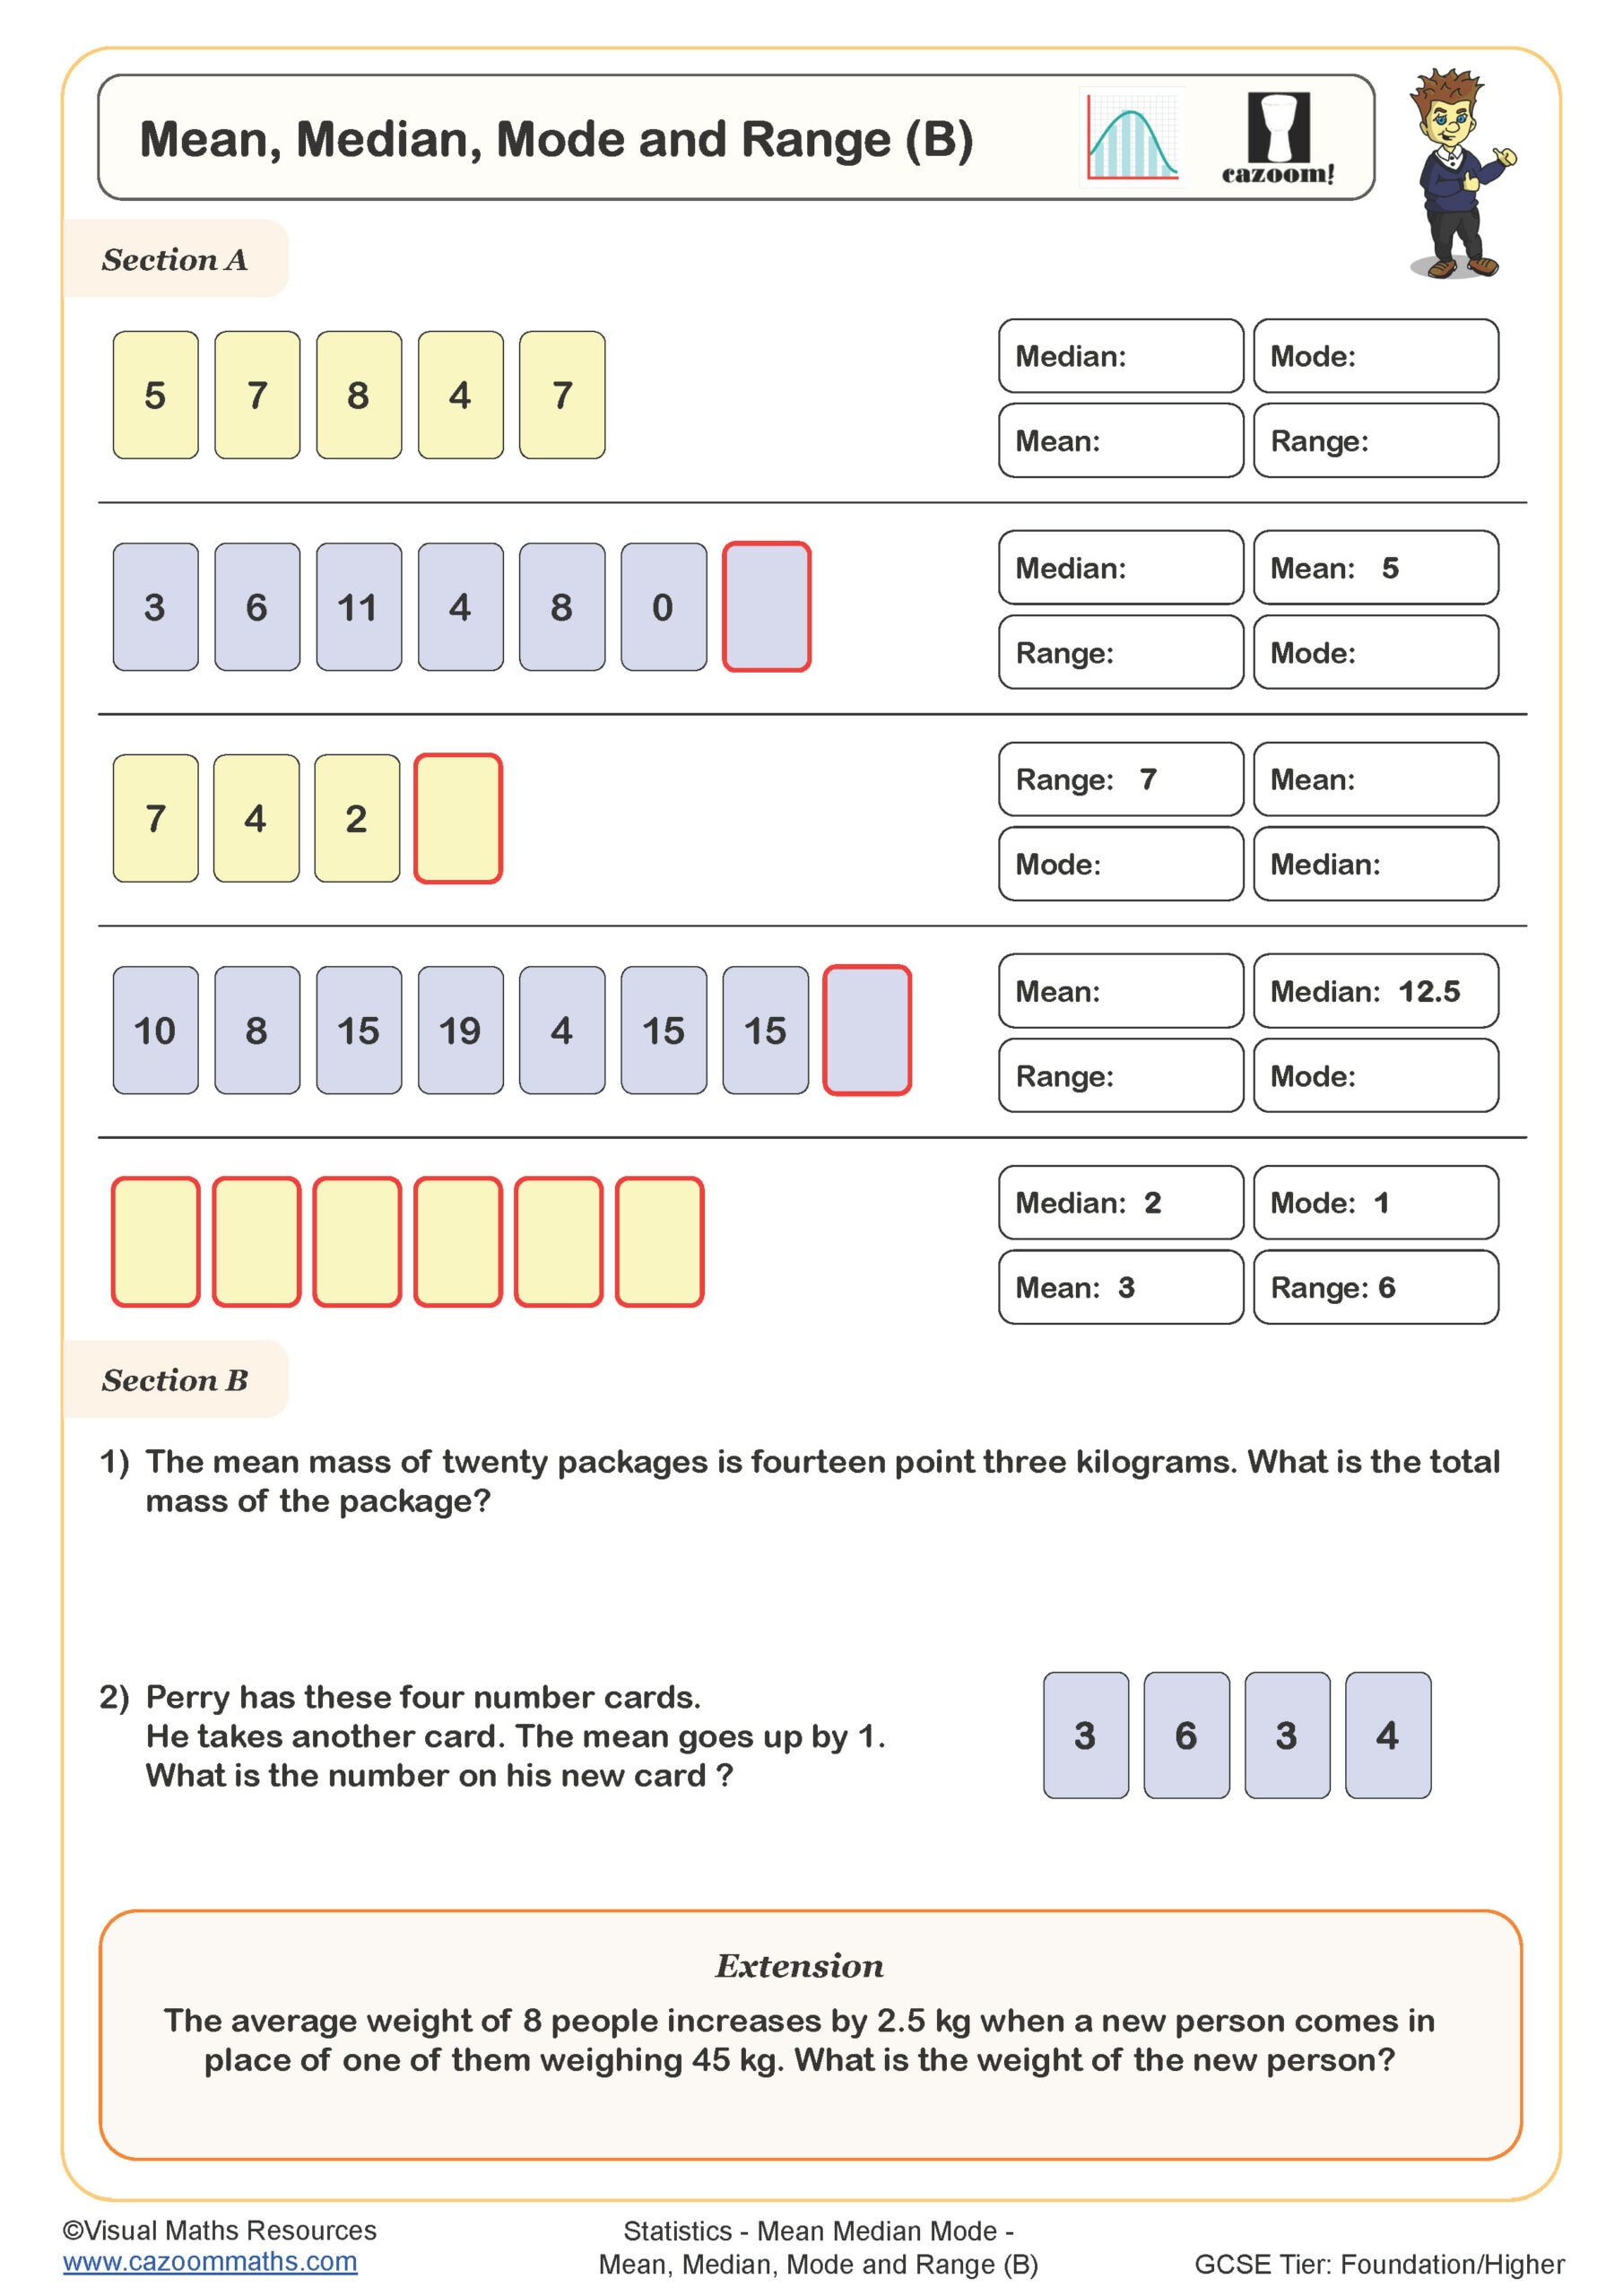
Mean, Median, Mode and Range (B)
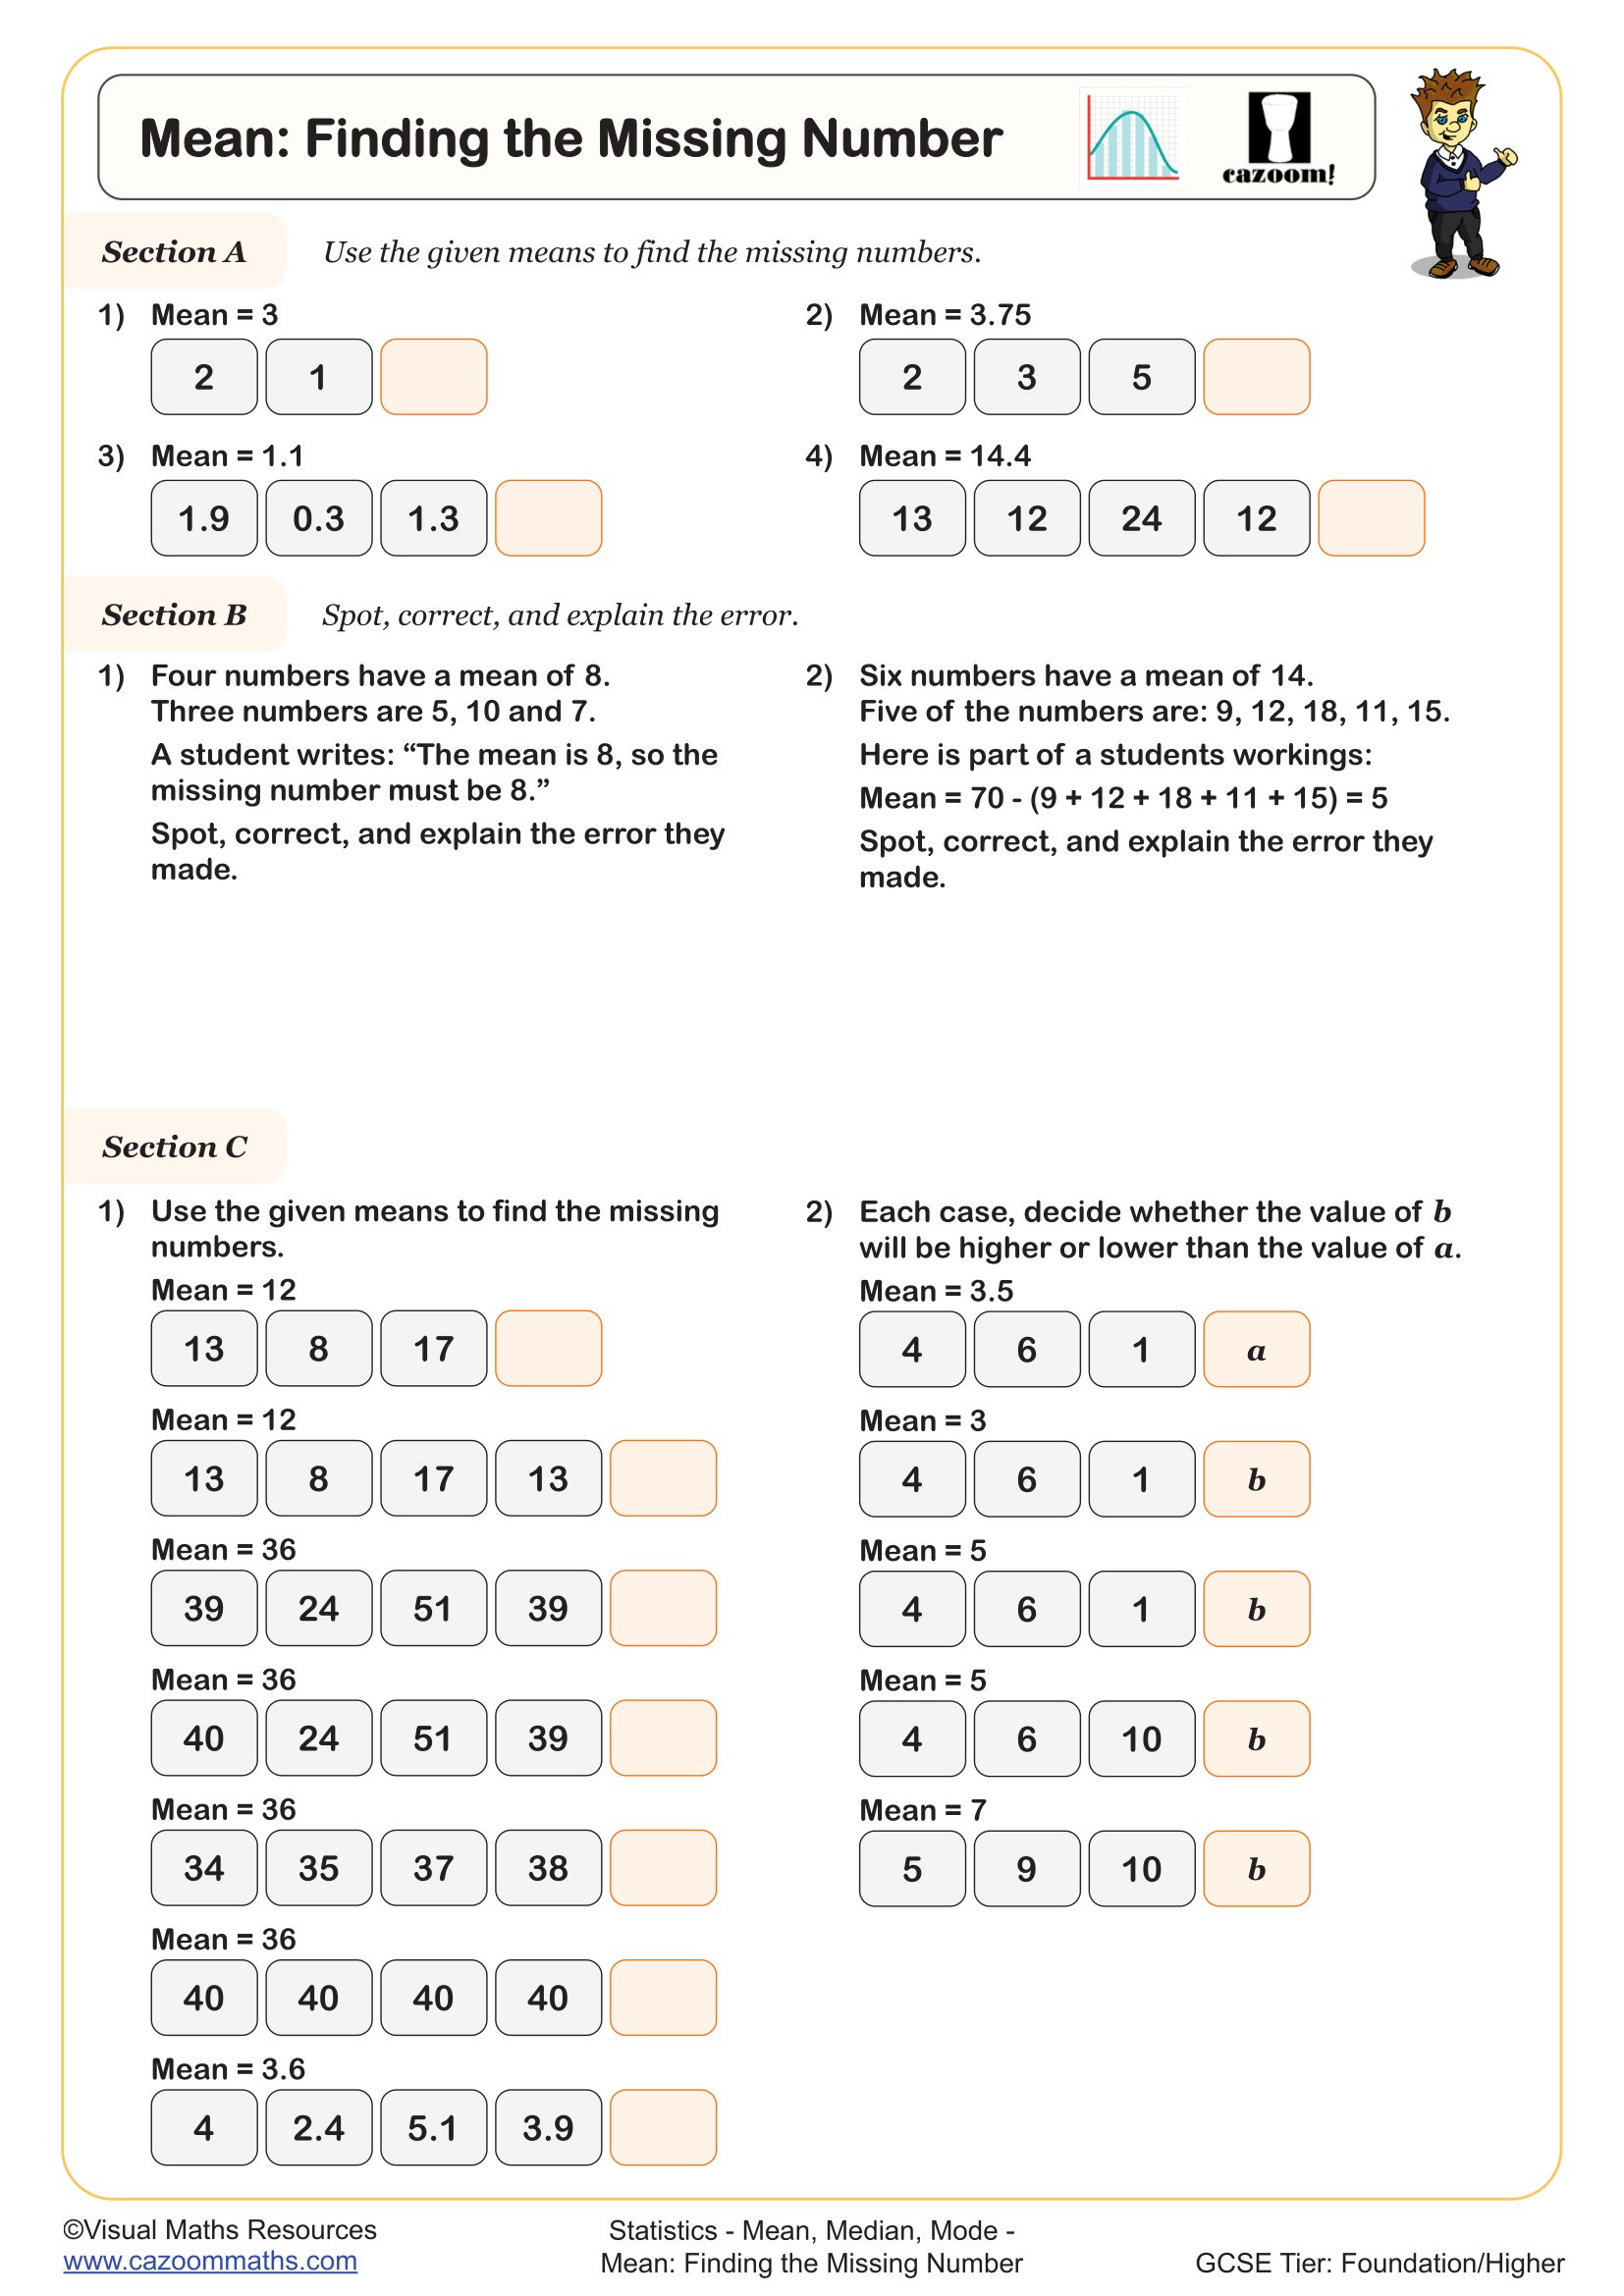
Mean: Finding the Missing Number
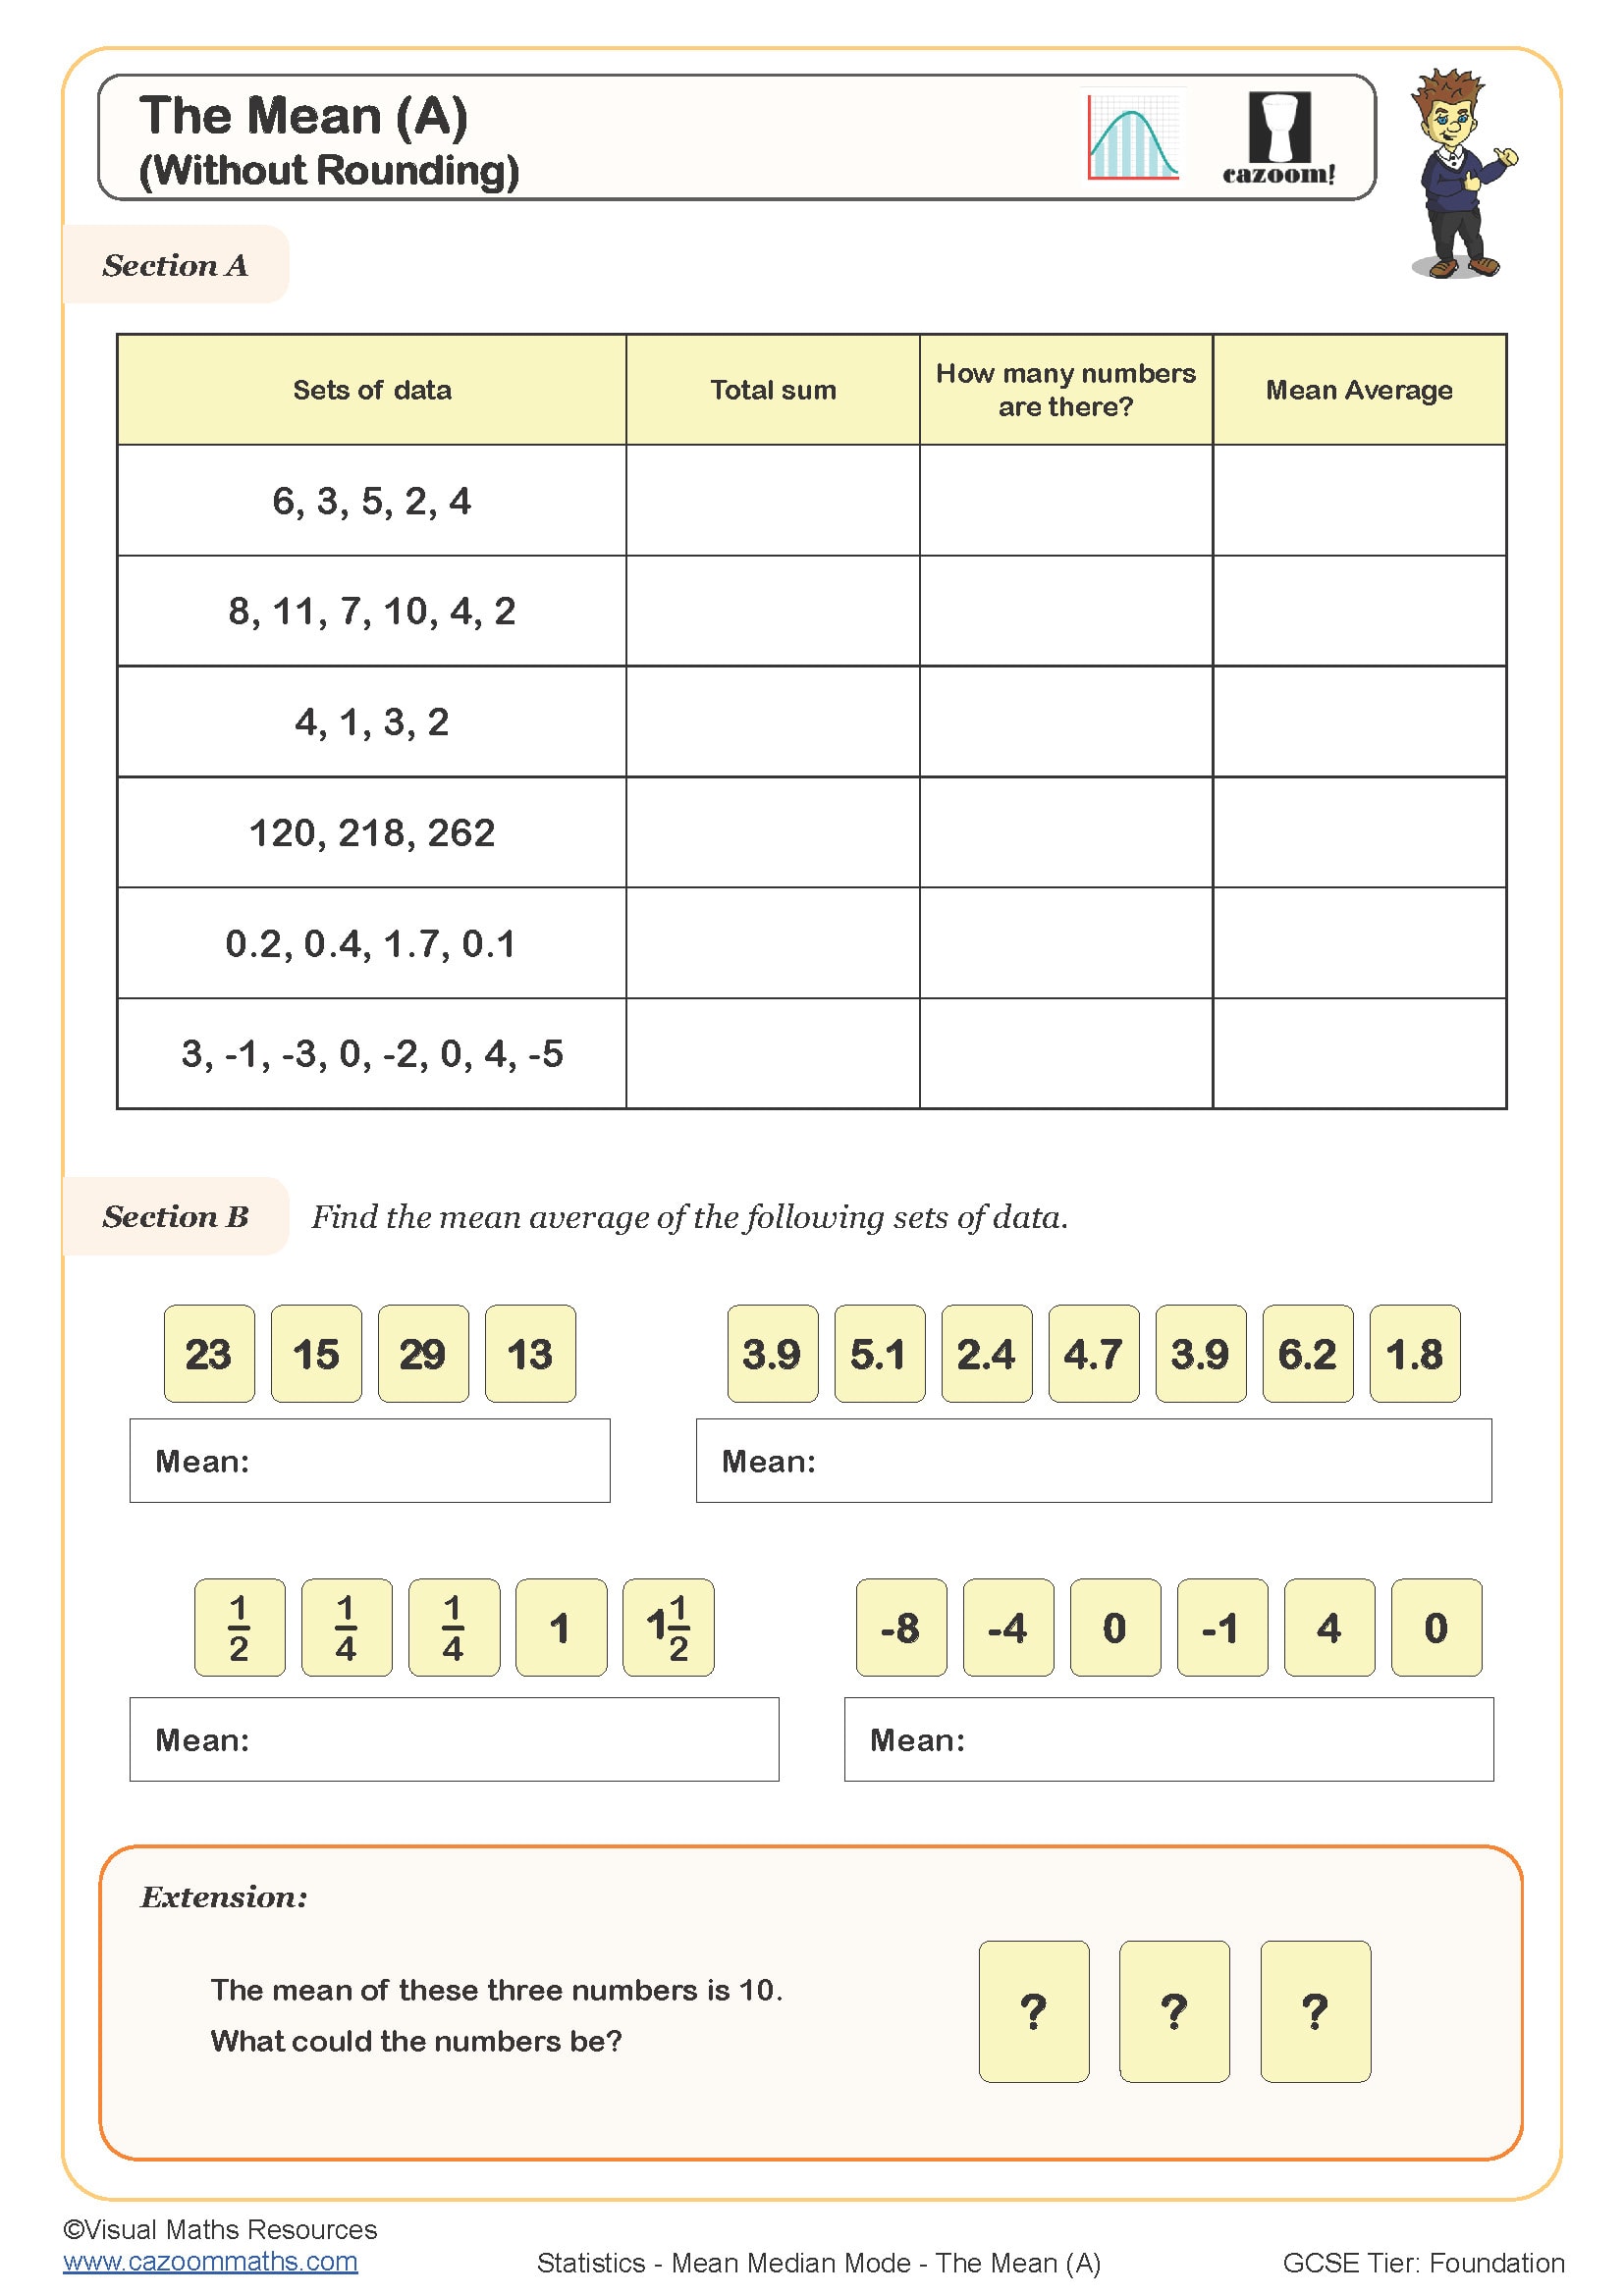
The Mean (A)
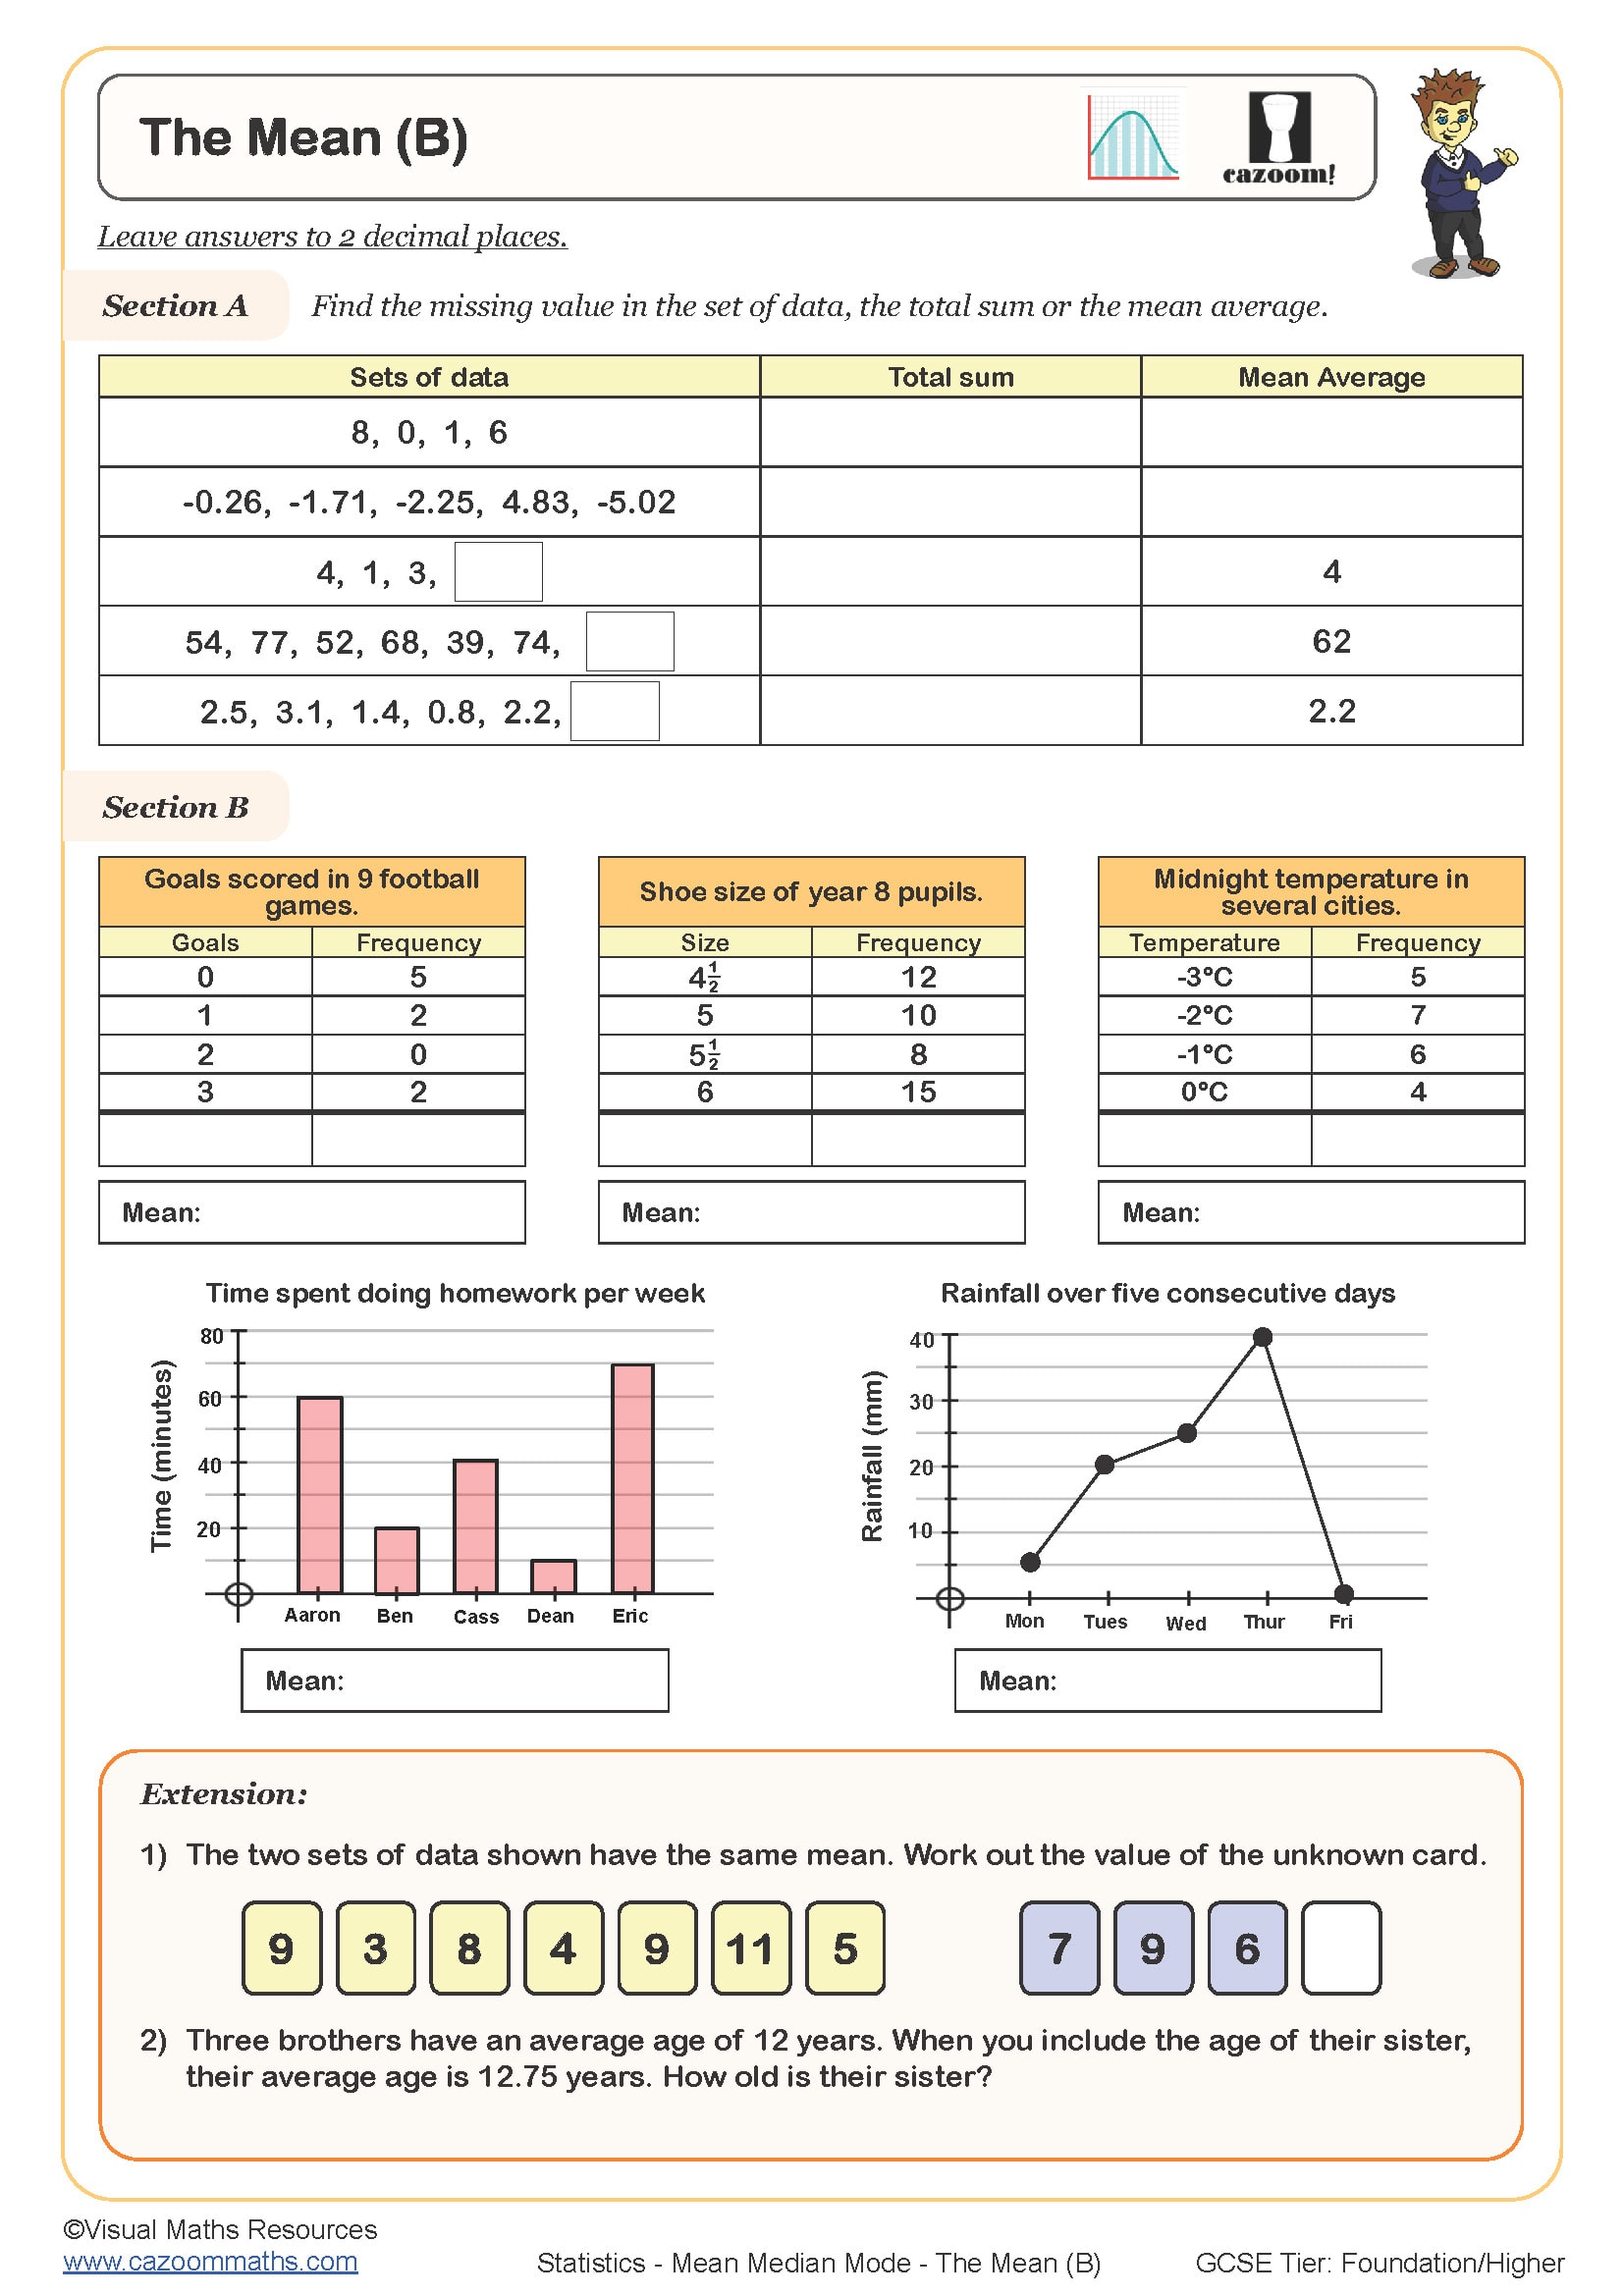
The Mean (B)
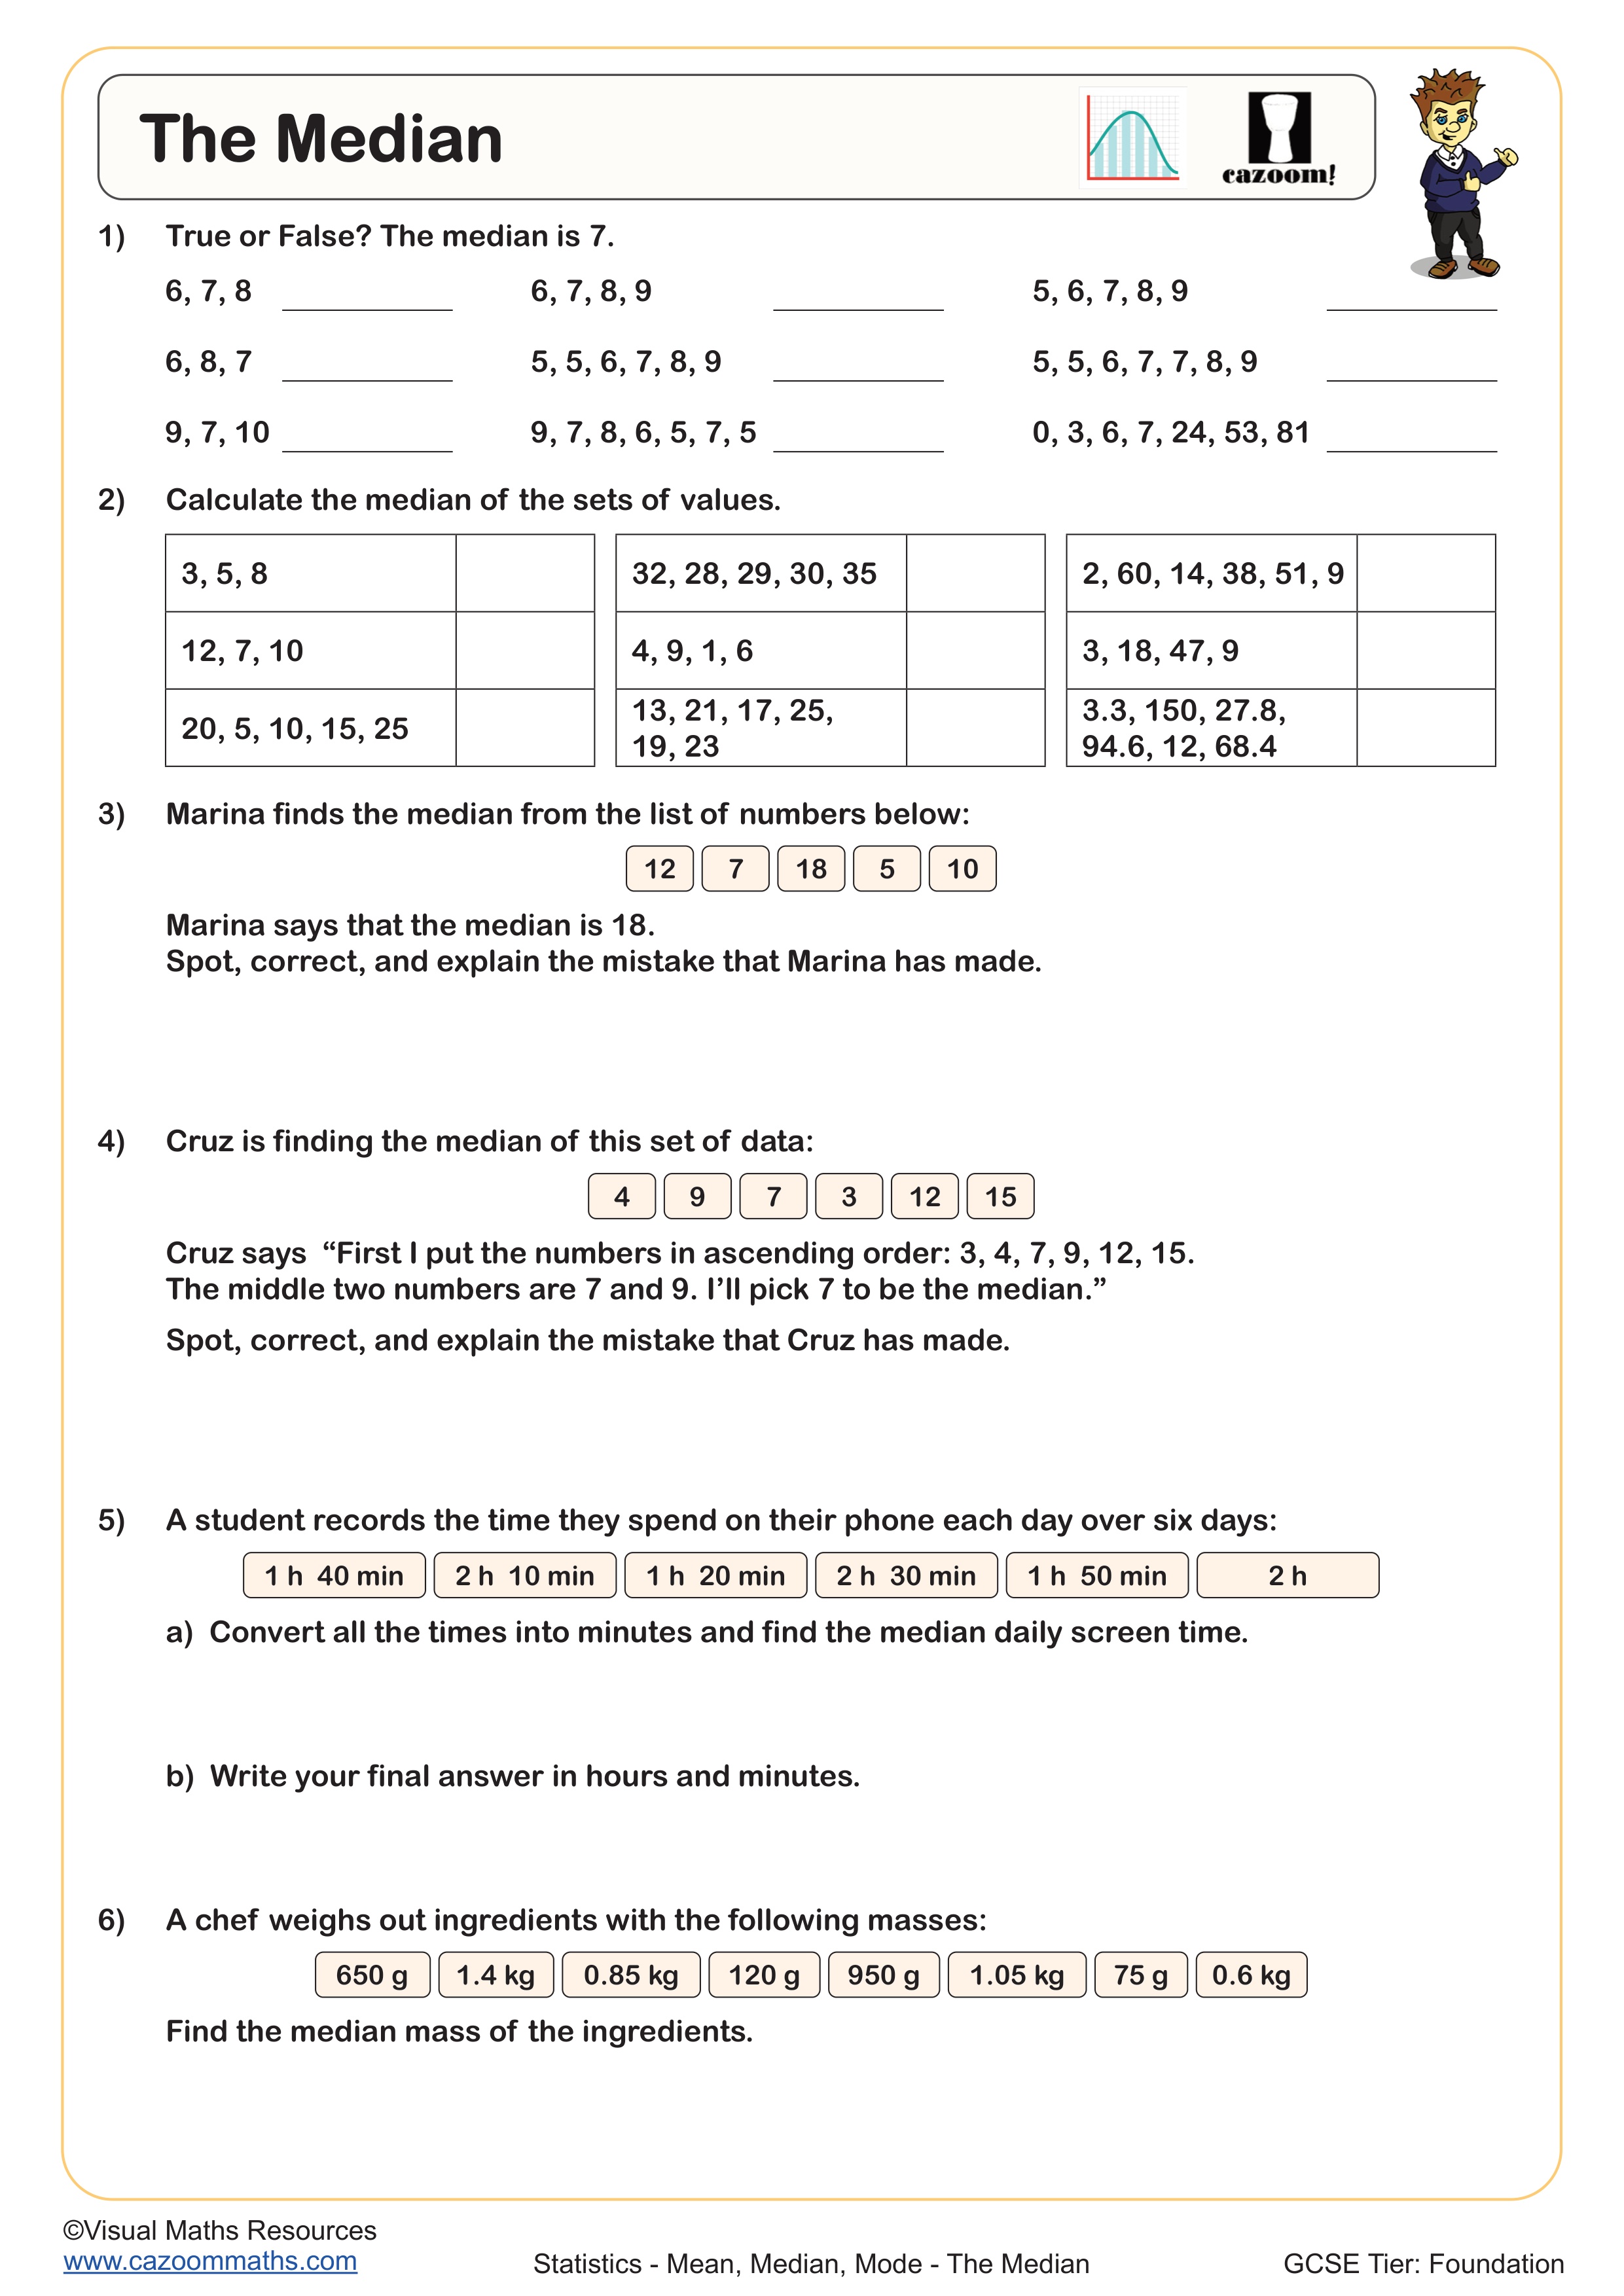
The Median
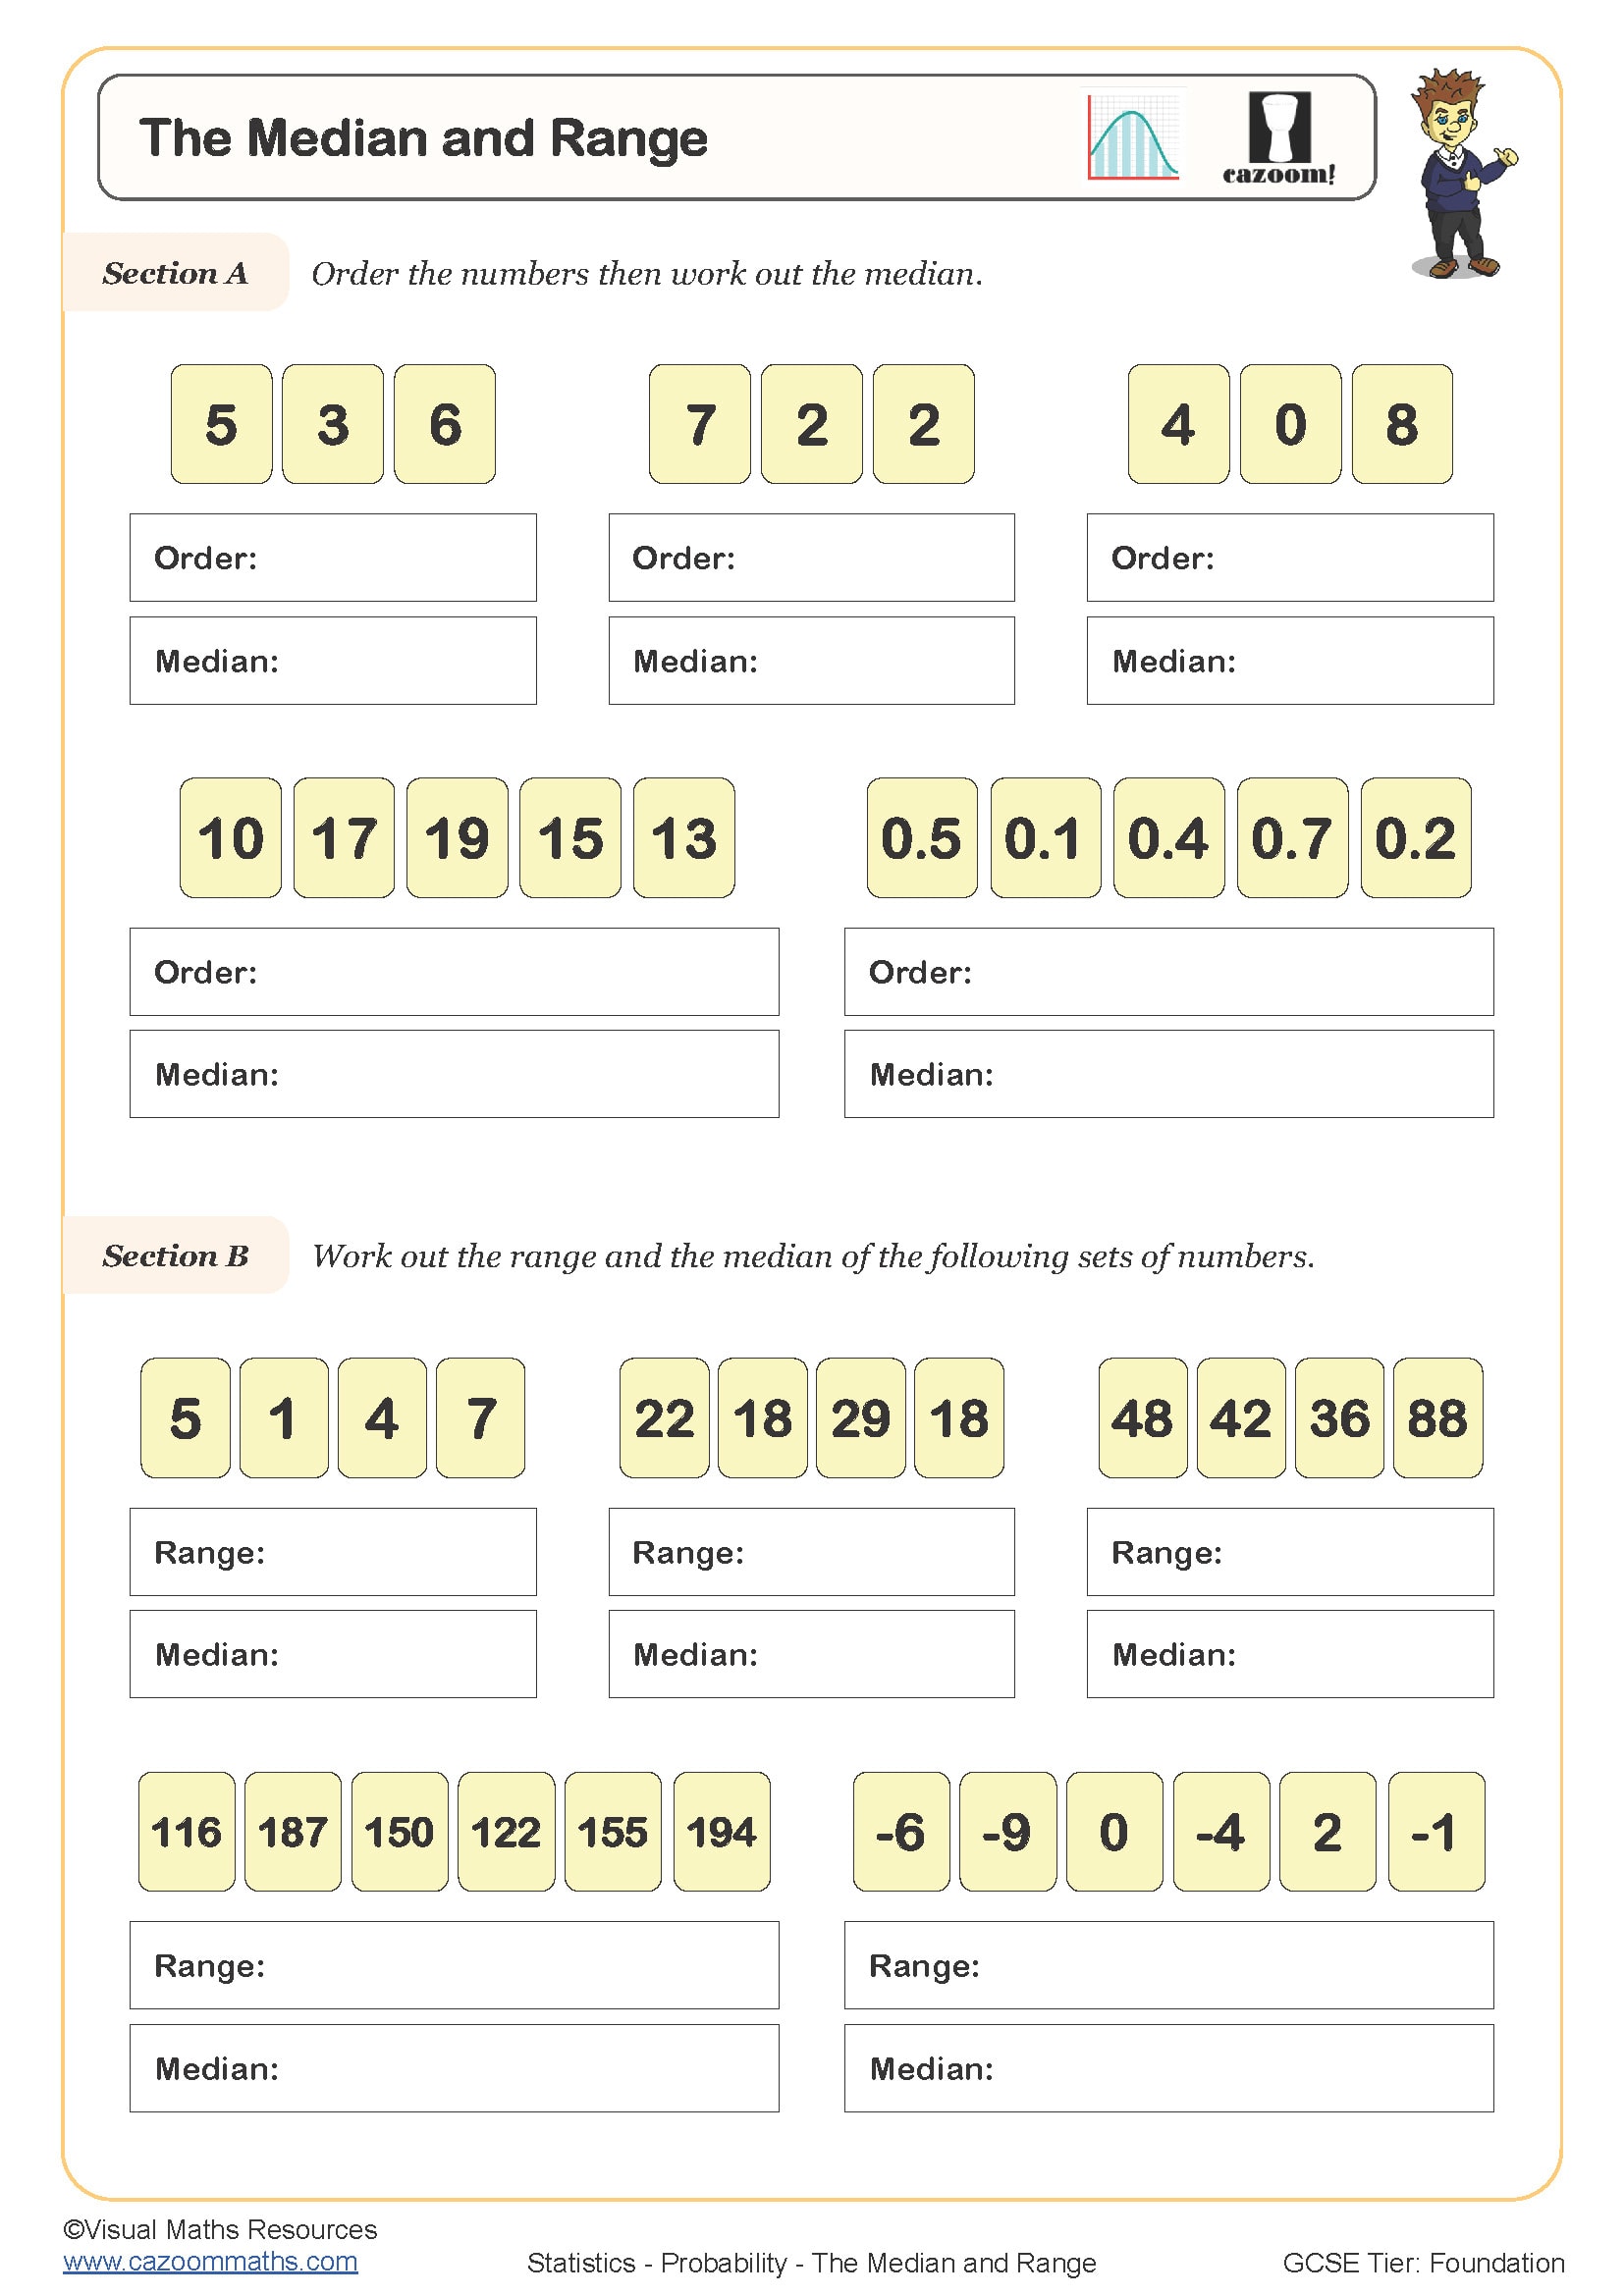
The Median and Range
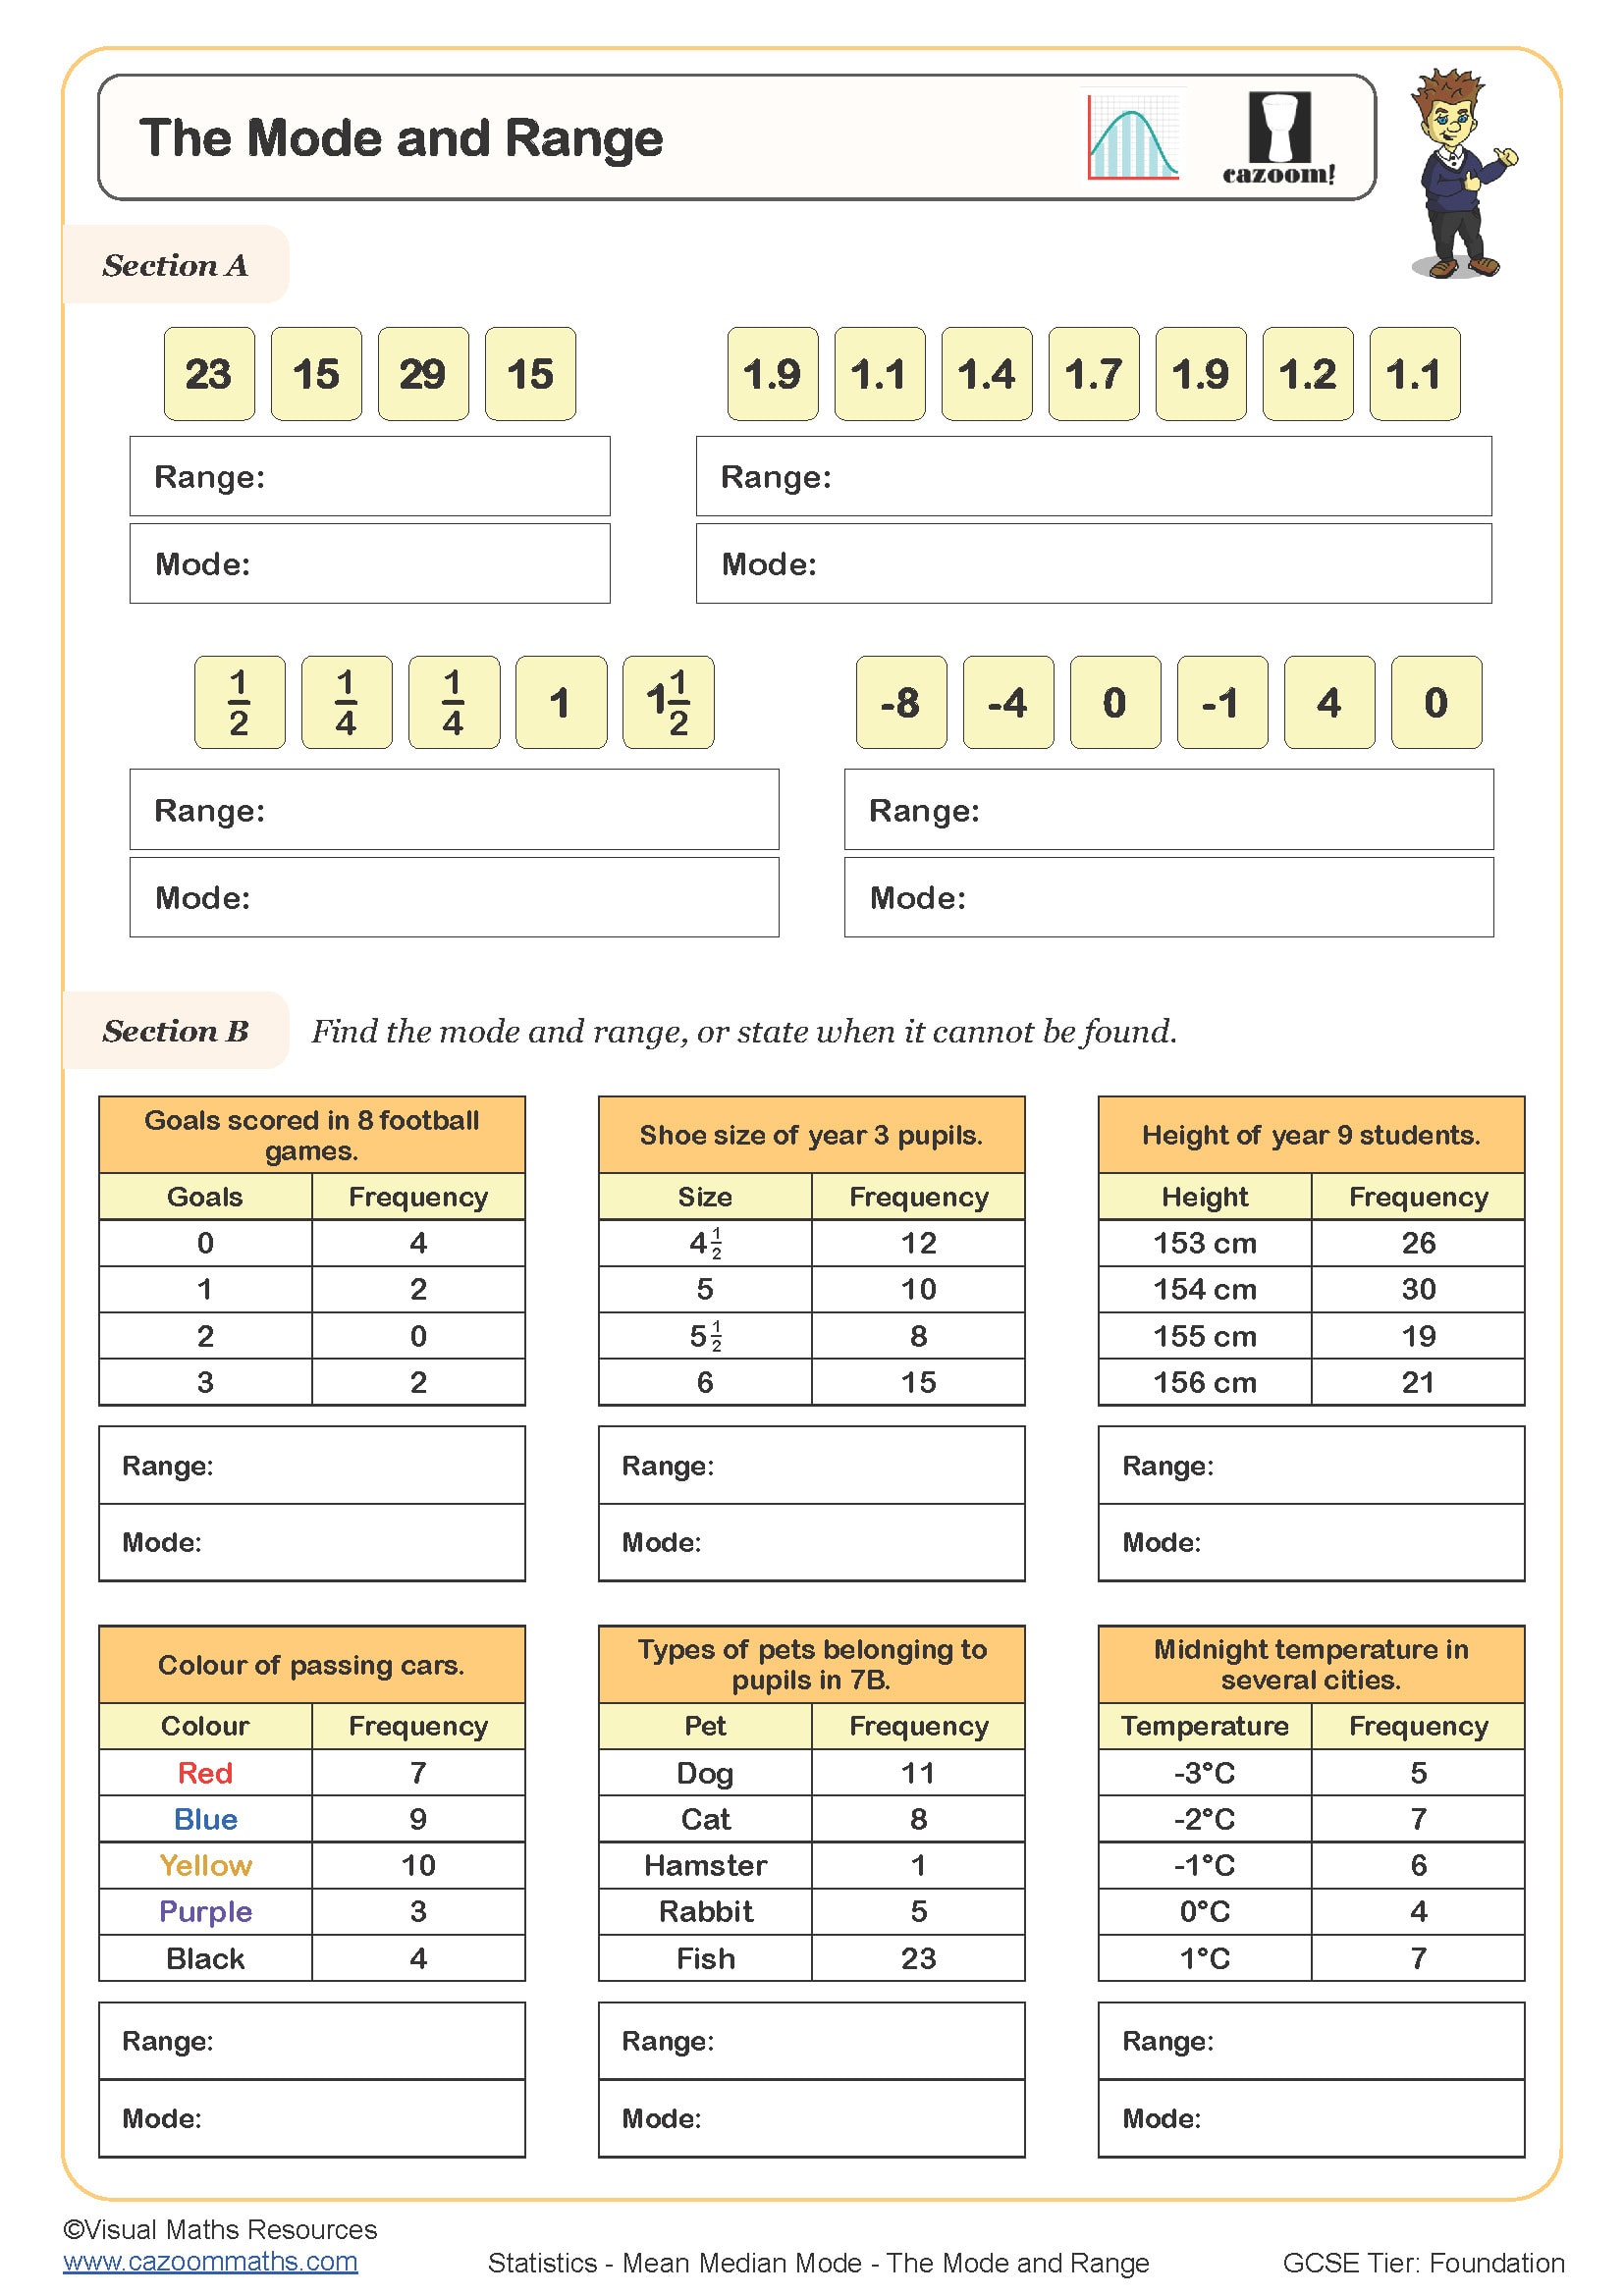
The Mode and Range
All worksheets are created by the team of experienced teachers at Cazoom Maths.
Want Better Results? Use Our Year 8 Mean, Median, Mode Worksheets Today
Statistical thinking develops through systematic exposure to varied problem types, and these worksheets provide exactly that structured pathway. Students need to learn different calculation techniques because their datasets contain whole numbers and complex decimal values. The sequence of instruction starts with basic calculations before moving to frequency tables to avoid student confusion while keeping the learning process consistent. Students develop their ability to distinguish between mean, median and mode through regular practice of these materials. Students develop into analytical thinkers who question numbers instead of accepting them after receiving this deeper analytical training.
Specific learning benefits include:
• Learn calculation techniques for ungrouped data
• Interprets frequency tables with accuracy
• Develops strategic thinking for problem selection
• Strengthens mental arithmetic through varied practice
• Recognises patterns in statistical distributions
• Builds resilience through graduated challenges
• Connects abstract concepts to meaningful contexts
Complete Topic List: What’s Included in KS3 This Statistics Activities Pack
These carefully sequenced worksheets guide students from concrete numerical examples through pictorial representations to abstract statistical reasoning, ensuring deep conceptual understanding develops naturally. Worked solutions accompany each worksheet, demonstrating complete calculation methods that reveal mathematical thinking processes rather than just final answers. The progression from simple lists to grouped data mirrors the curriculum's expectations whilst providing extension opportunities for advanced learners.
The worksheets in this collection include:
• Mean from Simple Data — calculating averages from lists of whole numbers and decimals
• Median with Odd and Even Sets — finding middle values in ordered numerical sequences
• Mode from Data Lists — identifying the most frequent values in various datasets
• Range Calculations — determining spread by finding differences between extremes
• Mean from Frequency Tables — using frequency multiplication to find weighted averages
• Median from Grouped Data — locating middle values in frequency distributions
• Finding Missing Values — working backwards from given averages to complete datasets
• Mixed Average Problems — combining multiple statistical measures in a single question
• Estimating the Mean — developing approximation skills with larger datasets
• Comparing Data Sets — analysing multiple groups using different measures
Support Your Child’s Learning With Year 8 Mean, Median, Mode Worksheets
Clear layouts with generous spacing reduce cognitive load, allowing learners to focus entirely on mathematical reasoning rather than decoding cluttered presentations. The progression of questions in the material allows natural differentiation to occur because it starts with foundational problems before moving to challenging extensions. The combination of number cards with frequency charts supports various learning approaches while keeping mathematical standards intact. The resources enable teachers to use their professional expertise because they offer adaptable implementation methods that work for whole-class instruction, small group work and independent study. The answer keys contain step-by-step solutions which help teachers identify student misconceptions during grading. The practical design elements stem from actual classroom experience because educators who teach statistics to Year 8 students with diverse backgrounds developed these resources.
From Science Experiments to Sports: Real-Life Mean, Median, Mode for Year 8 Pupils
Young people encounter averages constantly, though they rarely recognise these mathematical concepts operating behind everyday decisions and information.
• Analysing gaming scores and player performance rankings
• Understanding weather patterns and climate data trends
• Comparing prices when shopping for technology products
• Interpreting football league tables and player statistics
• Evaluating social media engagement metrics and trends
• Planning revision schedules using average study times
• Understanding scientific experiment results in laboratories
• Making sense of news reports featuring survey data