Year 8 Stem and Leaf Diagrams Worksheets
All worksheets are created by the team of experienced teachers at Cazoom Maths.
Do Your Pupils Struggle With Statistics? Download Our Printable KS3 Stem and Leaf Diagram Worksheets
Building on Year 7 foundations, these resources guide students through increasingly sophisticated data analysis techniques, preparing them for GCSE-level statistics. The transition from simple frequency tables to stem and leaf representations marks a crucial development in mathematical thinking, where students begin recognising patterns and distributions within raw data. The structured exercises enable students to develop analytical skills for advanced mathematics while maintaining their interest through various contexts when they practice regularly. The method enables students to progress from basic arithmetic operations to actual statistical analysis.
Specific learning benefits include:
• Master the construction of ordered diagrams
• Develops median and quartile calculation skills
• Strengthens data comparison abilities
• Builds confidence with back-to-back representations
• Enhances problem-solving through contextual questions
• Prepares groundwork for GCSE statistics
• Improves mathematical communication skills
Classroom-Ready Statistics Worksheet Topics for Lessons, Homework, and Revision
These worksheets follow the concrete-pictorial-abstract progression that underpins effective mathematical learning, moving from visual representations through guided practice to independent application. Each resource includes fully worked solutions that demonstrate the reasoning behind every step, helping students understand not just what to do but why specific approaches work.
The worksheets in this collection include:
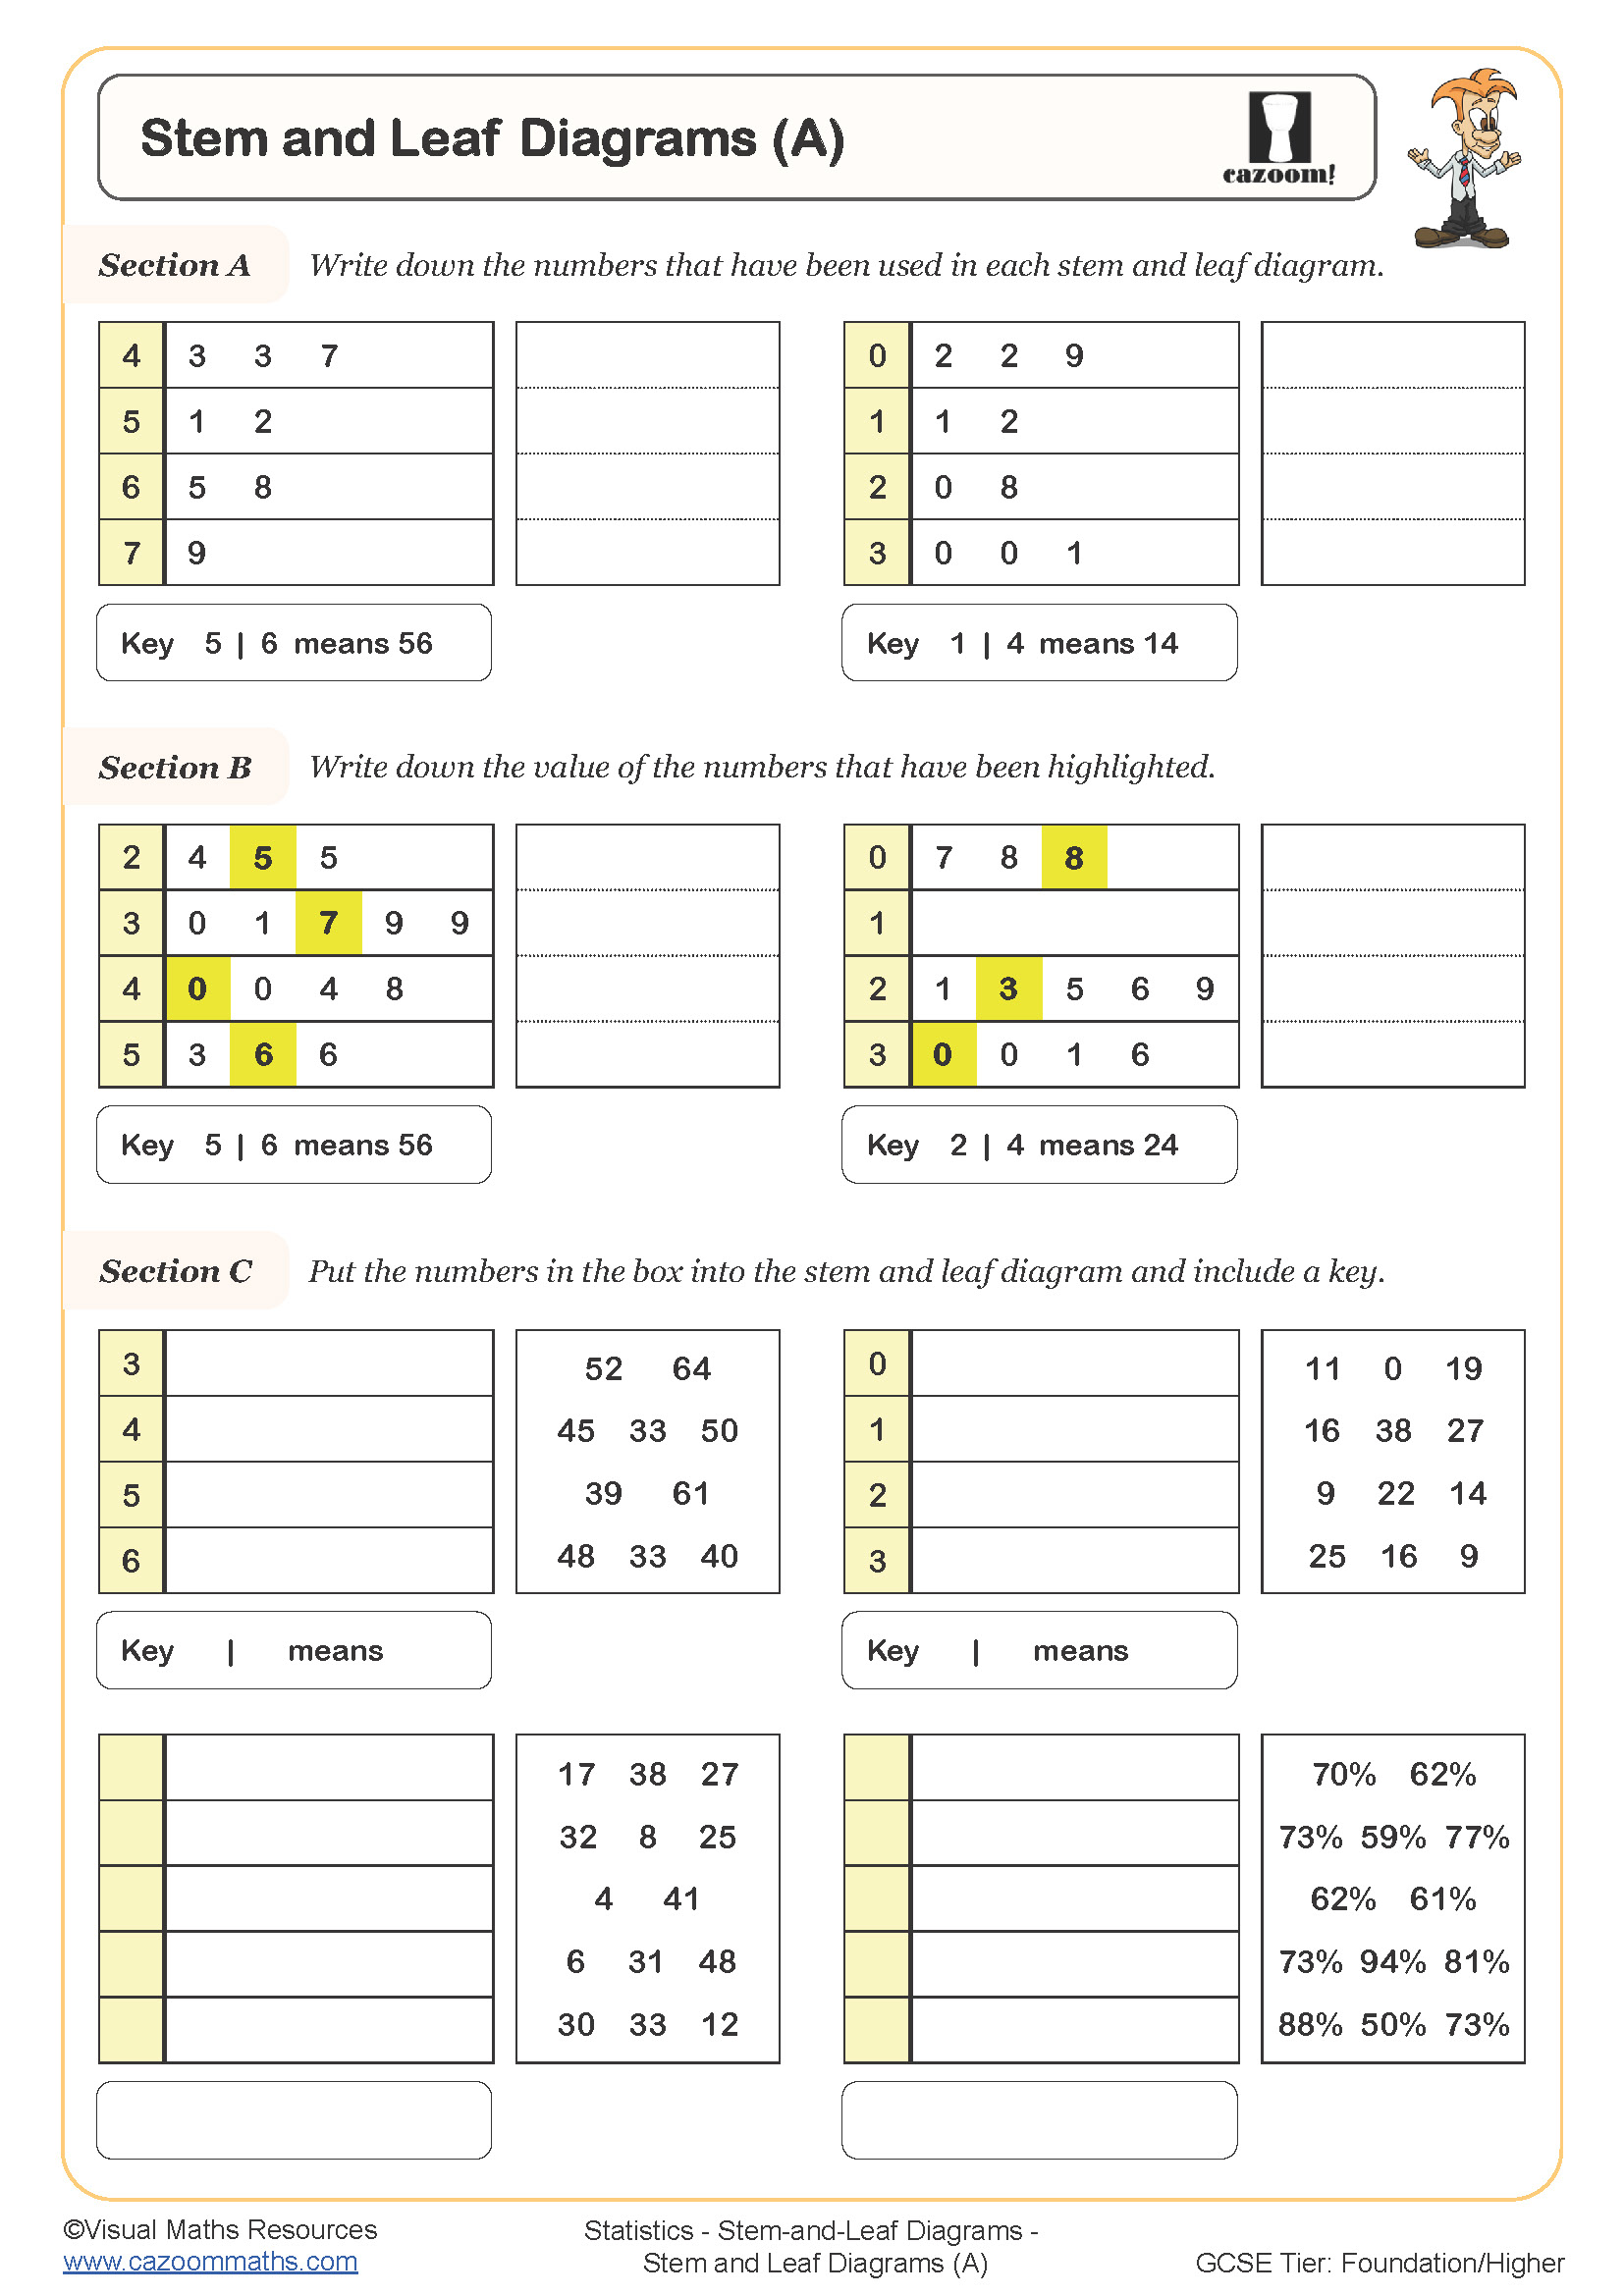
• Stem and Leaf Diagrams (A) Worksheet — introduces constructing basic diagrams from unordered data
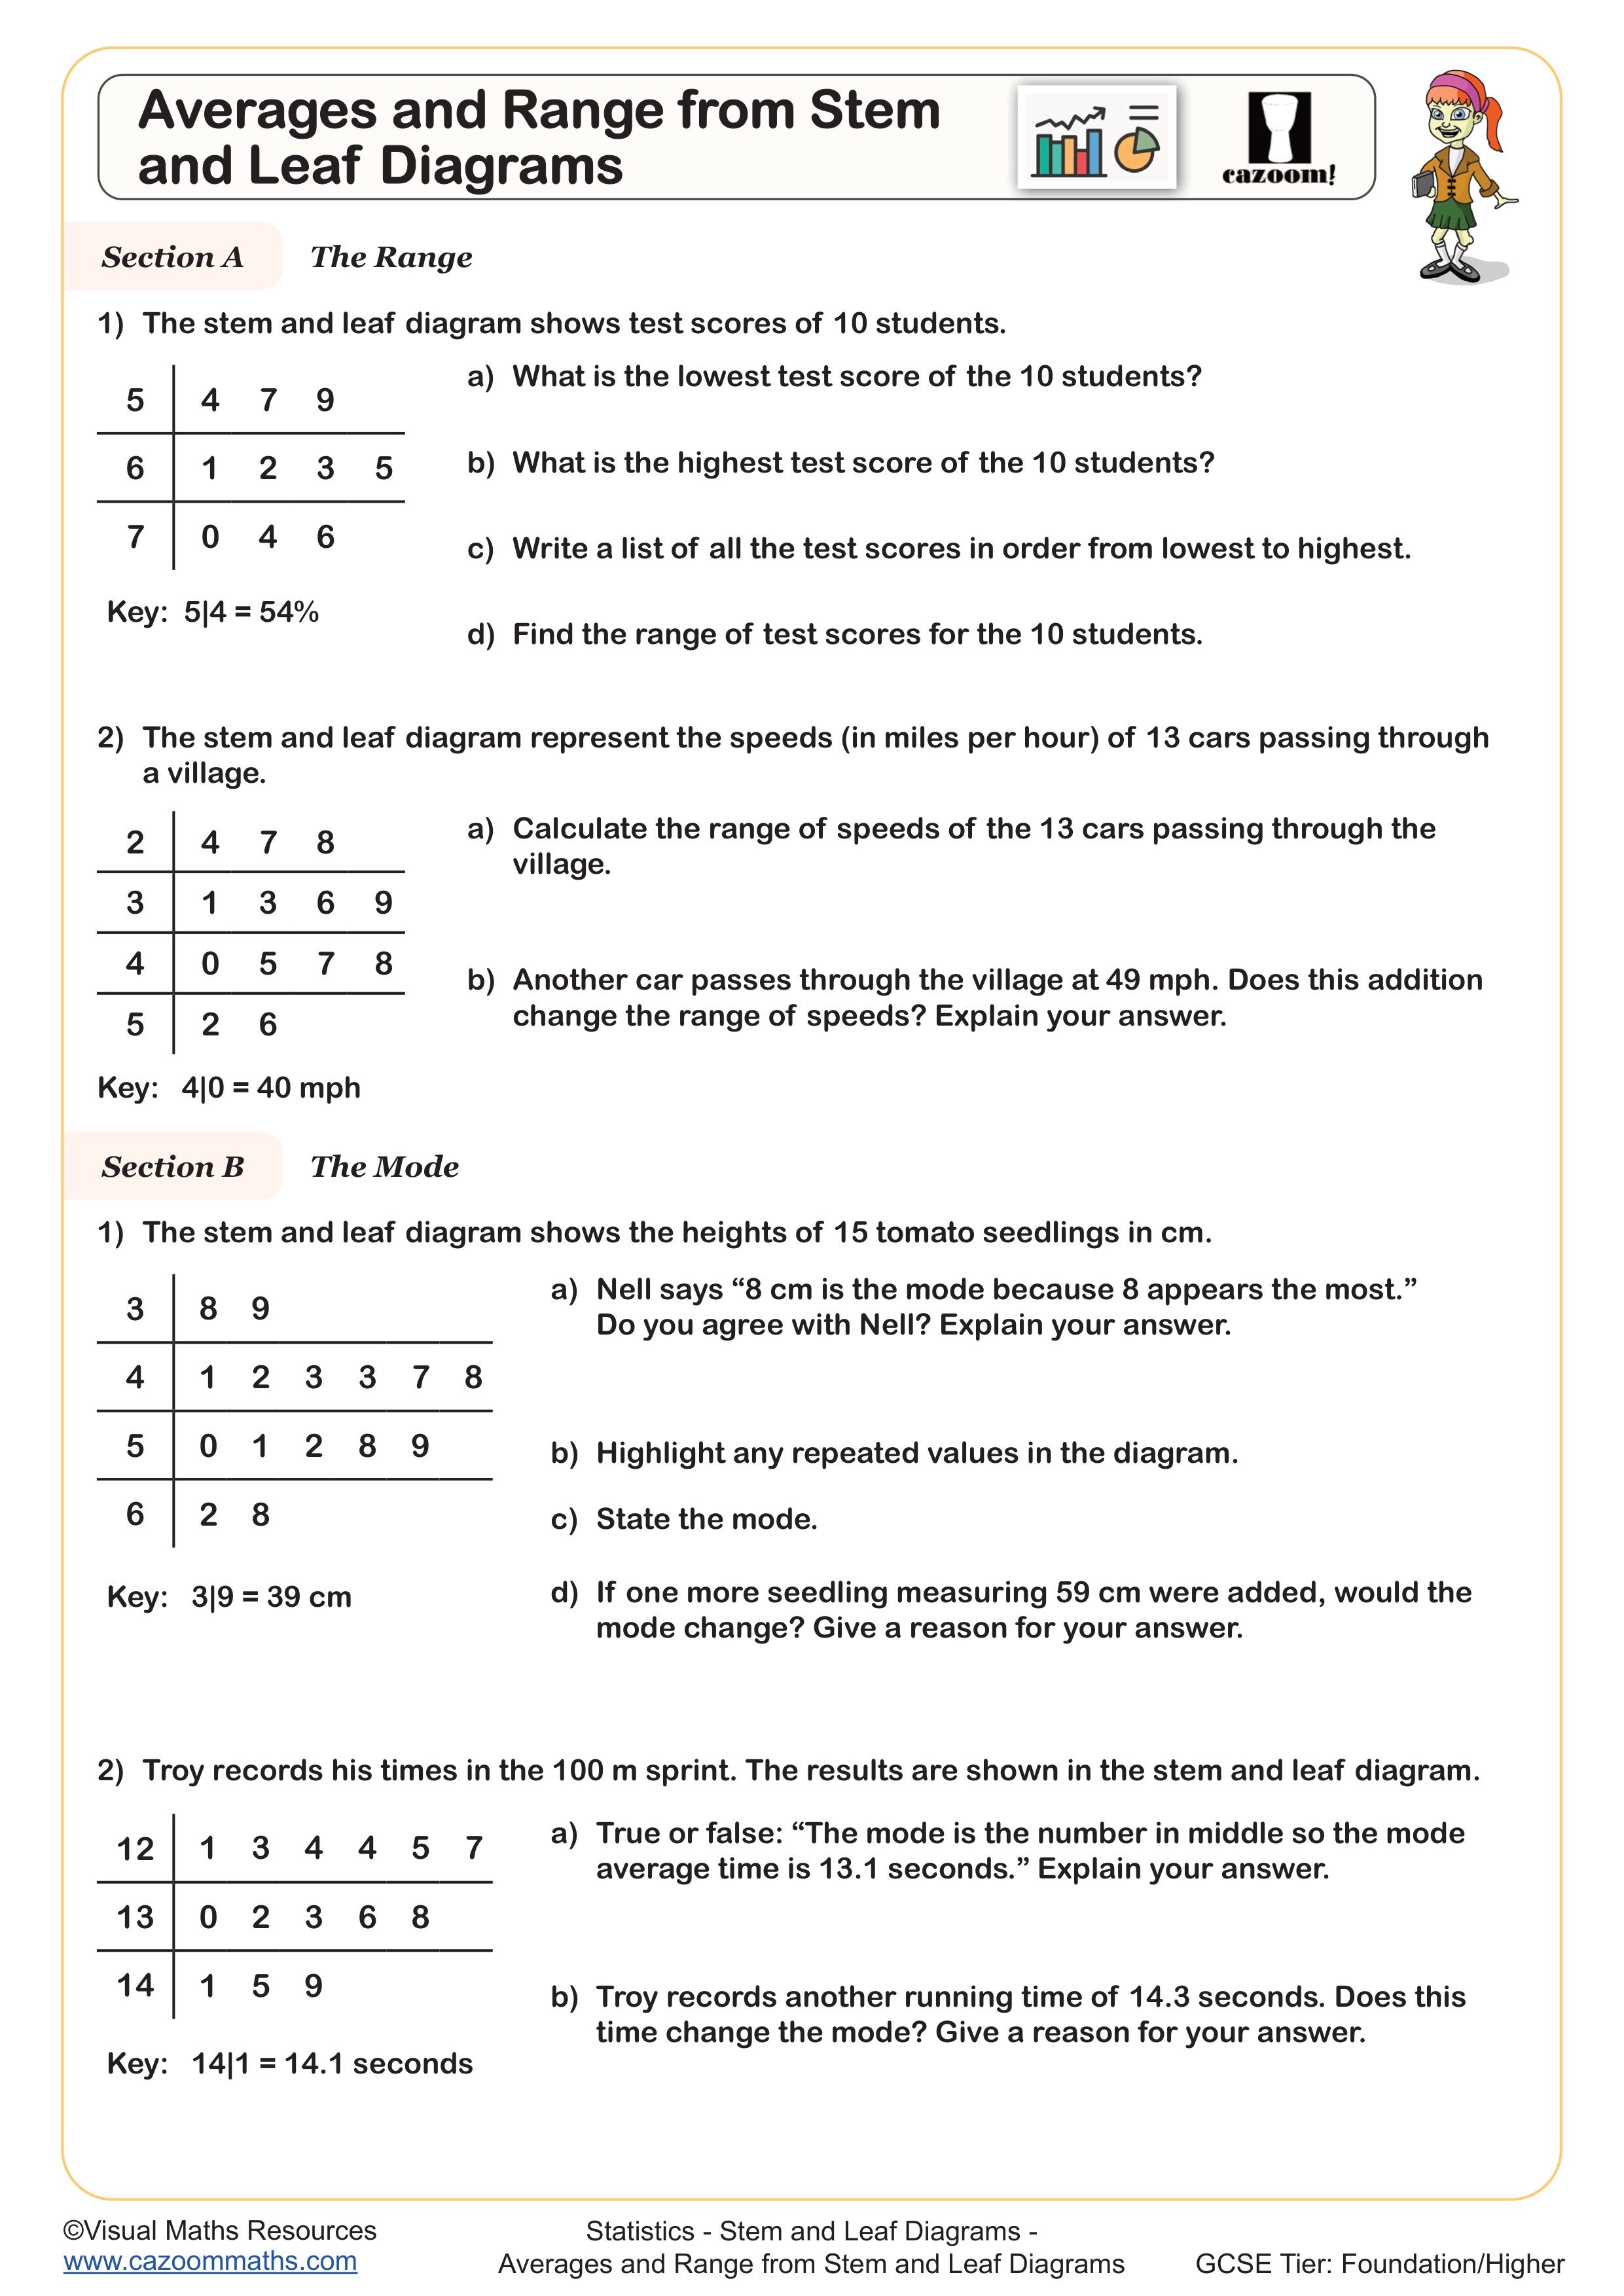
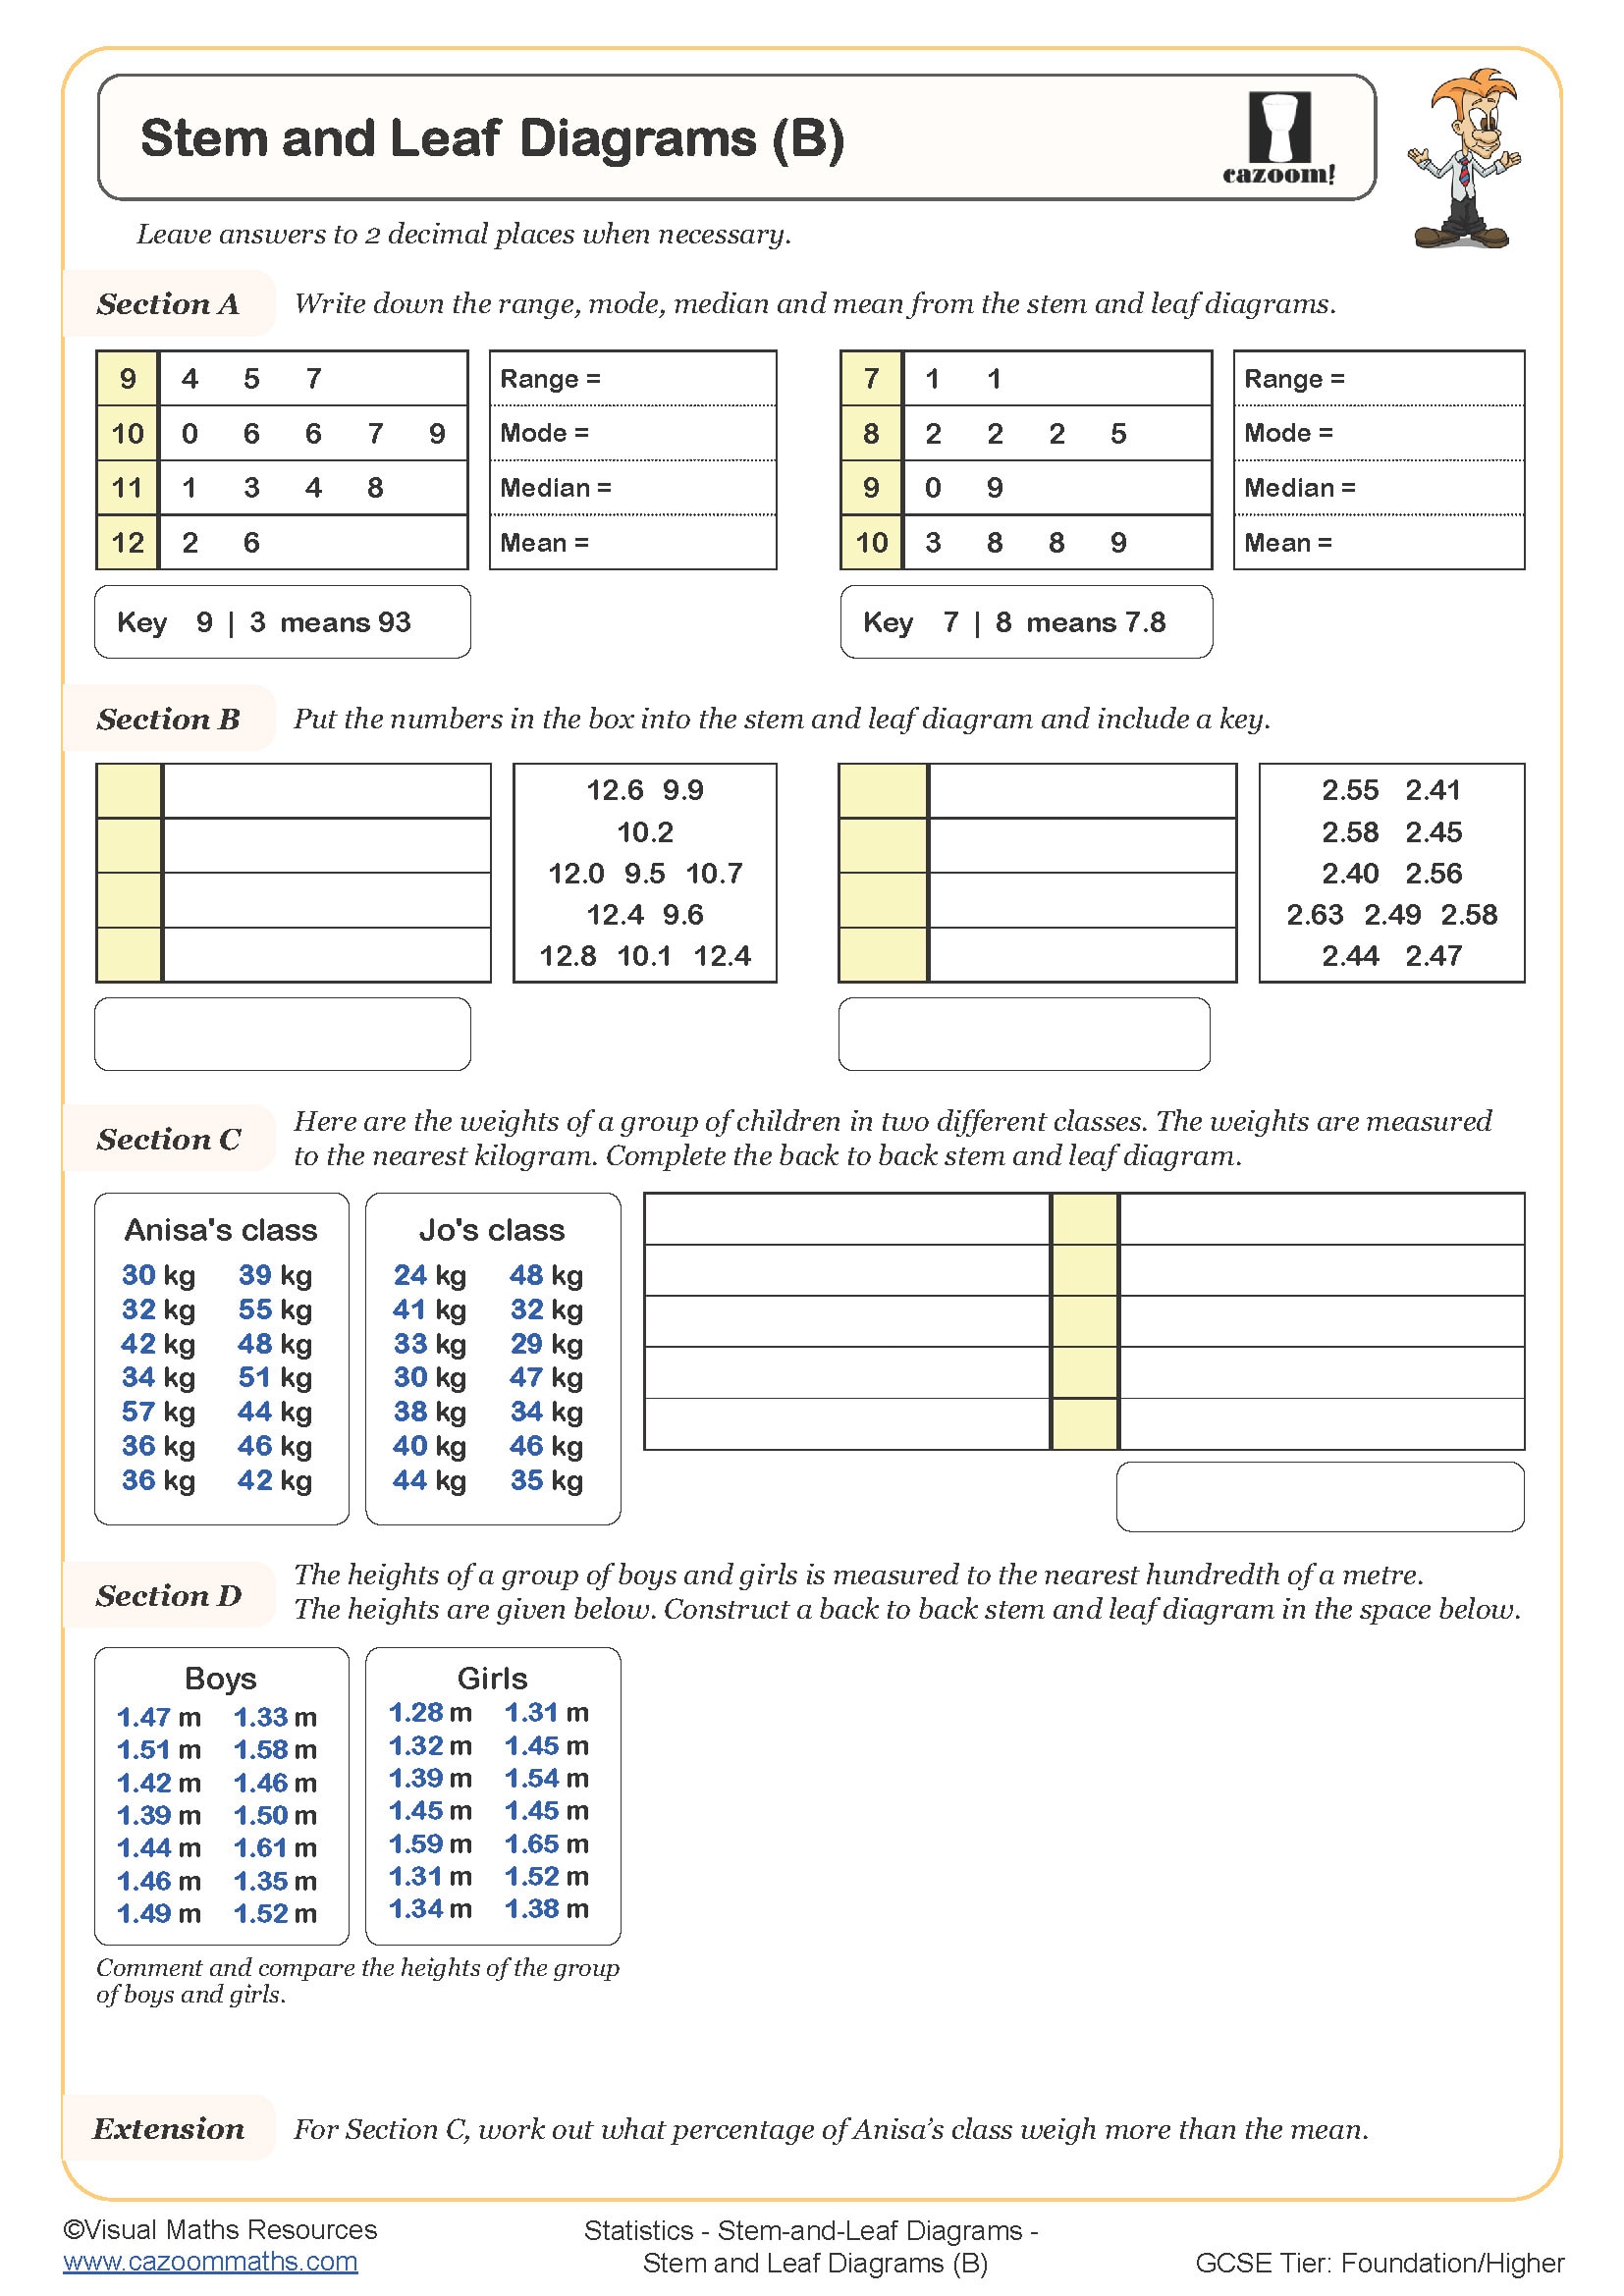
• Stem and Leaf Diagrams (B) Worksheet — advances to creating, reading and interpreting complex diagrams
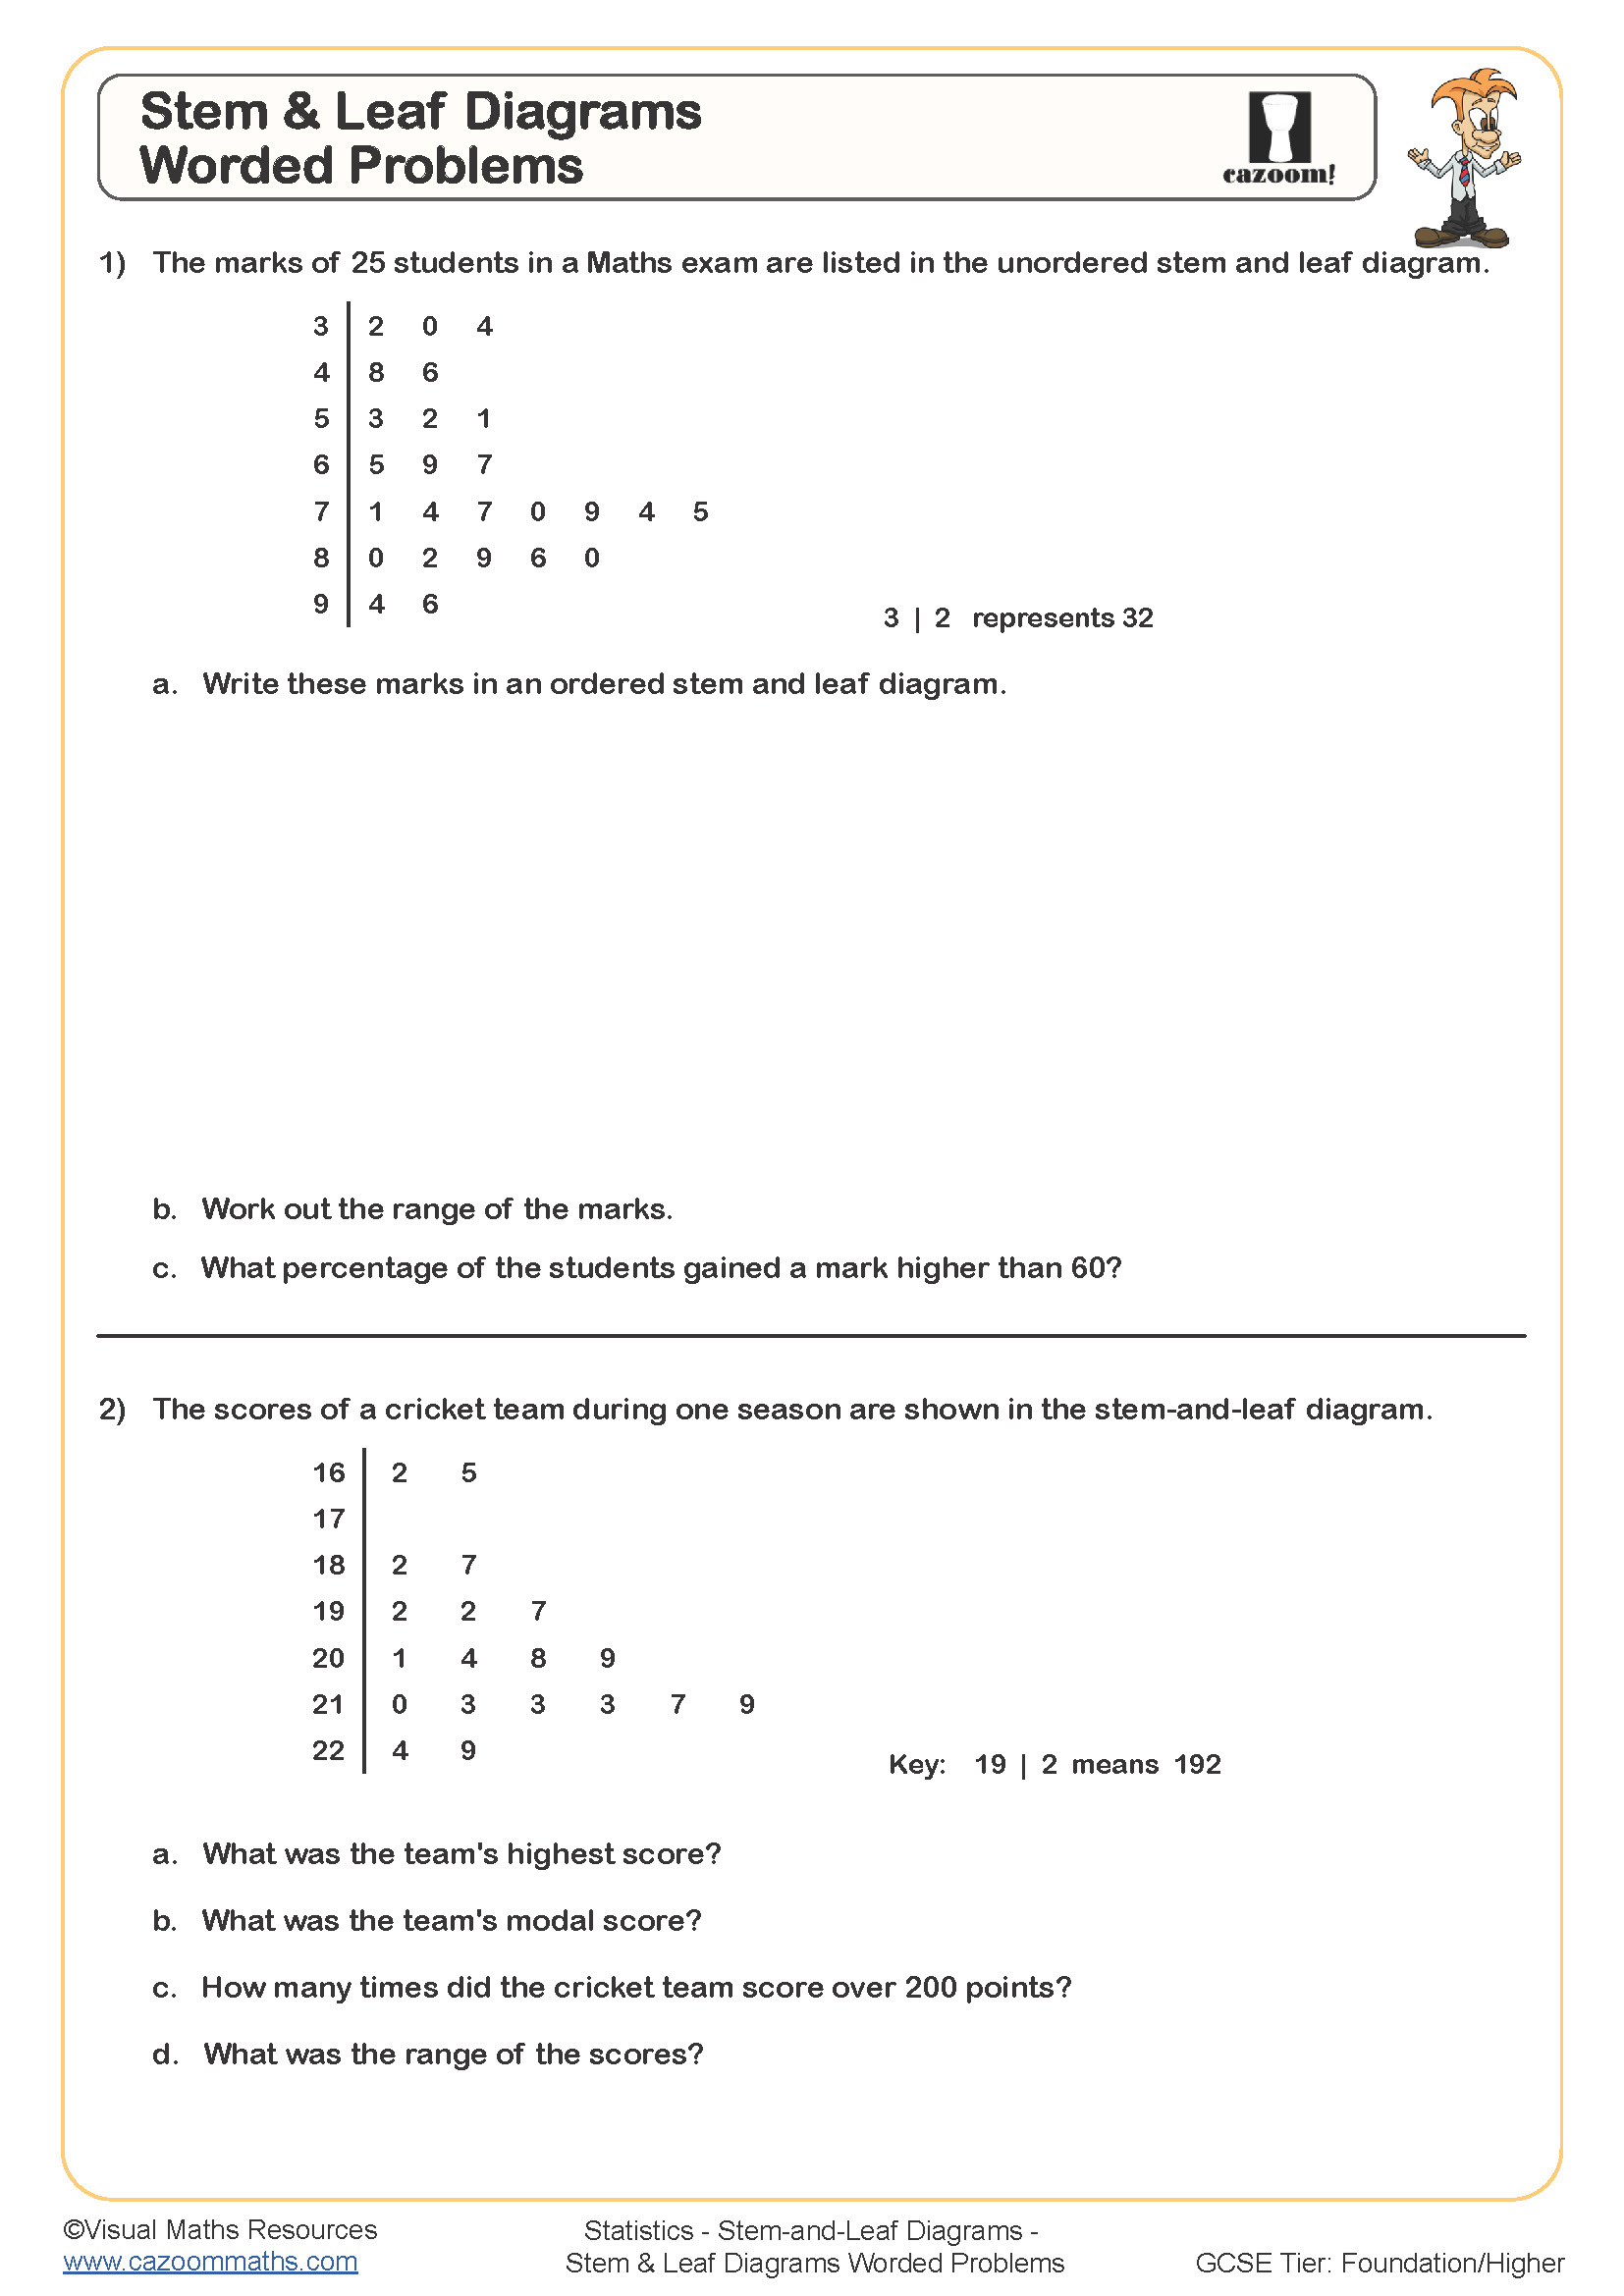
• Stem and Leaf Word Problems Worksheet — applies diagram skills to contextual problem-solving scenarios
• Stem and Leaf Diagrams Templates — provides structured formats for independent practice work
• Comparing Back-to-Back Stem and Leaf Diagrams — explores comparing two data sets simultaneously
Get Students Excited About Maths With Year 8 Stem and Leaf Diagram Worksheets
Created by experienced maths educators who understand classroom dynamics, these worksheets strike the perfect balance between challenge and accessibility. The differentiated approach enables students to participate actively with the content at their individual level, whether they need to build fundamental skills or advance to more complex analysis. Teachers can reduce their marking workload through the use of time-saving answer sheets while gaining valuable insights into students' mental processes through detailed analysis. The system enables precise targeting of learning needs through its clear progression of difficulty levels, eliminating the need for extensive preparation time.
From Science to Sports: Practical Applications of Stem and Leaf Analysis Skills
Understanding stem and leaf diagrams equips students with valuable data interpretation skills that extend far beyond the mathematics classroom.
• Sports performance tracking and athletic improvement analysis
• Weather pattern observation and climate data interpretation
• Scientific experiment results organisation and comparison
• Market research data presentation for business studies
• Population statistics analysis in geography projects
• Test score distributions for academic progress monitoring
• Manufacturing quality control data representation
• Time management analysis for productivity improvement