Year 9 Averages and Range Worksheets


All worksheets are created by the team of experienced teachers at Cazoom Maths.
What do students need to know about averages and range at Year 9?
By Year 9, students are working within the KS3 National Curriculum statistics strand and are expected to calculate and interpret mean, median, mode and range, including from grouped and ungrouped frequency tables. They should also be able to compare two data sets using averages and spread, which is a step beyond simply finding a single measure. This comparison skill is where many students lose marks, because they calculate correctly but then fail to interpret what the values actually tell them about the data.
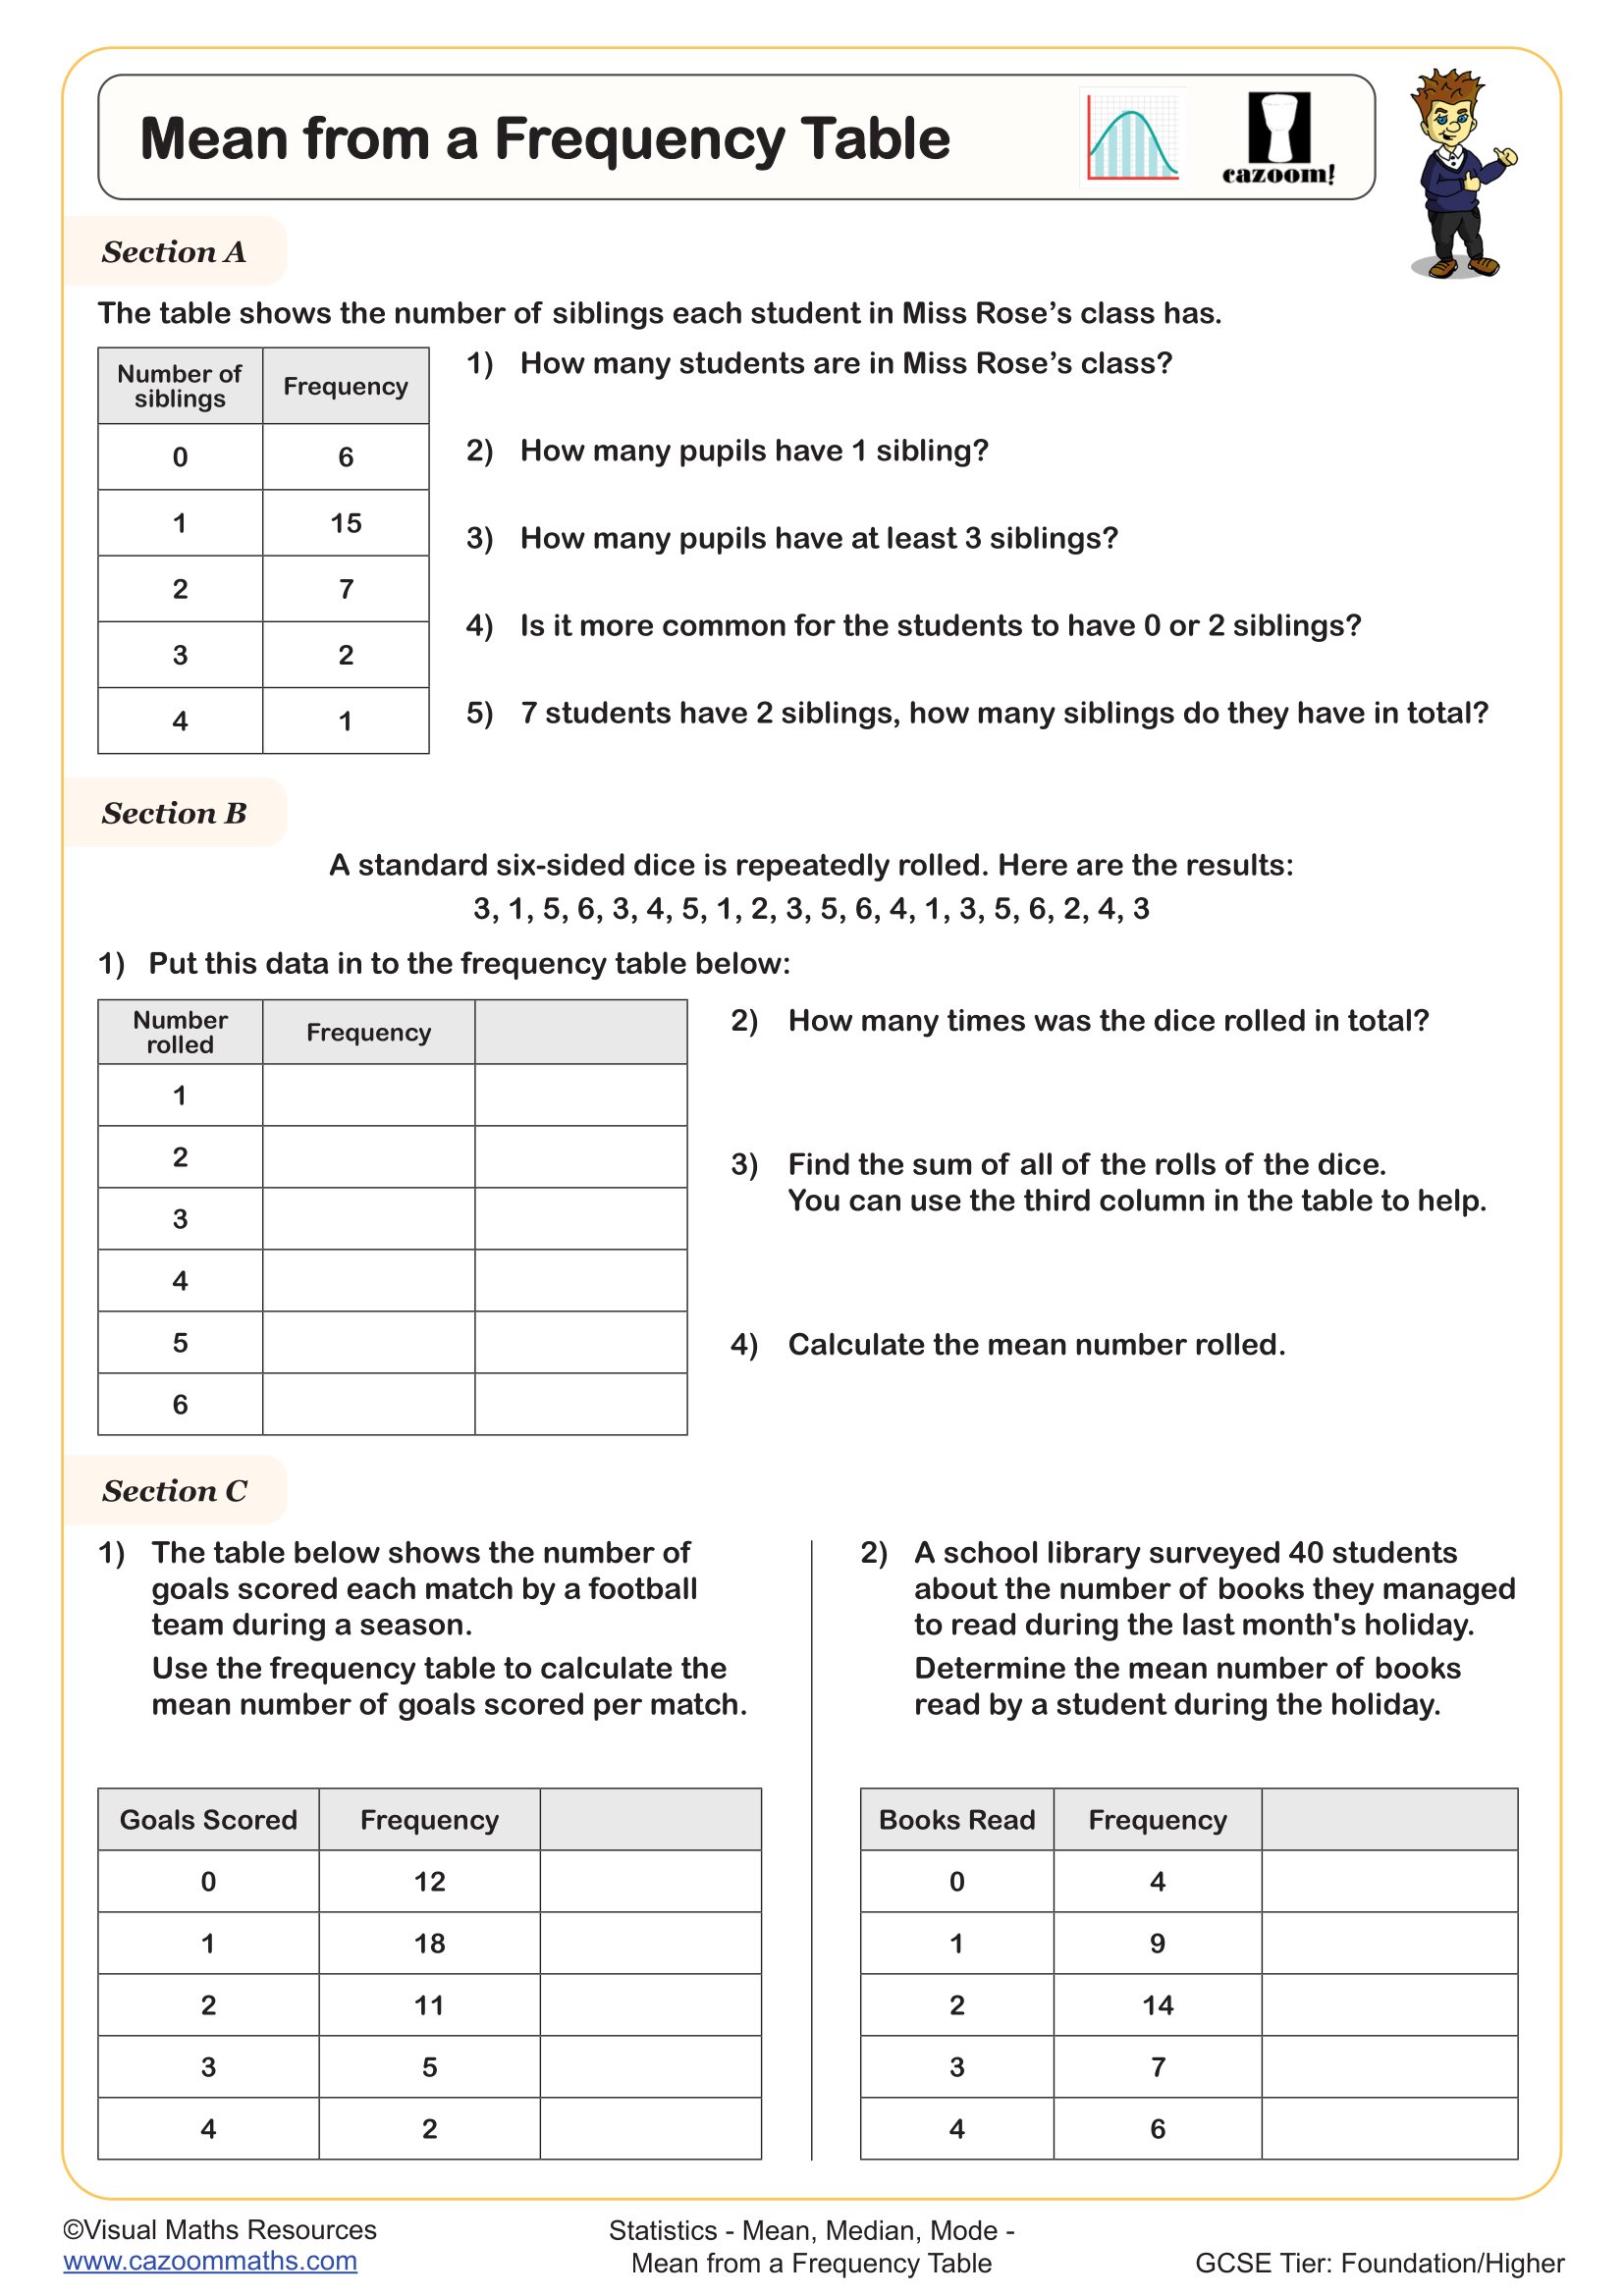
A useful example: when comparing two football teams' scores, a student might correctly identify that both teams have the same mean, but miss that one team has a much larger range, indicating less consistent performance. Recognising that range describes spread rather than average is a distinction worth reinforcing explicitly.
Which year groups are these averages and range worksheets suitable for?
These worksheets are written for Year 9 students, sitting within the upper KS3 phase where statistical reasoning becomes more nuanced. At this stage, students are expected to move beyond basic average calculations they first encountered in Years 5 and 6, and refine the more formal methods introduced in Years 7 and 8, particularly around frequency tables and interpreting results in context.
The difficulty within this Year 9 collection progresses from finding averages from raw data sets, through ungrouped frequency tables, and into grouped frequency tables where students must estimate the mean using midpoints. This final step is a notable jump in difficulty. Teachers frequently notice that students who are confident with listed data struggle to adapt their method when data is presented in grouped form, so the staged progression across the worksheets helps bridge that gap.
How do students calculate the mean from a grouped frequency table?
Calculating the mean from a grouped frequency table requires students to identify the midpoint of each class interval, multiply it by the corresponding frequency, sum those products, and then divide by the total frequency. This gives an estimated mean rather than an exact one, because the original raw data is no longer visible. Students often make errors at the midpoint stage, either selecting the lower boundary instead of the midpoint, or forgetting to multiply before adding.
This skill has direct relevance in STEM contexts. Scientists and engineers routinely work with grouped data when exact measurements aren't recorded individually, for instance when analysing the distribution of component sizes on a production line or processing survey response data. Understanding that a mean can be estimated from grouped data, and knowing its limitations, is genuinely useful statistical thinking beyond the classroom.
How can teachers use these worksheets effectively in the classroom?
The worksheets are structured to support progressive learning rather than simply providing repetition. Earlier questions within each sheet tend to present data in straightforward formats, while later questions introduce frequency tables or require students to interpret and compare results. This makes them suitable for mixed-ability classes where all students can access the opening questions while more confident learners are still challenged towards the end.
Practically, the worksheets work well as consolidation tasks following direct instruction, as homework with the answer sheets sent separately, or as revision material ahead of end-of-unit assessments. For intervention work, pairing a student who confuses median and mean with a peer who can articulate the difference often produces a breakthrough more quickly than re-teaching alone. The included answer sheets also allow students to self-mark, which builds metacognitive habits around identifying and correcting their own errors.