Year 9 Cumulative Frequency and Box Plots Worksheets
All worksheets are created by the team of experienced teachers at Cazoom Maths.
Achieve Better Accuracy With Our Printable PDF Year 9 Cumulative Frequency and Box Plots Worksheets
Year 9 students achieve a major advancement in statistical reasoning through their development of competence with cumulative frequency and box plots. The visual tools display data patterns that cannot be seen in basic data tables, helping students identify trends, distribution shapes, and outliers that average values may not reveal. The process of transitioning from single statistical calculations to comprehensive dataset analysis enables students to develop essential critical thinking skills, which are crucial for scientific and social science research. Students learn about quartiles, which enable them to understand how to divide populations into useful sections that aid in hypothesis testing and research methods. The practice of these concepts leads to better graph literacy skills while teaching students the standard mathematical notation, which A-level mathematics requires.
Specific learning benefits include:
• The process of learning to calculate quartiles from unprocessed data needs direct teaching methods.
• Reading statistical information from graphs accurately
• Comparing multiple datasets visually
• Understanding data spread and distribution patterns
• The evaluation of distribution symmetry versus skewness needs a detailed examination.
• Linking algebraic skills to graphical interpretation
• Developing Systematic Problem-Solving Approaches
Essential KS3 Statistics Topics: From Tables to Visual Analysis
These comprehensive worksheets guide students through the complete journey from concrete data tables to pictorial representations and finally to abstract statistical interpretation. Starting with fundamental concepts, learners progressively build skills in constructing cumulative frequency tables, plotting curves, extracting key values, and creating meaningful visual summaries. The collection includes detailed worked solutions that reveal the mathematical reasoning behind each step, helping students understand not just what to calculate but why each method works.
The worksheets in this collection include:
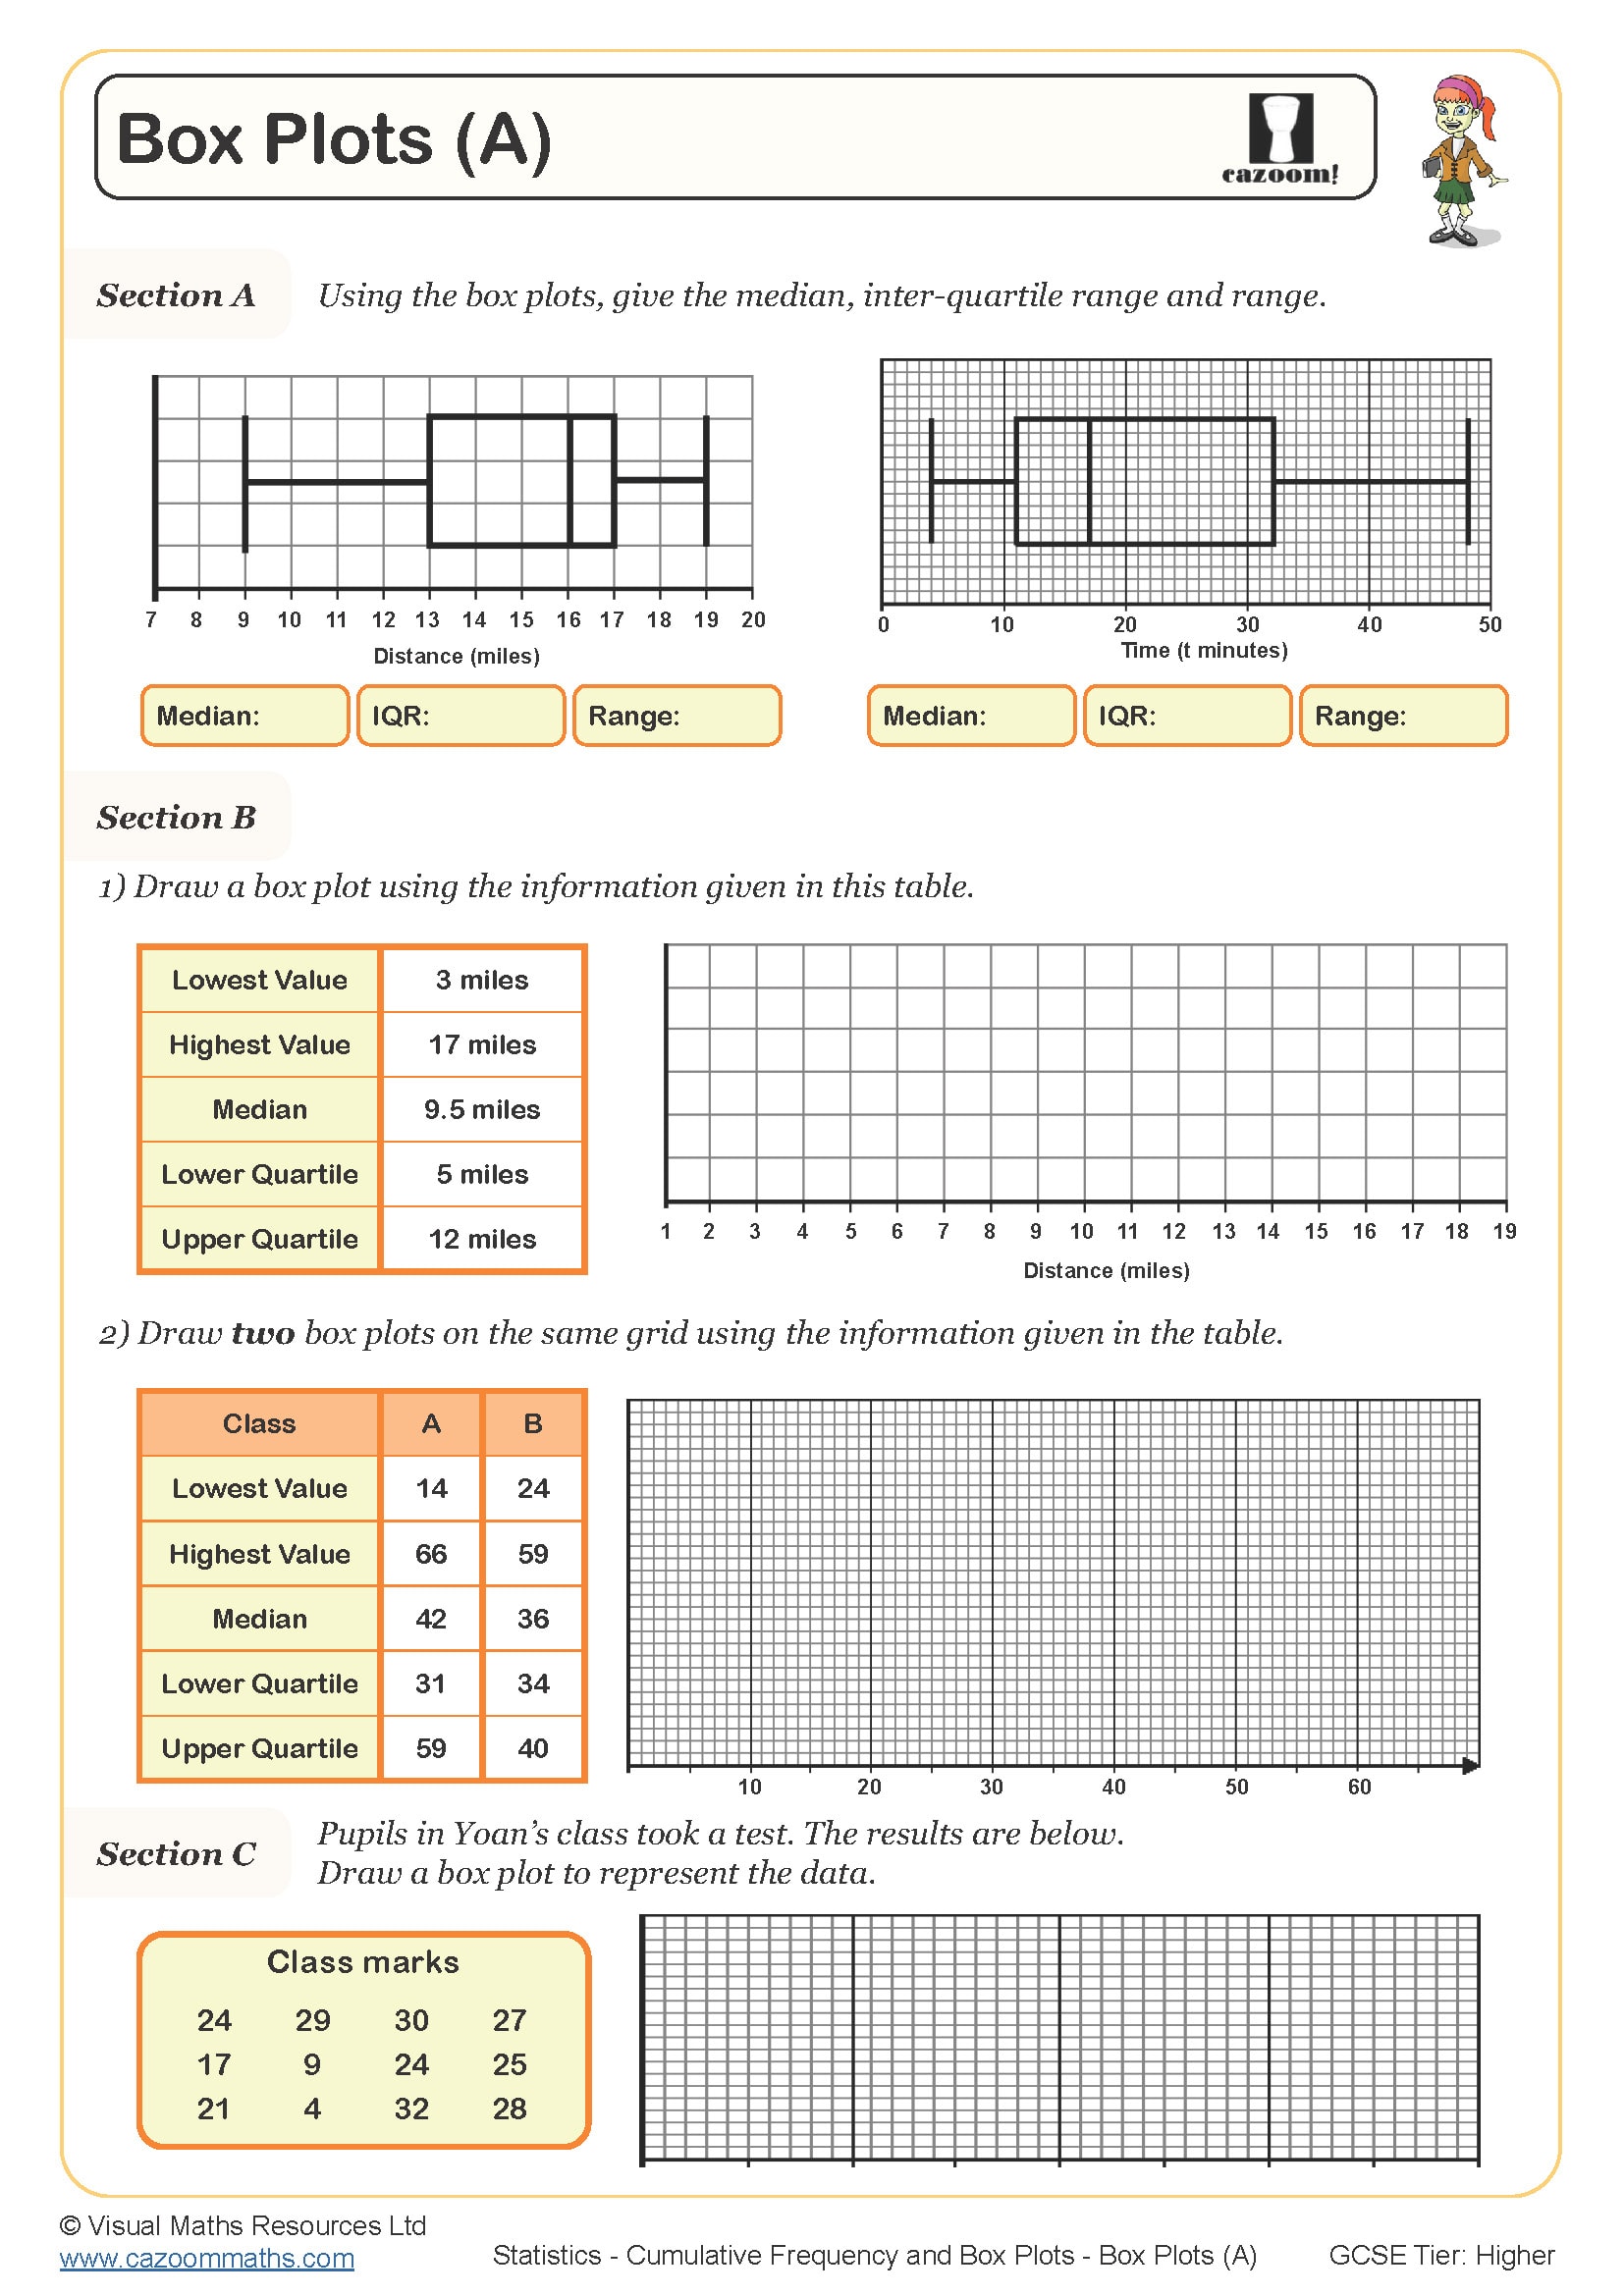
• Box Plots (A) — introduces the five-number summary and basic construction techniques
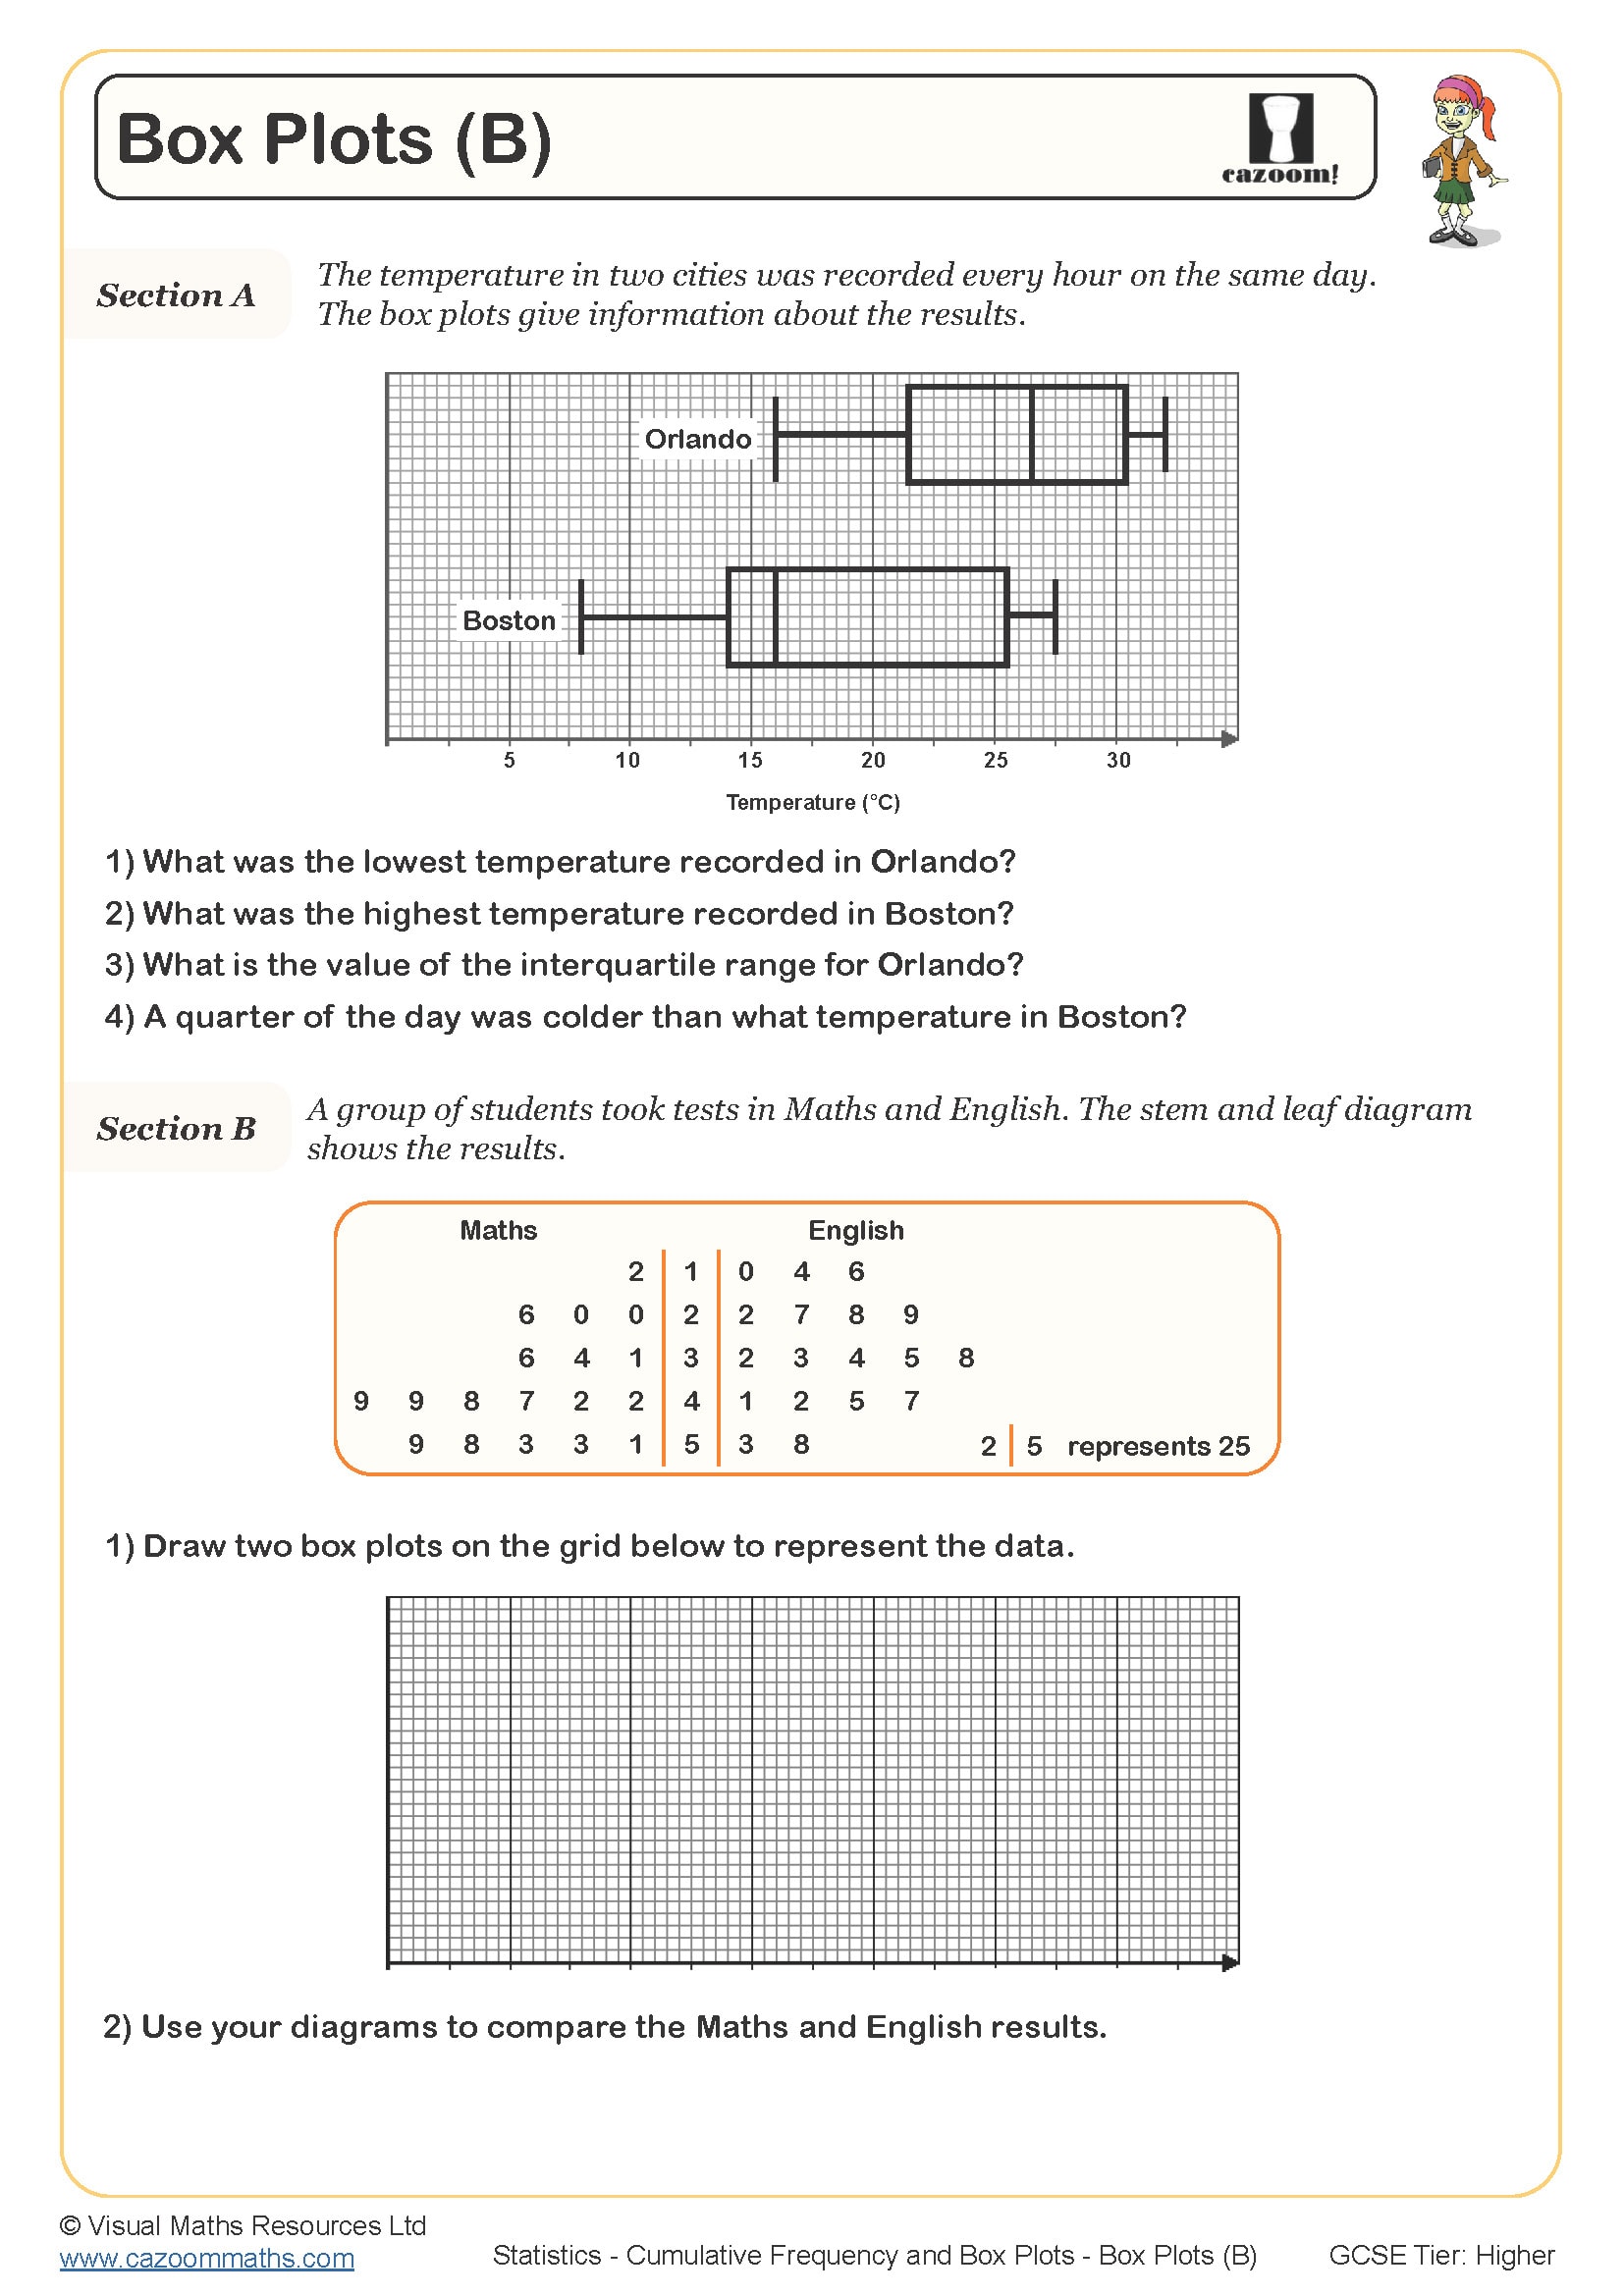
• Box Plots (B) — advances to comparing distributions and identifying outliers
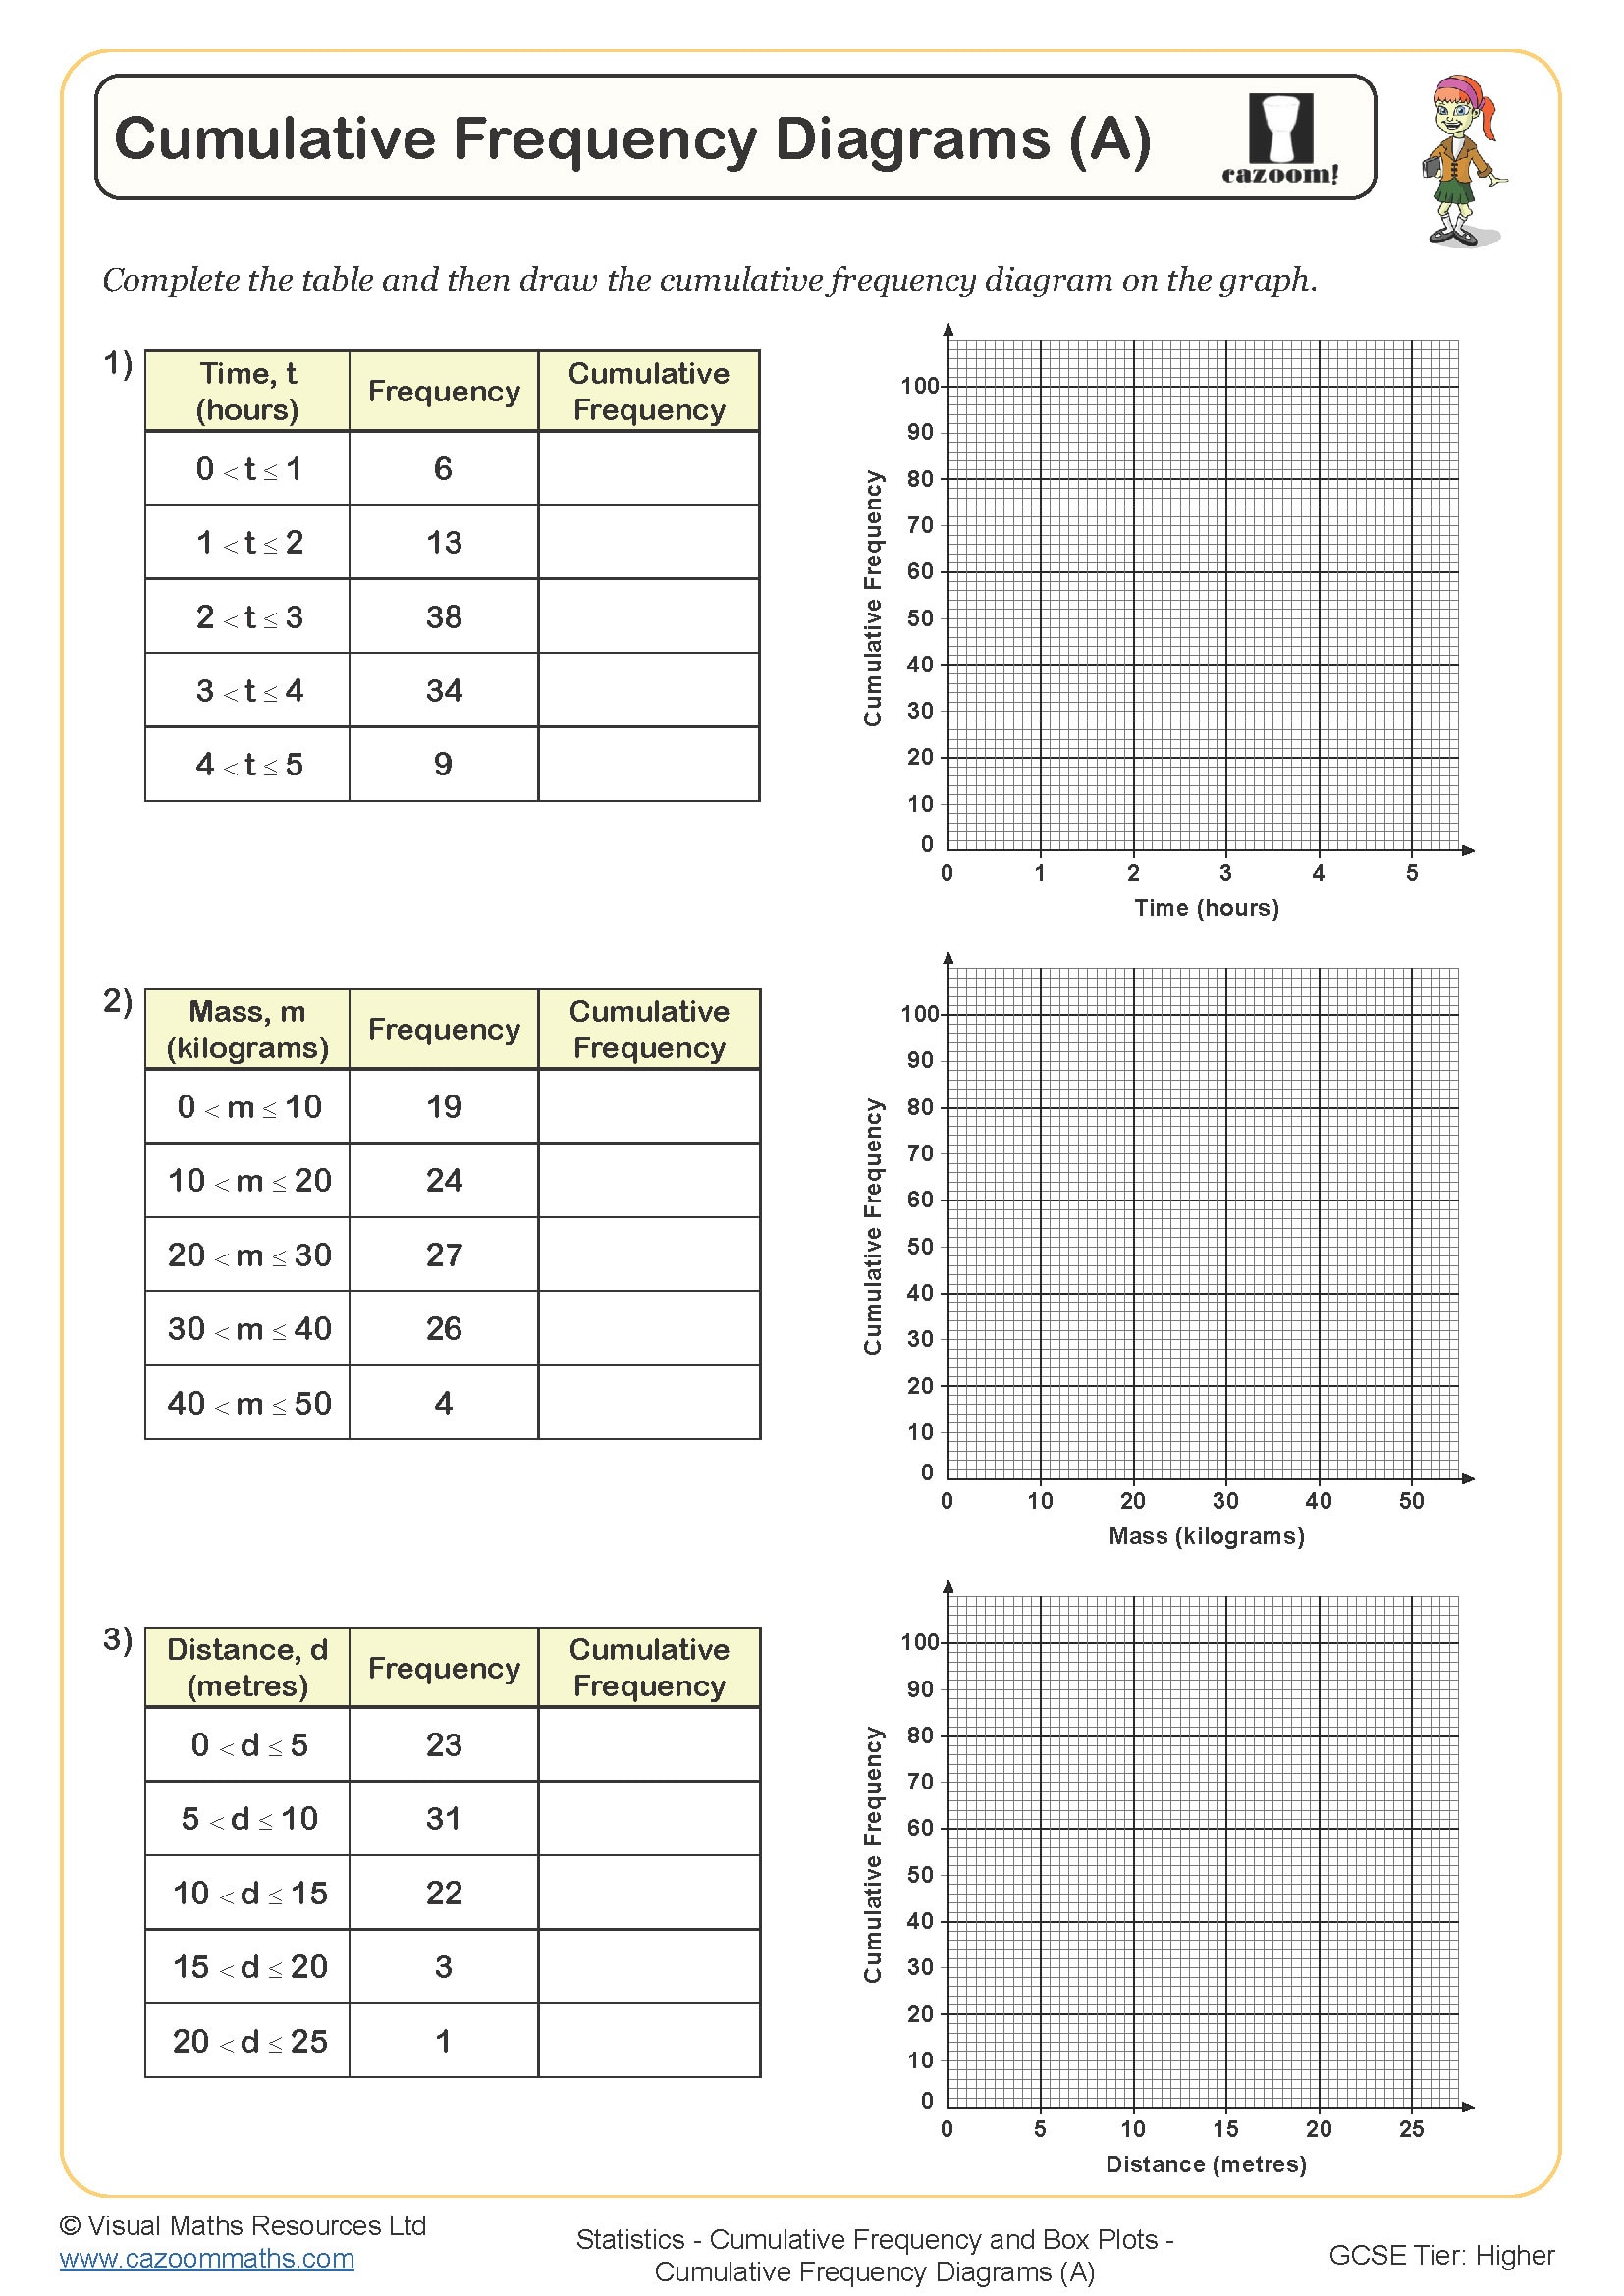
• Cumulative Frequency Diagrams (A) — teaches plotting curves from grouped frequency tables
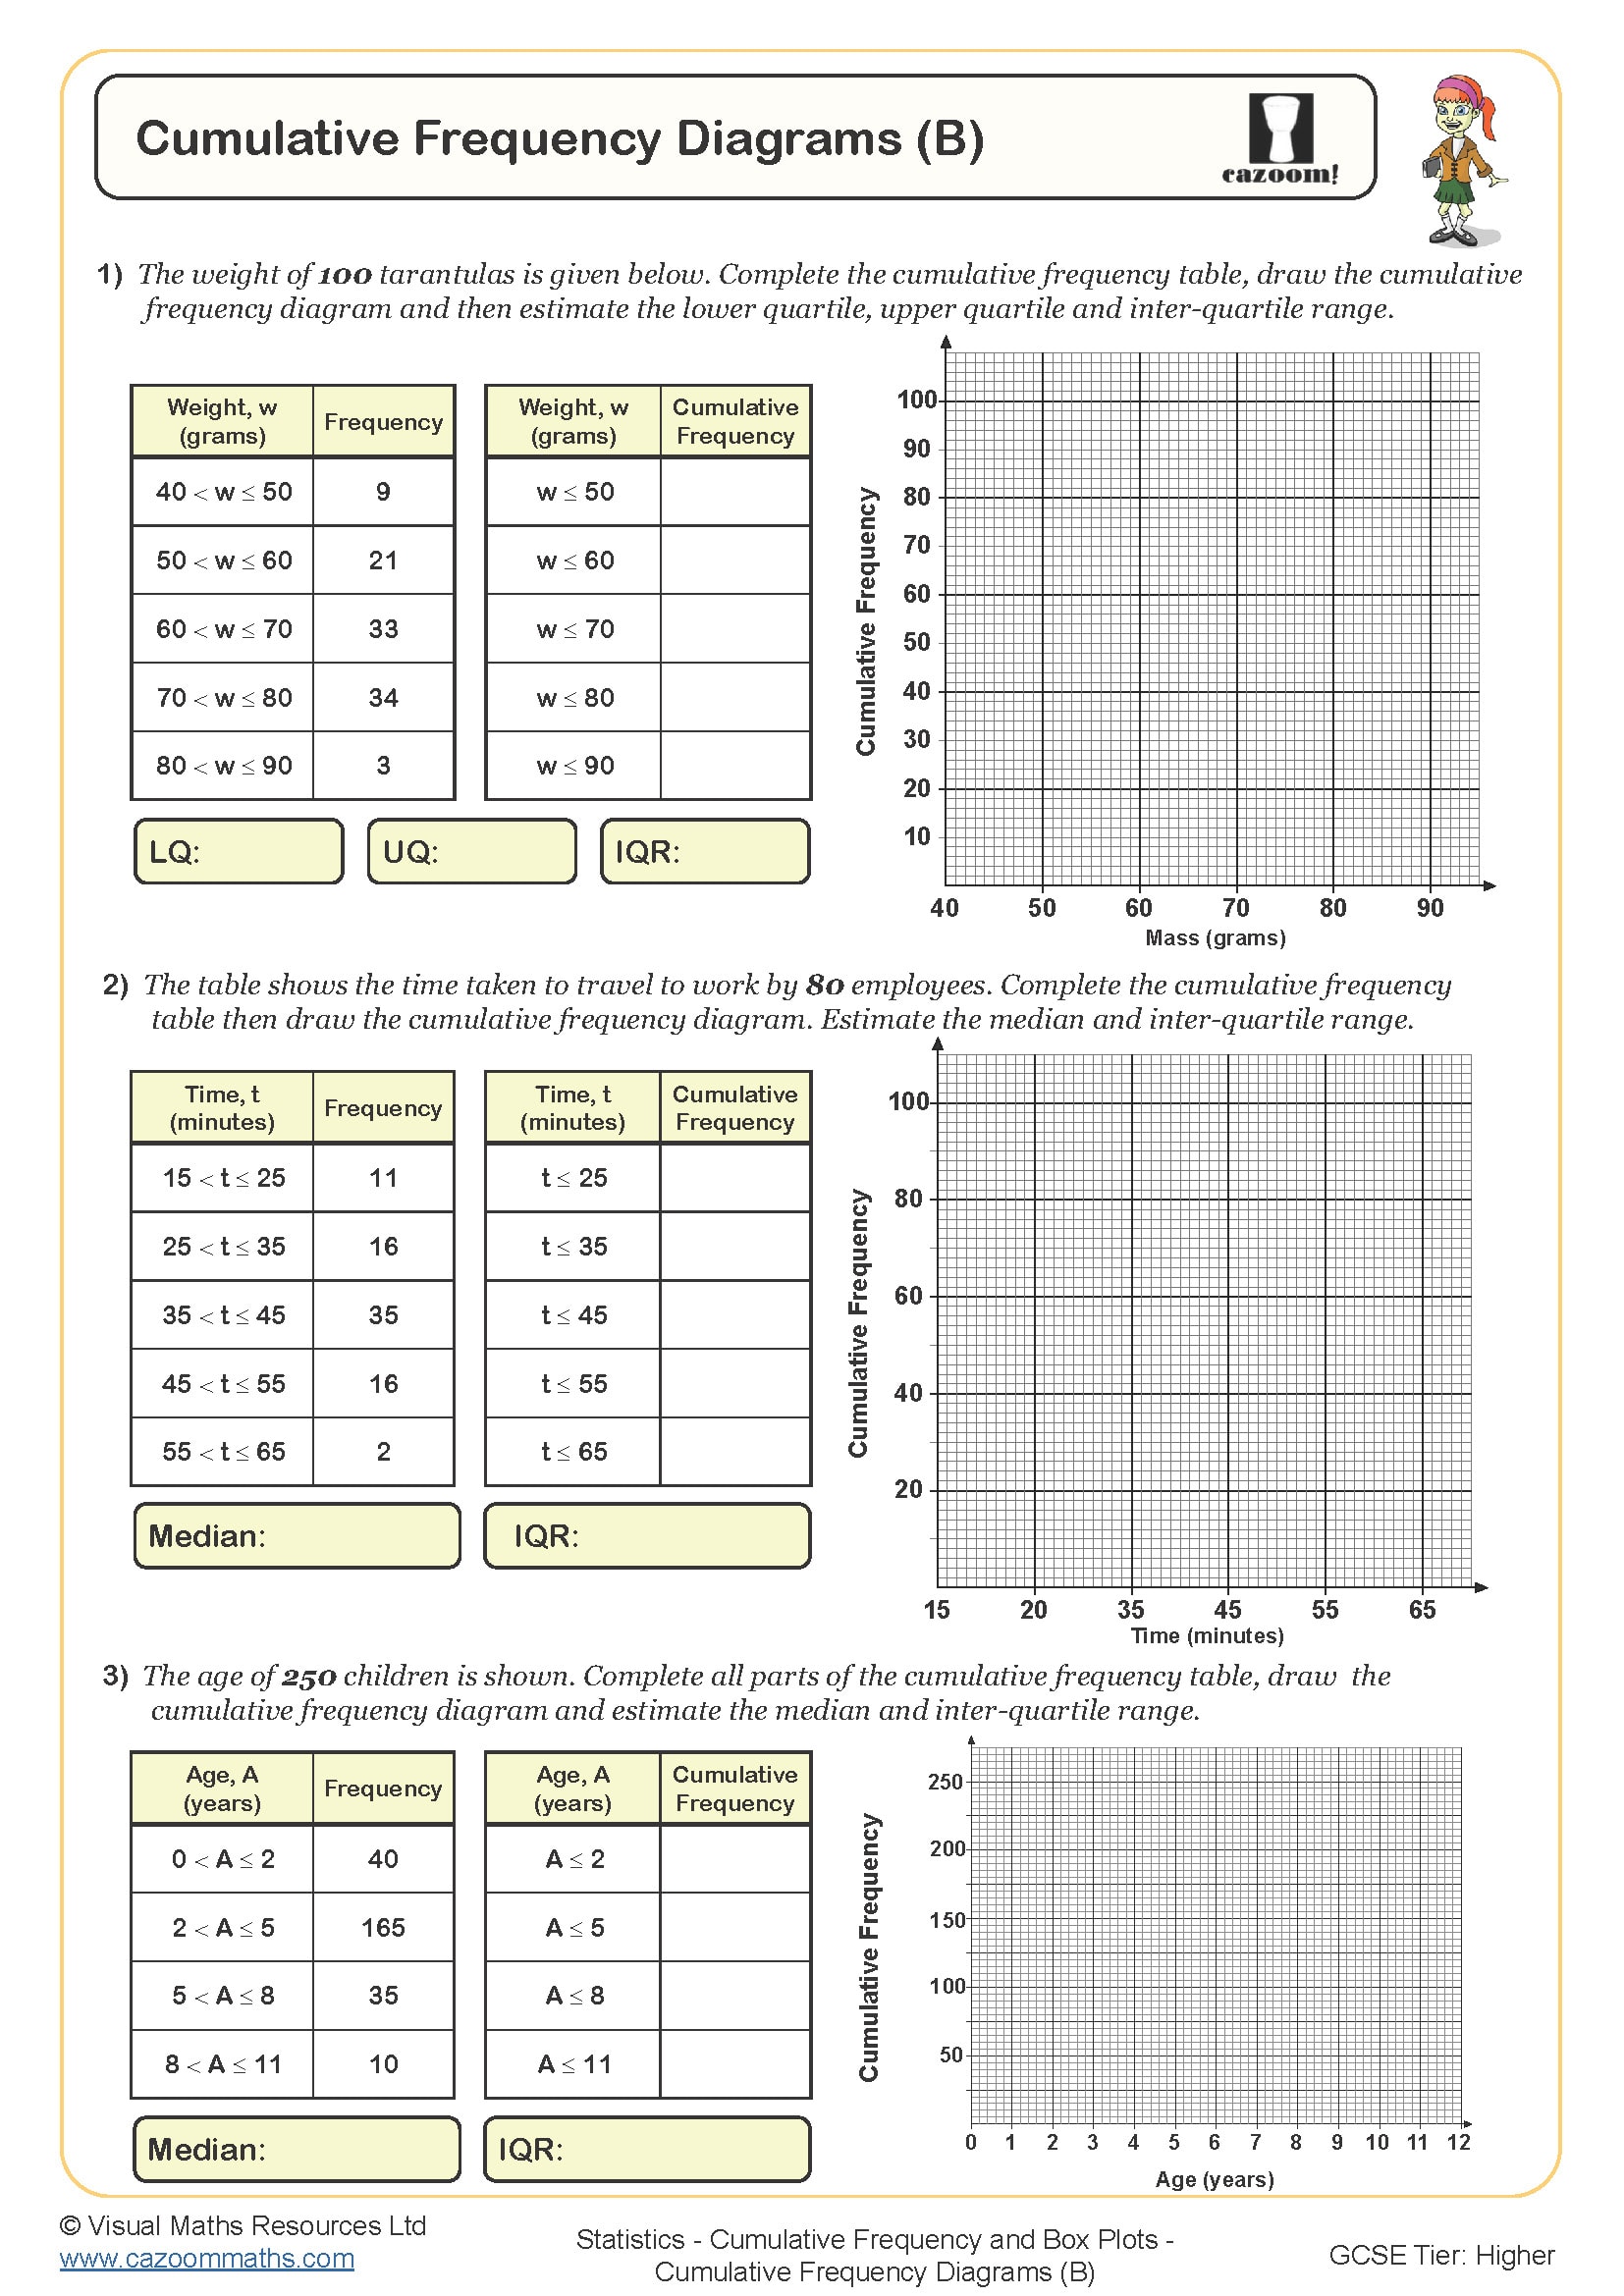
• Cumulative Frequency Diagrams (B) — explores reading values and finding quartiles from graphs
• Drawing Box Plots — practice constructing diagrams from given statistical measures
• Drawing Box Plots from Cumulative Frequency Diagrams — links two representation methods together seamlessly
• Interpreting Box Plots — develops analysis skills for comparing data spreads
• Interquartile Range — focuses on calculating and understanding measures of spread
Why Parents and Teachers Trust Year 9 Cumulative Frequency and Box Plots Worksheets for Homework Support
The worksheets maintain an appropriate level of complexity, which makes them suitable for modern educational settings. Teachers can use the graduated difficulty levels to create effective differentiation because they provide starting points for students who need help while extending the material for students who are ready for more challenging content. The implementation of clear formatting in instructions helps students decrease their mental workload because it lets them focus on math concepts rather than deciphering the instructions. The materials serve educators who work under time pressure because they are ready to use and simple to add to their existing lesson plans. The complete working out in answer keys enables students to use peer assessment and self-marking for independent learning. The practice sessions stay engaging because students avoid routine through various question types, yet the steady format enables them to build effective study practices.
Statistical Skills at Work: Real-World Applications Beyond the Classroom
Understanding cumulative frequency and box plots equips students with analytical tools used across countless professional fields. These visualisation techniques help professionals make informed decisions based on complex data patterns, turning numbers into actionable insights.
• Manufacturing companies track product measurements to ensure consistent quality standards.
• Weather services analyse rainfall patterns to predict flooding risks
• Sports analysts compare player performance statistics across seasons
• Healthcare researchers examine patient recovery times for different treatments
• Market researchers interpret consumer spending distributions
• Environmental scientists monitor pollution levels across regions
• Gaming companies analyse player engagement metrics
• Educational assessment boards standardise exam results using quartile boundaries