Year 10 Statistics Worksheets

All worksheets are created by the team of experienced teachers at Cazoom Maths.
Printable PDF Statistics Worksheets with Comprehensive Answer Sheets
All of our Year 10 statistics worksheets come as downloadable PDFs with separate detailed answer sheets. Download these premium, ready-to-use, printable resources right away to initiate an engaging learning process. Teachers save valuable marking time whilst students can self-assess their progress using our step-by-step worked solutions. Our clear layout makes printing easy for classroom sets or individual use, perfect for homework, cover lessons, or targeted revision sessions.
What's Included in These Year 10 Statistics Worksheets
Our comprehensive collection covers all essential statistics topics for Year 10 students:
• Data Collection and Sampling - Primary and secondary data, sampling methods, and bias identification
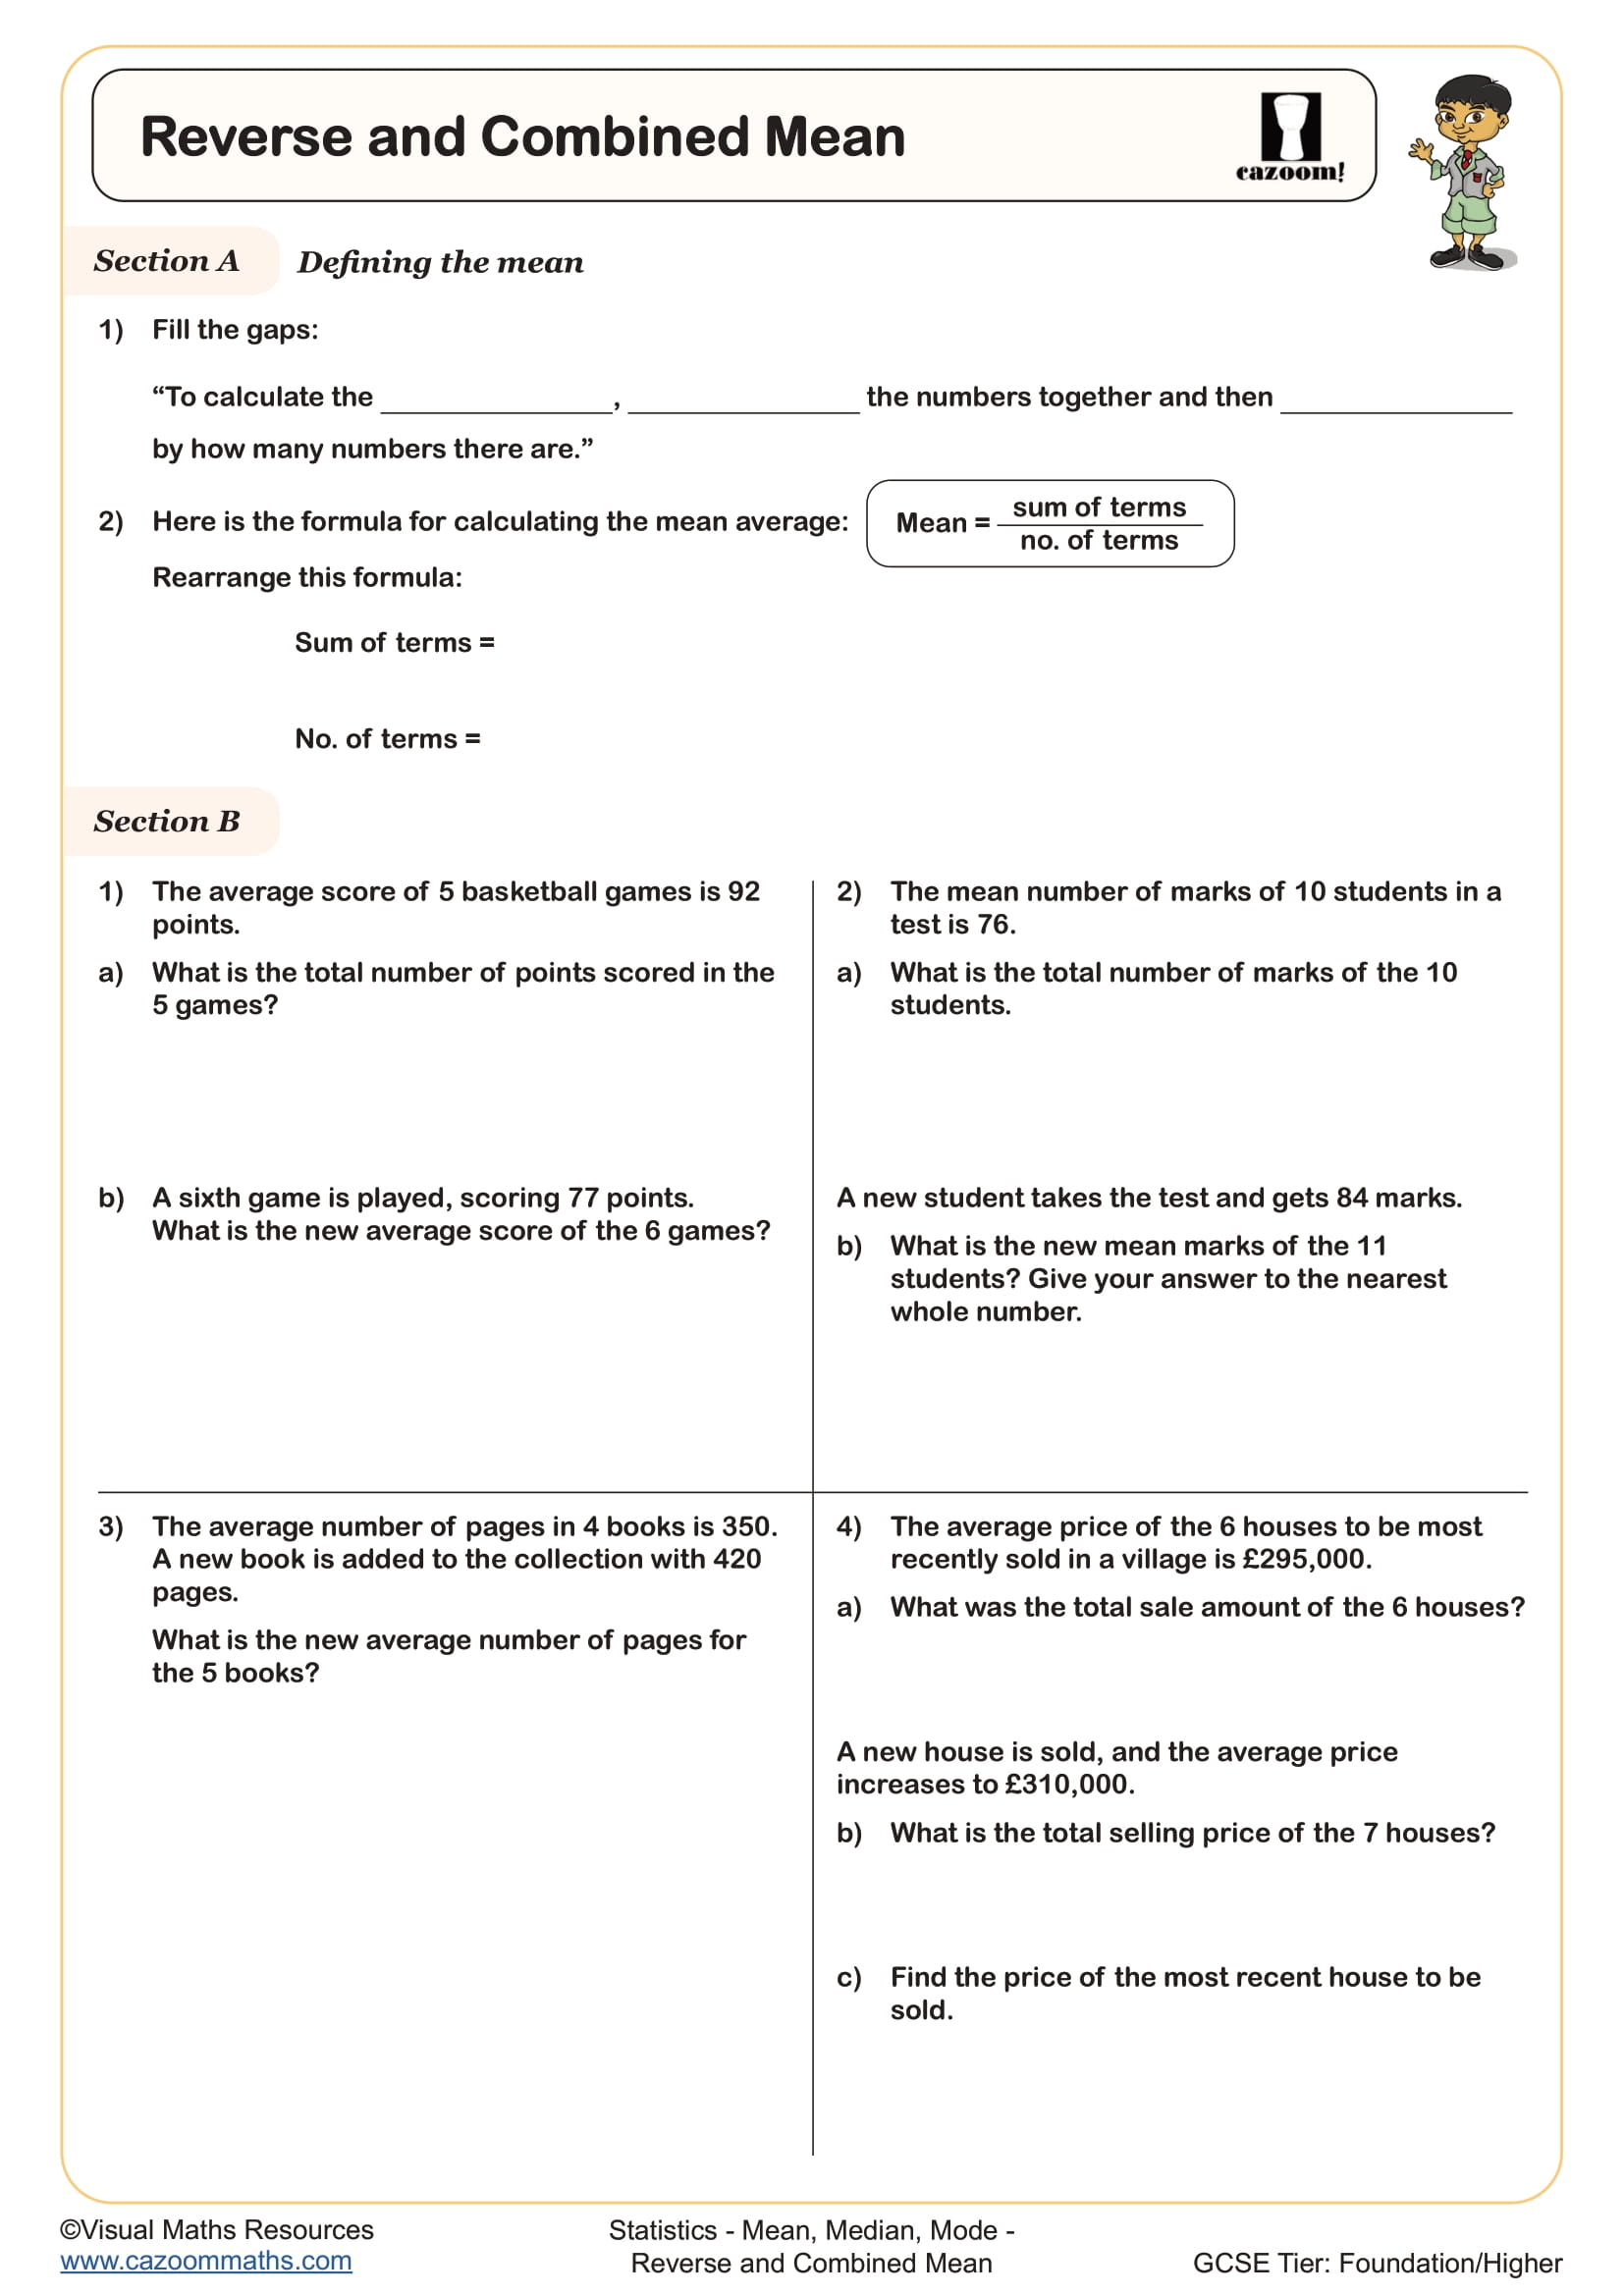
• Measures of Central Tendency - Mean, median, mode, and range calculations with real-world datasets
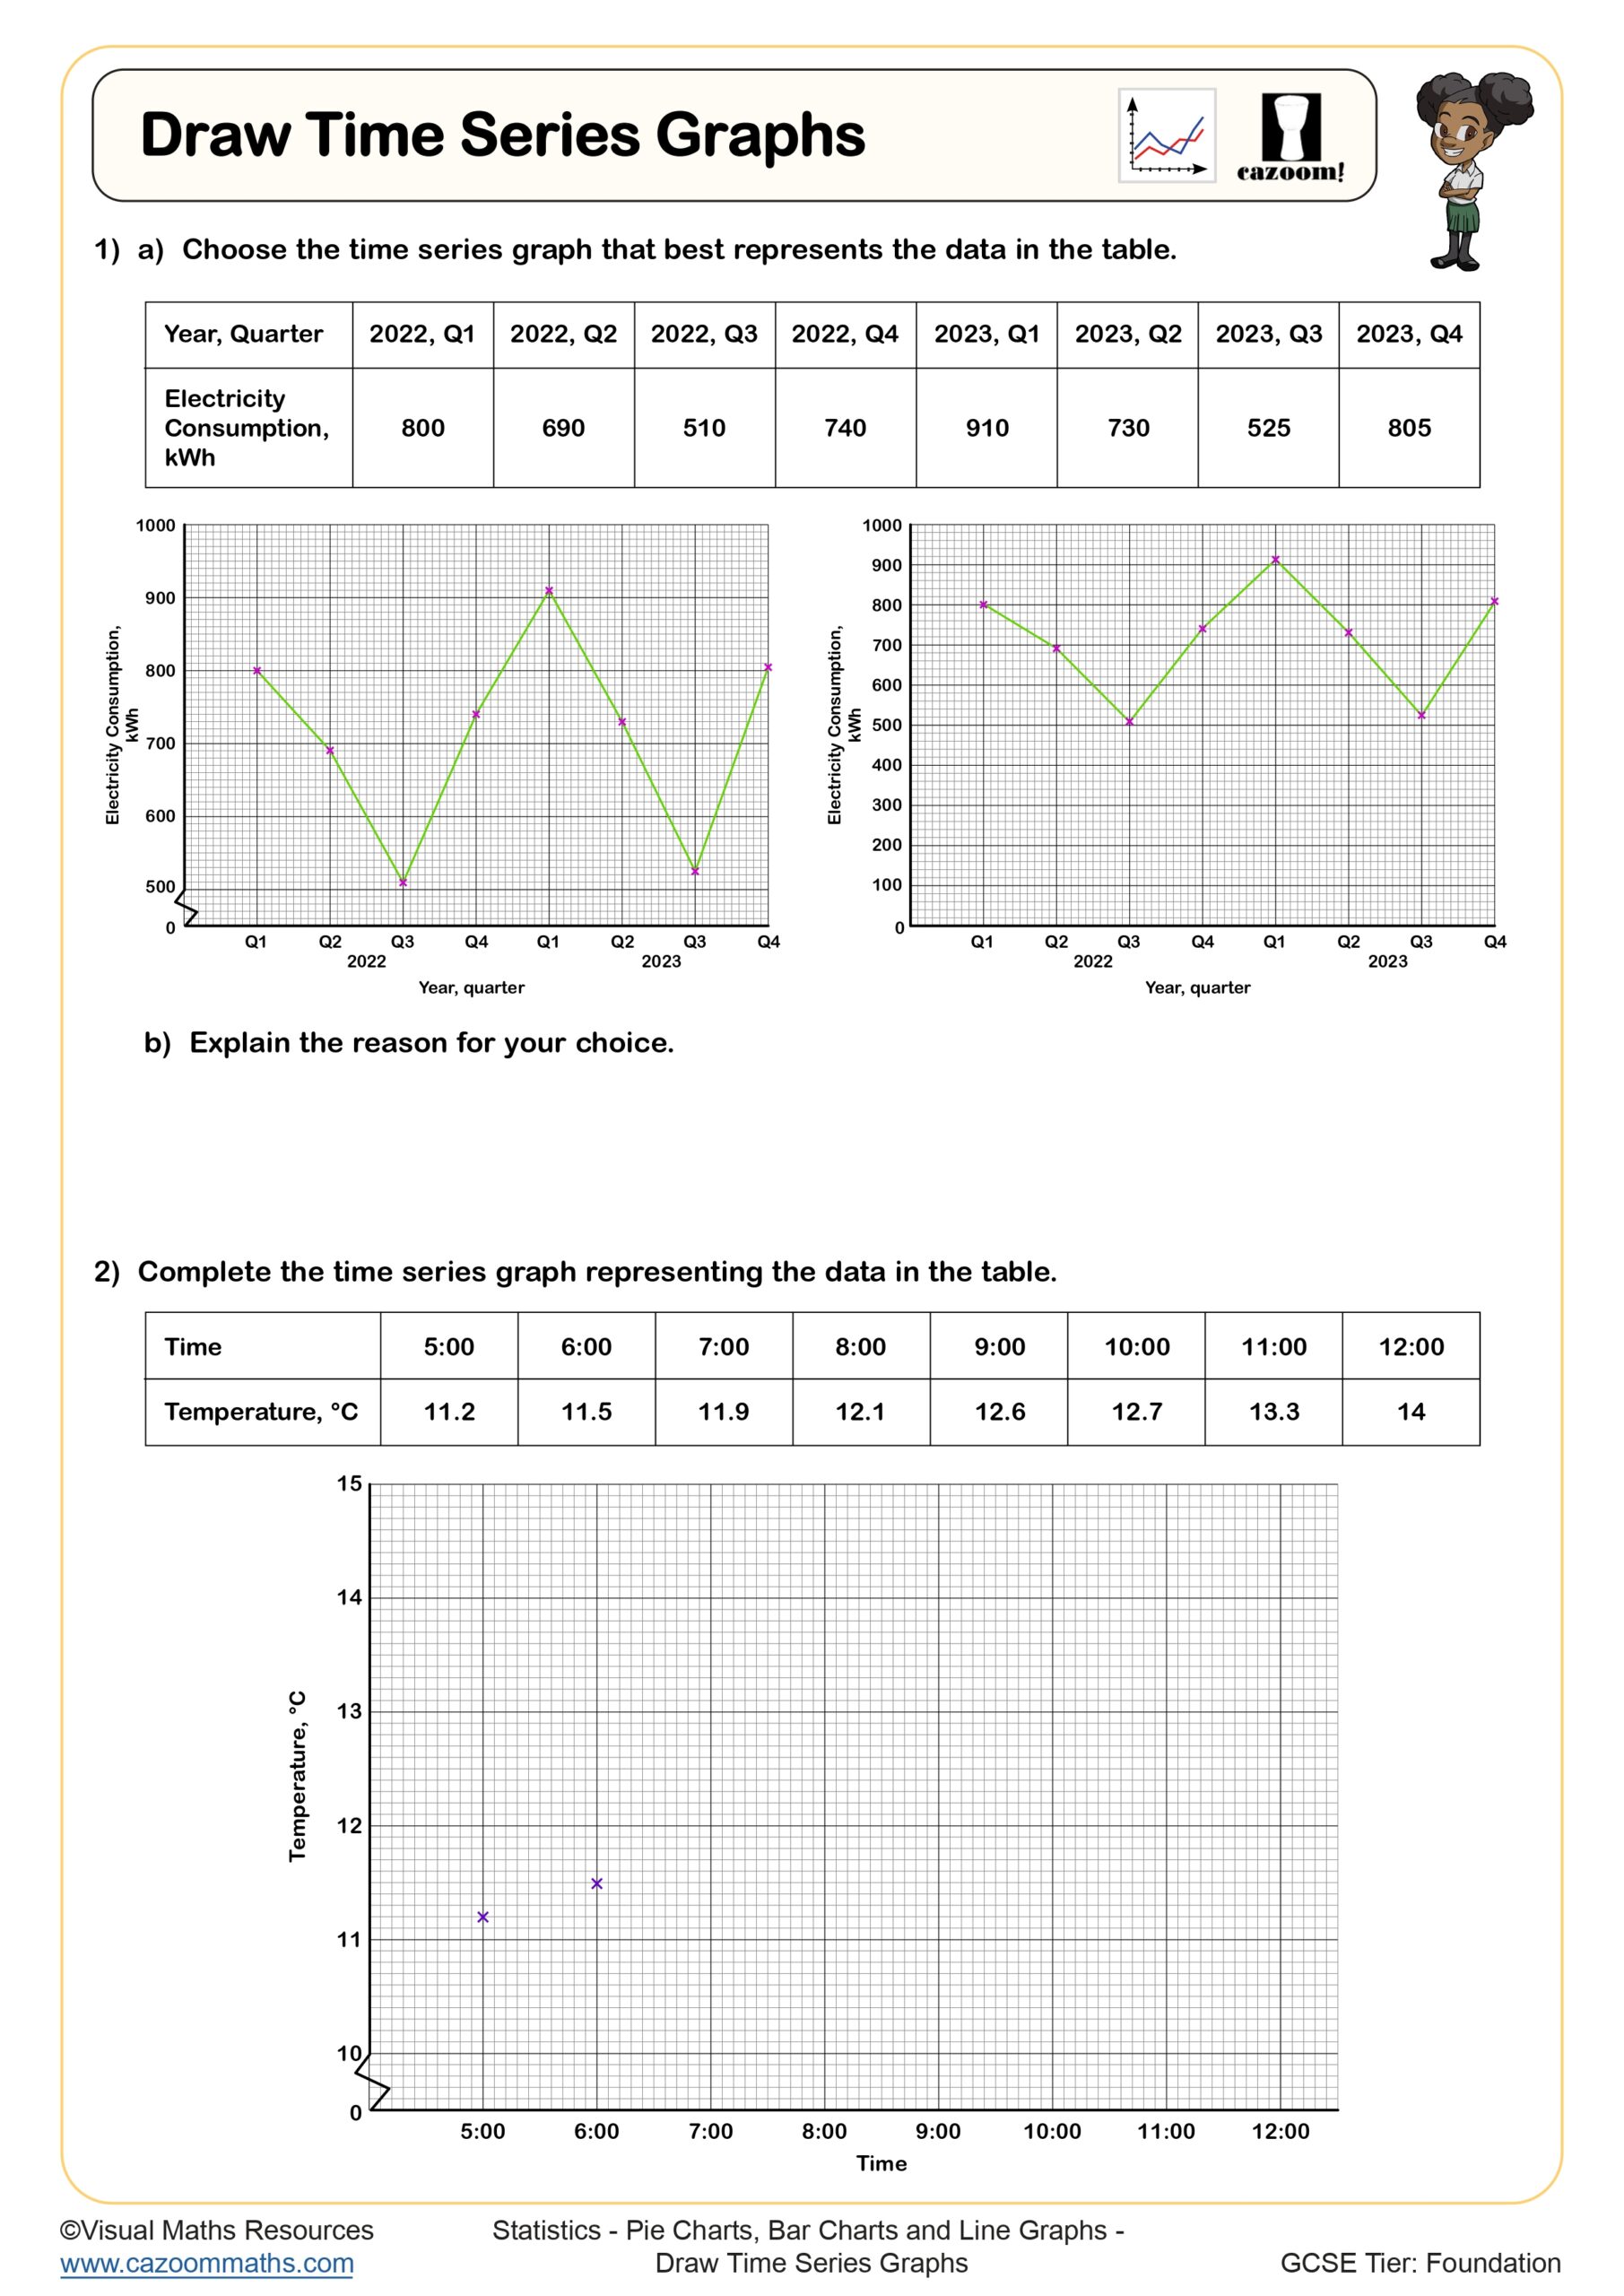
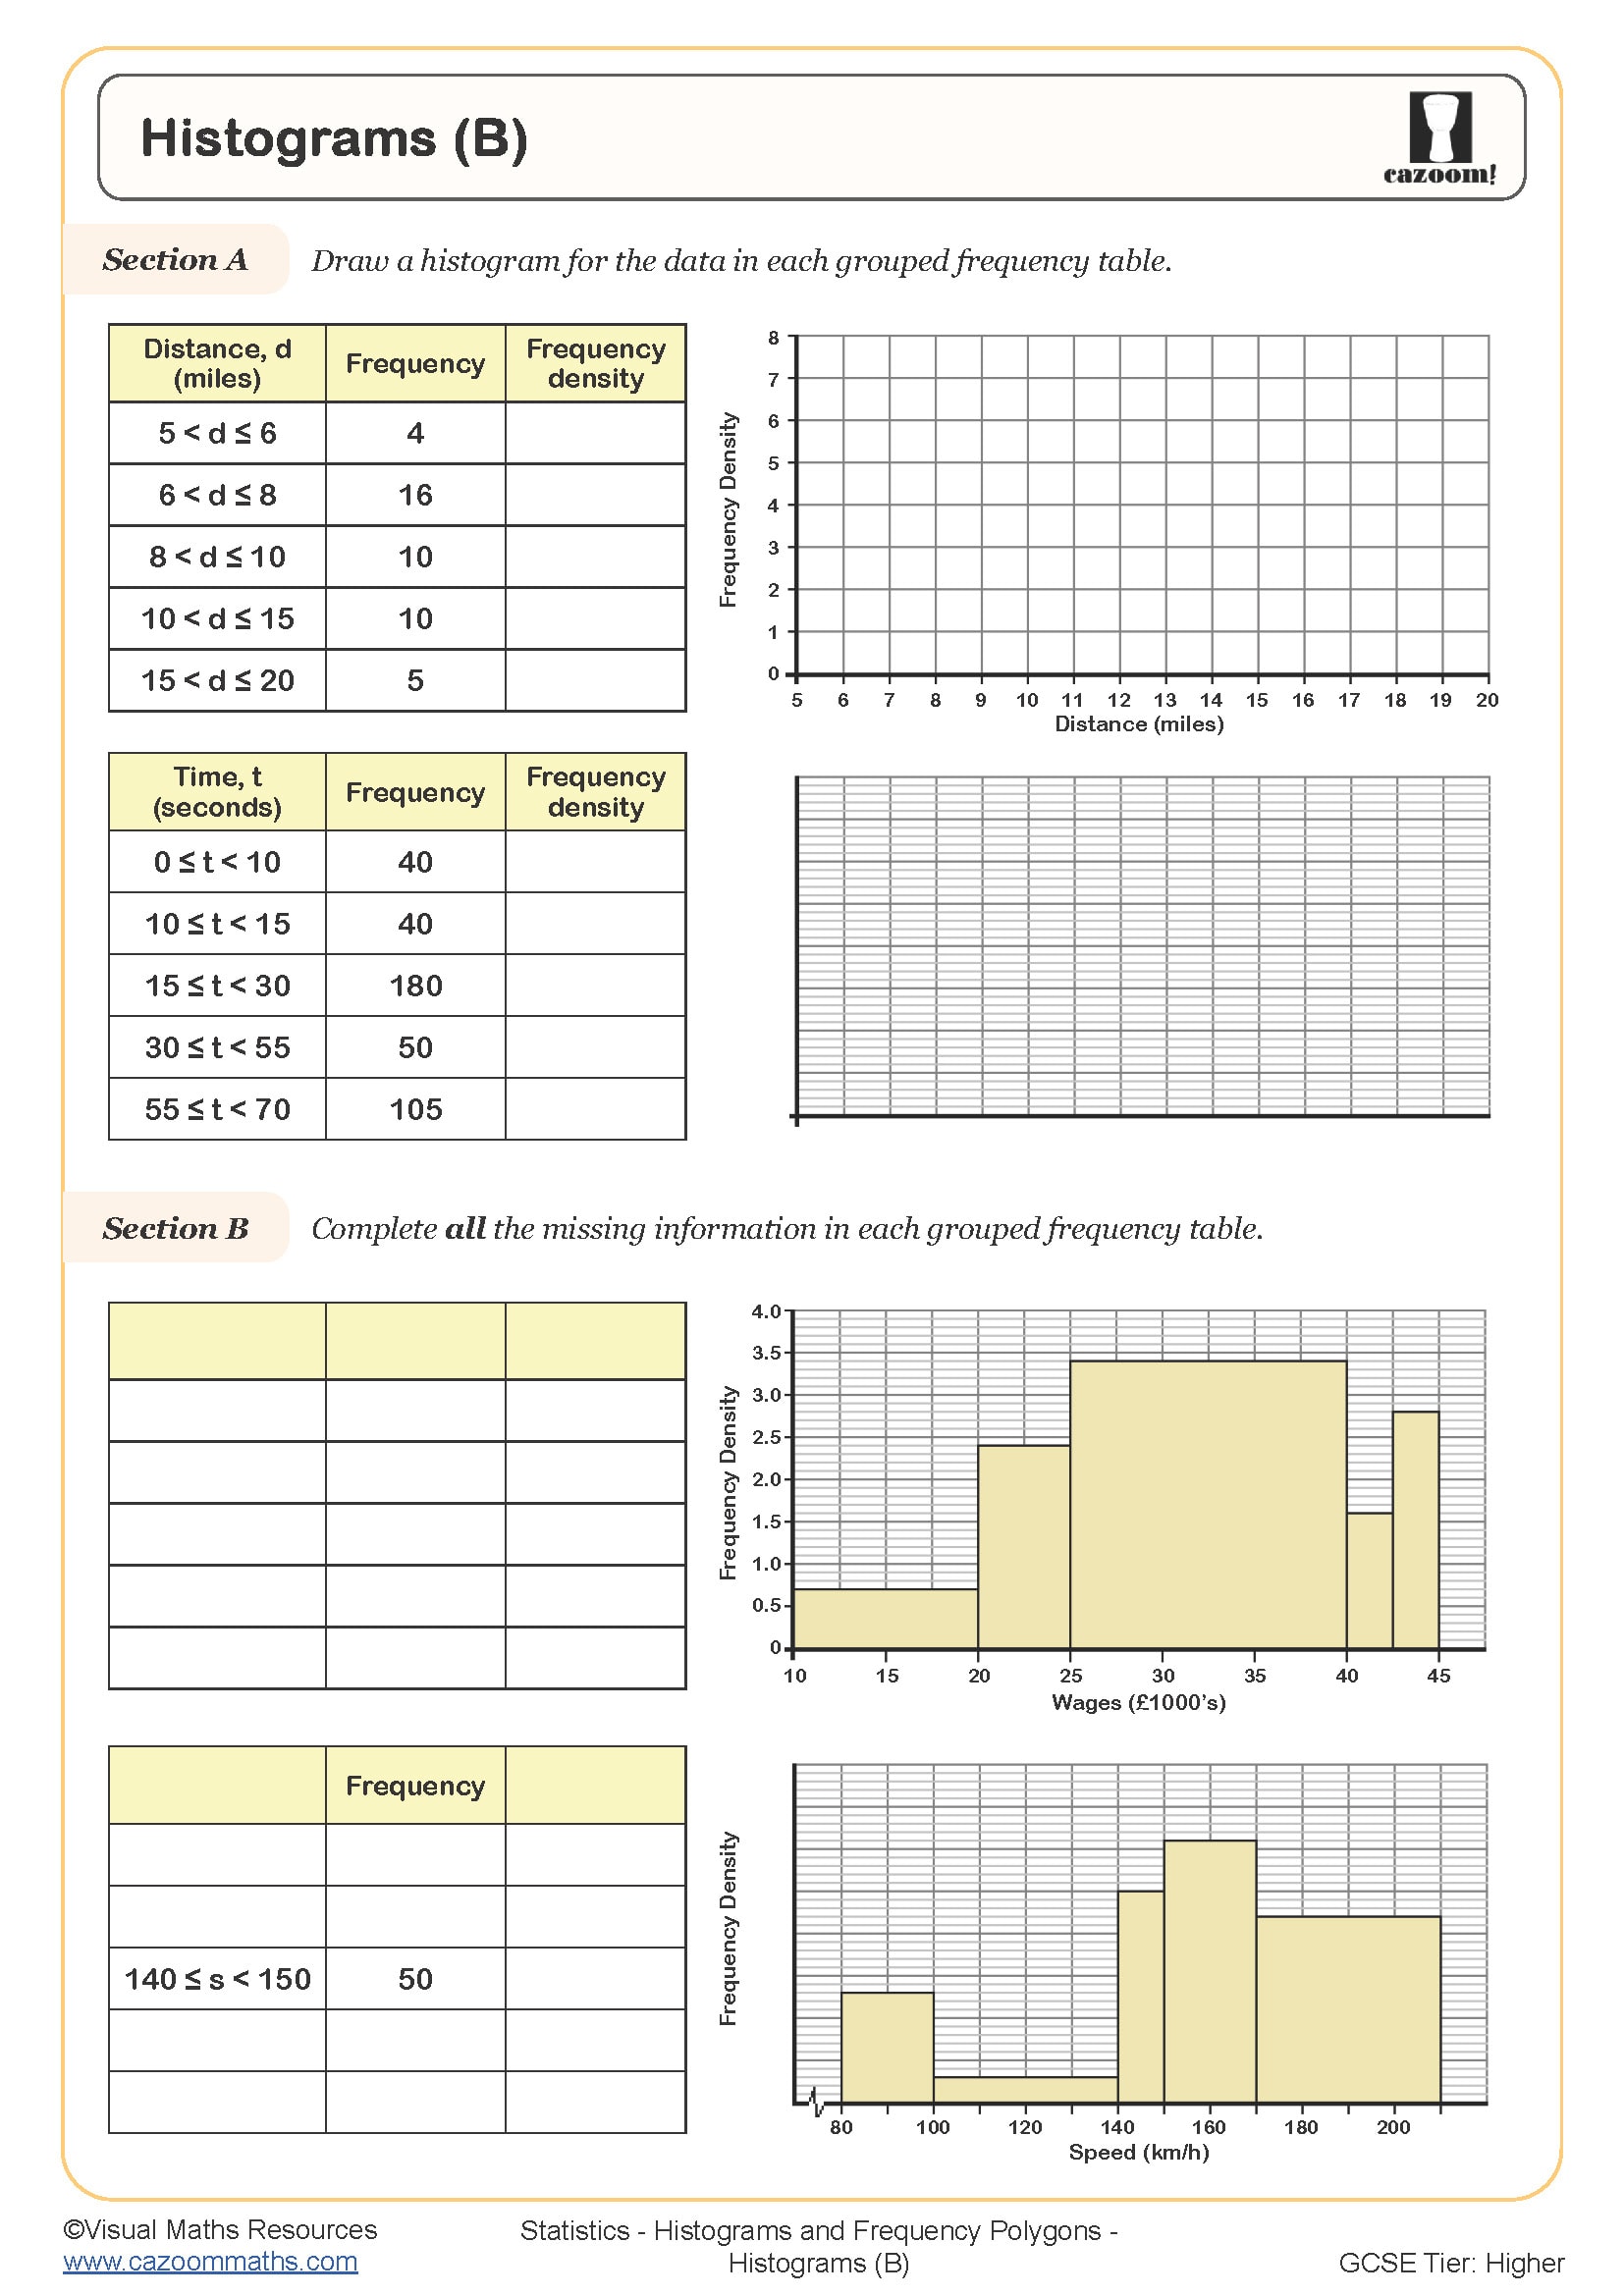
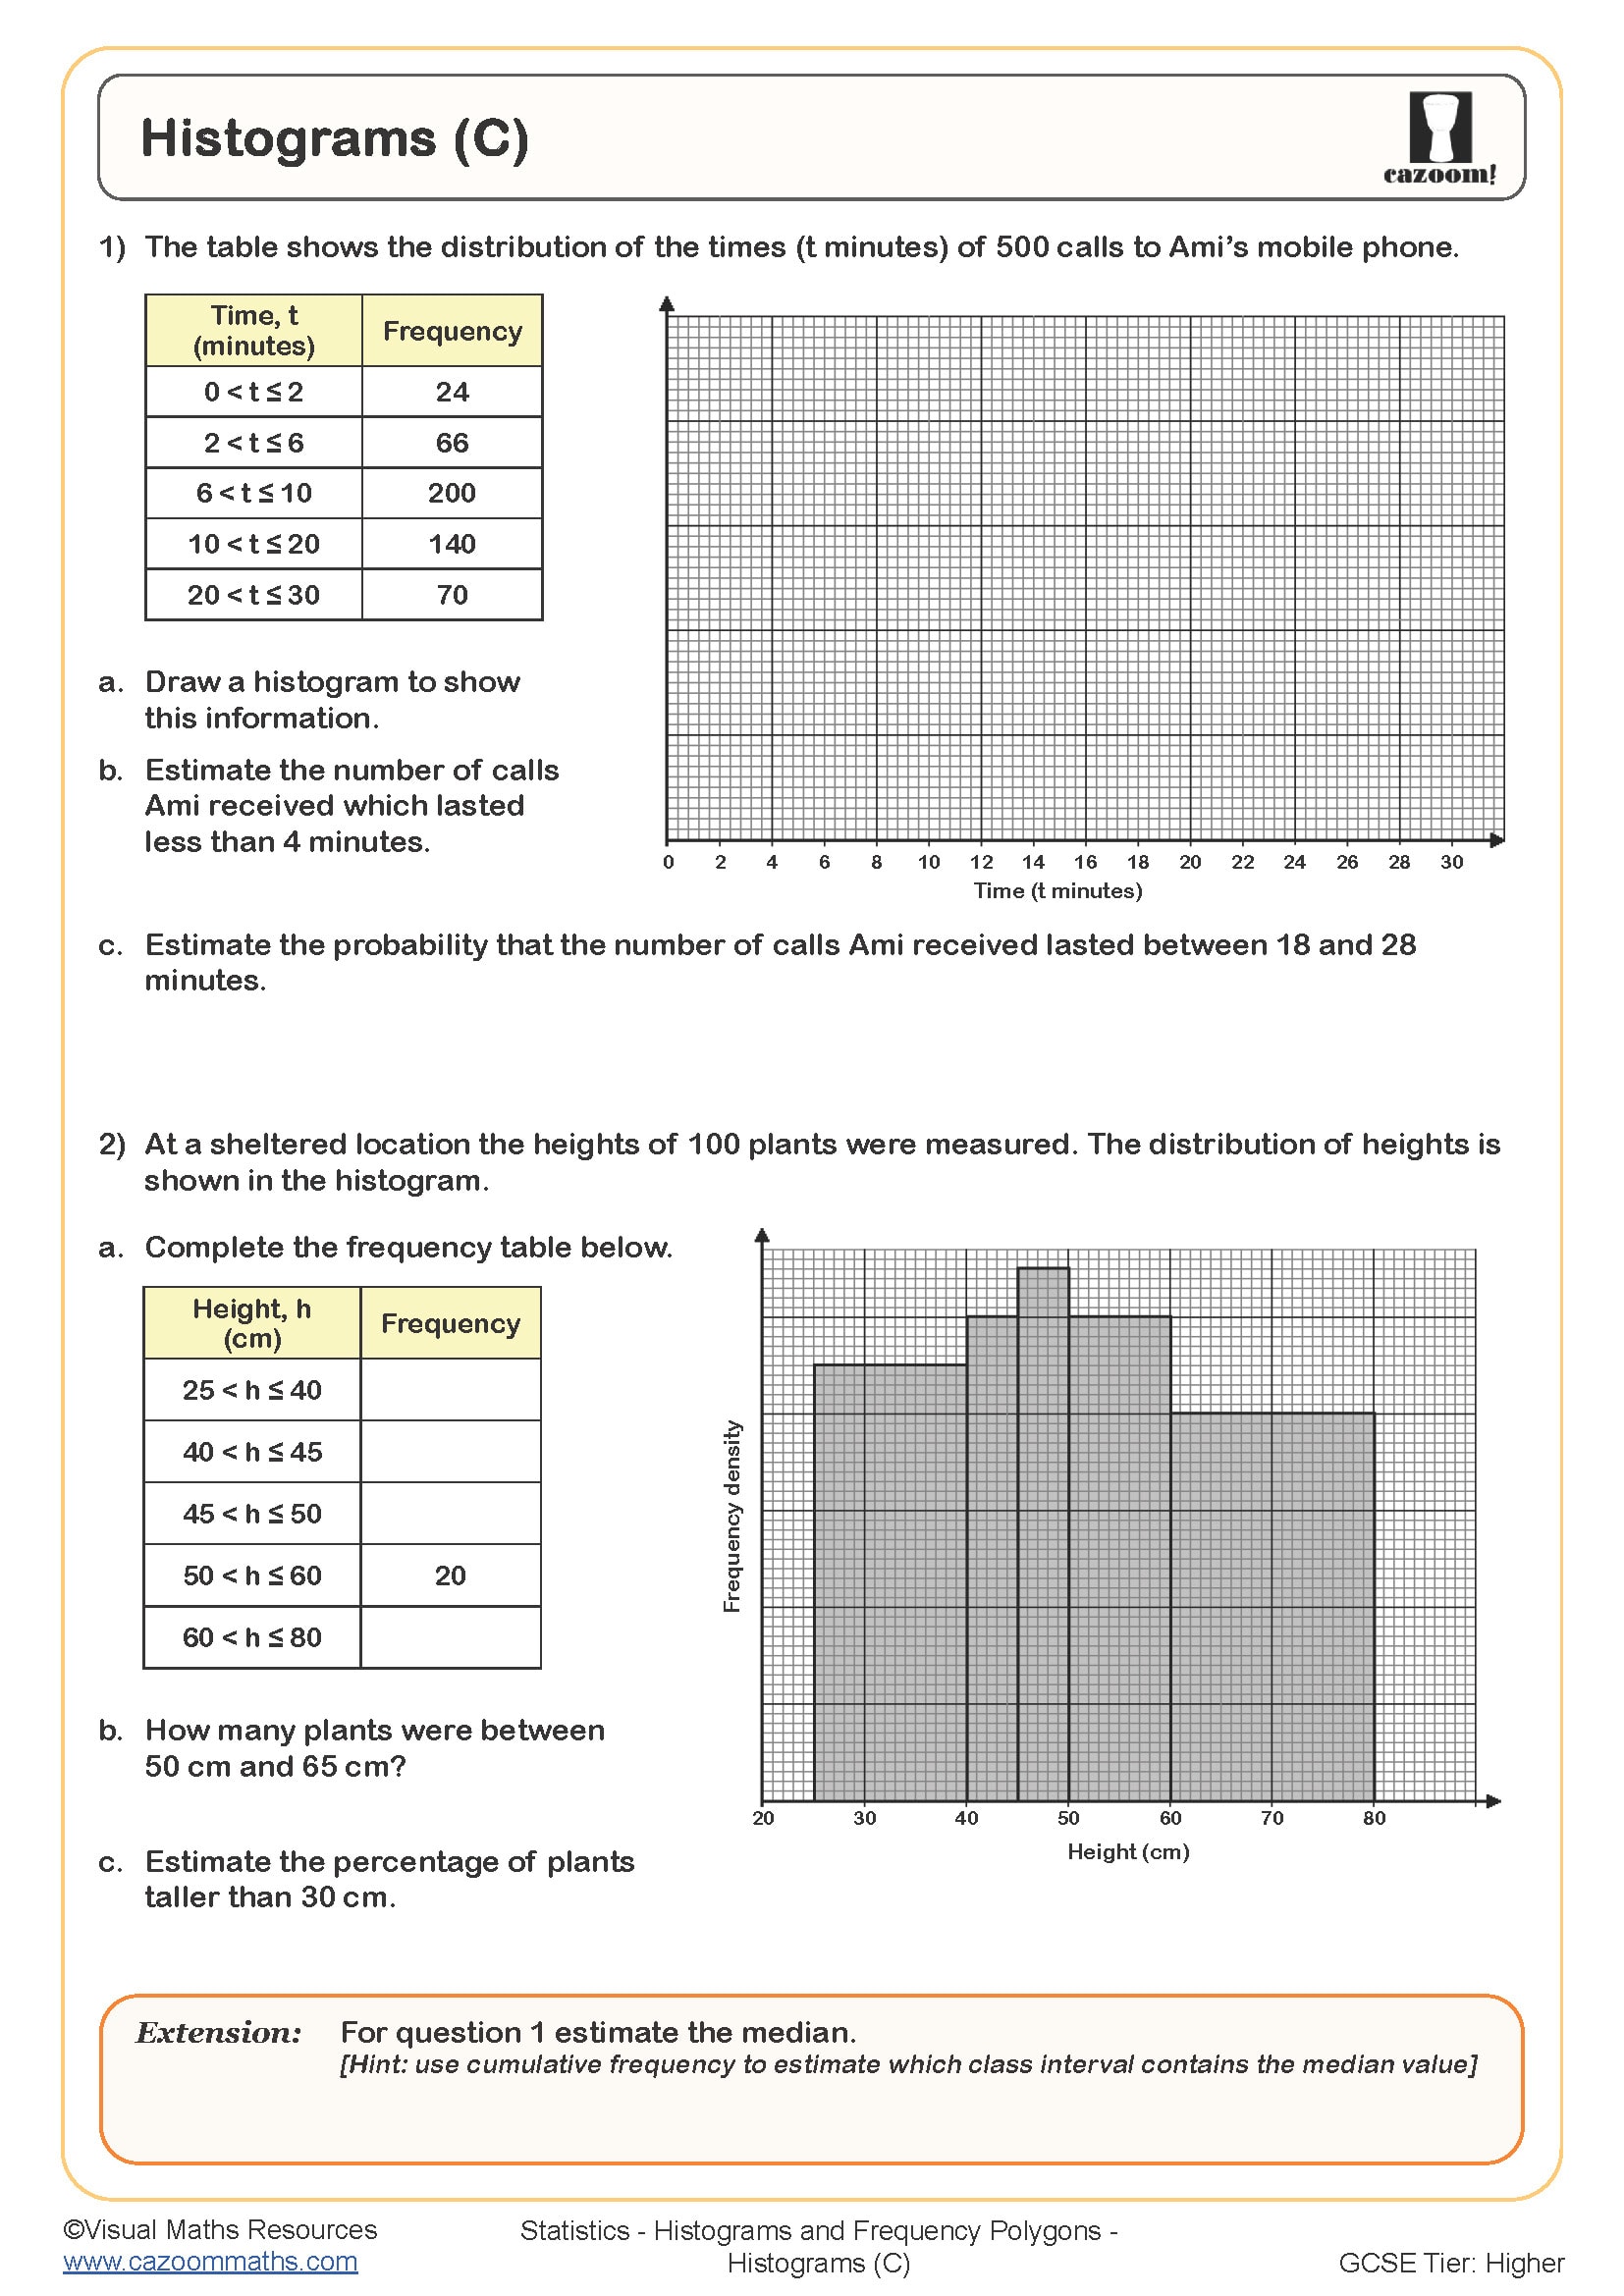
• Frequency Tables and Charts - Constructing and interpreting frequency tables, bar charts, and histograms
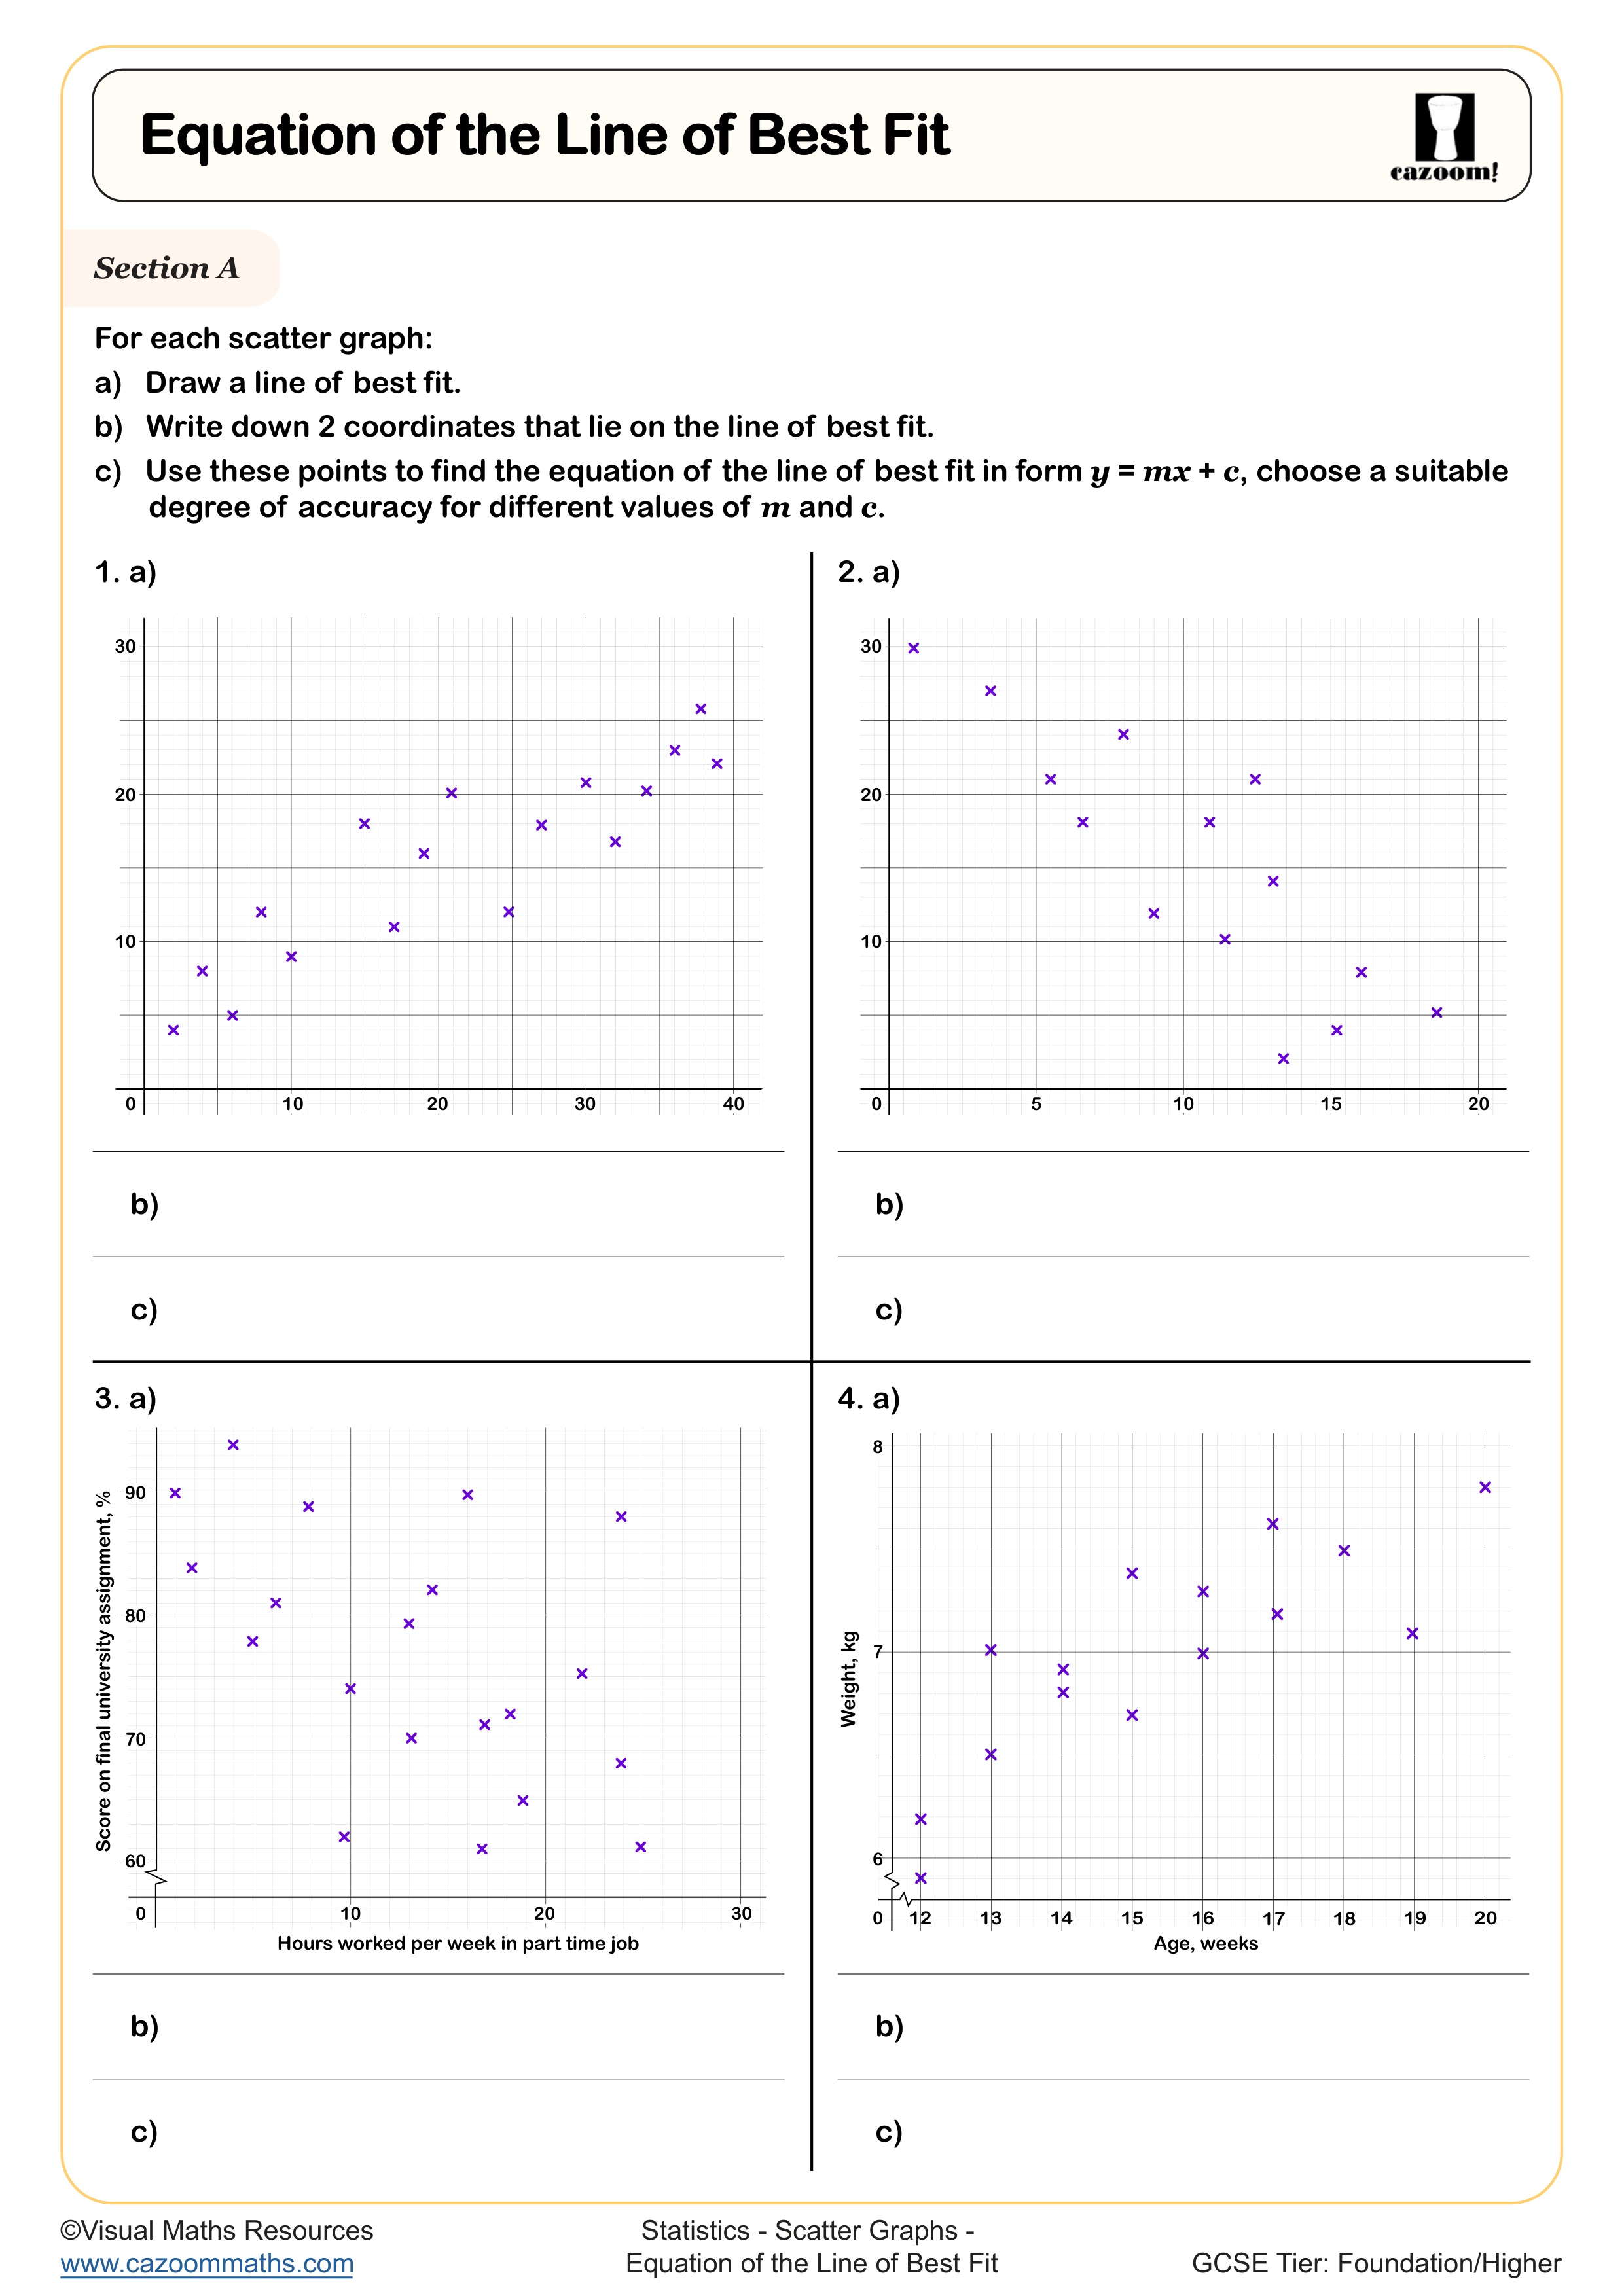
• Scatter Graphs and Correlation - Plotting scatter diagrams, identifying correlation types, and the line of best fit
• Probability Fundamentals - Basic probability calculations, probability trees, and conditional probability
• Statistical Diagrams - Pie charts, stem-and-leaf diagrams, and box plots interpretation
• Data Analysis Projects - Real-world statistical investigations and hypothesis testing basics
Each topic includes progressive difficulty levels to challenge every student appropriately whilst building essential GCSE skills.
Why These Year 10 Statistics Resources Are Essential for GCSE Success
Statistics forms a significant portion of GCSE maths, appearing across multiple exam papers and real-world problem-solving questions. Our worksheets align perfectly with current GCSE specifications, ensuring students learn relevant analytical skills. Regular practice with these Year 10 statistics worksheets builds mathematical fluency, reducing exam anxiety and boosting confidence. Students who master statistical concepts in Year 10 perform significantly better in their final GCSE exams, particularly in the problem-solving and reasoning papers.
Real-Life Applications of Year 10 Statistics Skills
Statistics isn't just abstract mathematics - it's everywhere in daily life and connects beautifully across the curriculum. Students use statistical analysis when evaluating survey results for geography coursework or interpreting experimental data in science lessons. Understanding averages helps when comparing product reviews or sports performance data. Probability skills apply to weather forecasting and risk assessment. Engineers use statistical methods for quality control, whilst social scientists rely on data interpretation for research. These connections help students appreciate maths beyond the classroom and see the genuine value of statistical literacy in modern society.