Year 11 Statistics Worksheets

Here at Cazoom Maths, we've noticed something interesting about Year 11 statistics - students can explain the theory beautifully, but often panic during actual problem-solving. That's exactly why our team developed these comprehensive statistics worksheets. We've designed each resource to transform that theoretical understanding into confident application, giving students the targeted practice they need to excel in their GCSE statistics assessments.

Averages from Frequency Tables

Preview of Averages from Frequency Tables

Averages from Grouped Data

Preview of Averages from Grouped Data

Biased Questions

Preview of Biased Questions

Biased Samples

Preview of Biased Samples

Calculating Probabilities

Preview of Calculating Probabilities

Capture Recapture

Preview of Capture Recapture

Choosing the Best Average

Preview of Choosing the Best Average

Choosing the Best Representation

Preview of Choosing the Best Representation

Comparing Two Sets of Data

Preview of Comparing Two Sets of Data

Completing Tables from Pie Charts

Preview of Completing Tables from Pie Charts

Completing Two-way Tables

Preview of Completing Two-way Tables

Correlation

Preview of Correlation

Correlation and Causation

Preview of Correlation and Causation

Criticising Graphs and Charts

Preview of Criticising Graphs and Charts

Designing Good Questions

Preview of Designing Good Questions

Draw Composite and Dual Bar Charts

Preview of Draw Composite and Dual Bar Charts

Draw Time Series Graphs

Preview of Draw Time Series Graphs

Drawing Bar Charts from Frequency Tables (A)

Preview of Drawing Bar Charts from Frequency Tables (A)

Drawing Bar Charts from Frequency Tables (B)

Preview of Drawing Bar Charts from Frequency Tables (B)

Drawing Frequency Polygons

Preview of Drawing Frequency Polygons

Drawing Pie Charts (A)

Preview of Drawing Pie Charts (A)

Drawing Pie Charts (B)

Preview of Drawing Pie Charts (B)

Drawing Pie Charts (C)

Preview of Drawing Pie Charts (C)

Estimate of the Mean

Preview of Estimate of the Mean

Frequency Polygons (A)

Preview of Frequency Polygons (A)

Frequency Polygons (B)

Preview of Frequency Polygons (B)

Frequency Polygons (C)

Preview of Frequency Polygons (C)

Frequency Trees (A)

Preview of Frequency Trees (A)

Frequency Trees (B)

Preview of Frequency Trees (B)

Grouped Frequency Tables

Preview of Grouped Frequency Tables

Histograms (A) - Frequency Diagrams

Preview of Histograms (A) - Frequency Diagrams

Histograms (B)

Preview of Histograms (B)

Histograms (C)

Preview of Histograms (C)

Line Graphs (A)

Preview of Line Graphs (A)

Line Graphs (B)

Preview of Line Graphs (B)

Mean, Median, Mode and Range (A)

Preview of Mean, Median, Mode and Range (A)

Mean, Median, Mode and Range (B)

Preview of Mean, Median, Mode and Range (B)

Pictograms

Preview of Pictograms

Probability Statements - True or False

Preview of Probability Statements - True or False

Questionnaires What's Wrong (A)

Preview of Questionnaires What's Wrong (A)

Questionnaires What's Wrong (A) (With Clues)

Preview of Questionnaires What's Wrong (A) (With Clues)

Questionnaires What's Wrong (B)

Preview of Questionnaires What's Wrong (B)

Reading and Drawing Scatter Graphs

Preview of Reading and Drawing Scatter Graphs

Reading Bar Charts

Preview of Reading Bar Charts

Reading Compound Bar Charts

Preview of Reading Compound Bar Charts

Reading Pie Charts (A)

Preview of Reading Pie Charts (A)

Reading Pie Charts (B)

Preview of Reading Pie Charts (B)

Reading Two-way Tables

Preview of Reading Two-way Tables

Reverse and Combined Mean

Preview of Reverse and Combined Mean

Sets and Venn Diagrams (A)

Preview of Sets and Venn Diagrams (A)

Sets and Venn Diagrams (B)

Preview of Sets and Venn Diagrams (B)

Stem and Leaf Diagrams (A)

Preview of Stem and Leaf Diagrams (A)

Stem and Leaf Diagrams (B)

Preview of Stem and Leaf Diagrams (B)

Stem and Leaf Word Problems

Preview of Stem and Leaf Word Problems

Stratified Sampling (A)

Preview of Stratified Sampling (A)

Stratified Sampling (B)

Preview of Stratified Sampling (B)

Sums to One

Preview of Sums to One

The Language of Probability

Preview of The Language of Probability

The Line of Best Fit

Preview of The Line of Best Fit

The Mean (A)

Preview of The Mean (A)

The Mean (B)

Preview of The Mean (B)

The Median and Range

Preview of The Median and Range

The Mode and Range

Preview of The Mode and Range

Tree Diagrams (B)

Preview of Tree Diagrams (B)

Using Algebra to Solve Probability Problems

Preview of Using Algebra to Solve Probability Problems

Using Algebra to Solve Probability Problems (with clues)

Preview of Using Algebra to Solve Probability Problems (with clues)

Statistics Worksheets with Answers PDF - Complete Year 11 Collection

Finding quality class 11 statistics worksheets that actually challenge students (without overwhelming them) isn't easy. We've created these statistics worksheets with answers PDF downloads specifically for busy teachers who need reliable resources. Each worksheet targets key statistical concepts through carefully structured problems, and our detailed solutions don't just show the answer - they walk through the thinking process that gets students there.

Essential Statistics Skills Your Year 11 Students Will Master

We've packed quite a lot into these worksheets! The progression moves from basic data handling through to complex probability scenarios, which keeps even our most confident mathematicians engaged. Students particularly love the real-data examples (they're surprisingly motivating), and we've included everything from frequency tables and cumulative frequency curves to standard deviation calculations and hypothesis testing foundations.

Our comprehensive collection covers all essential statistics topics for Year 11 students:

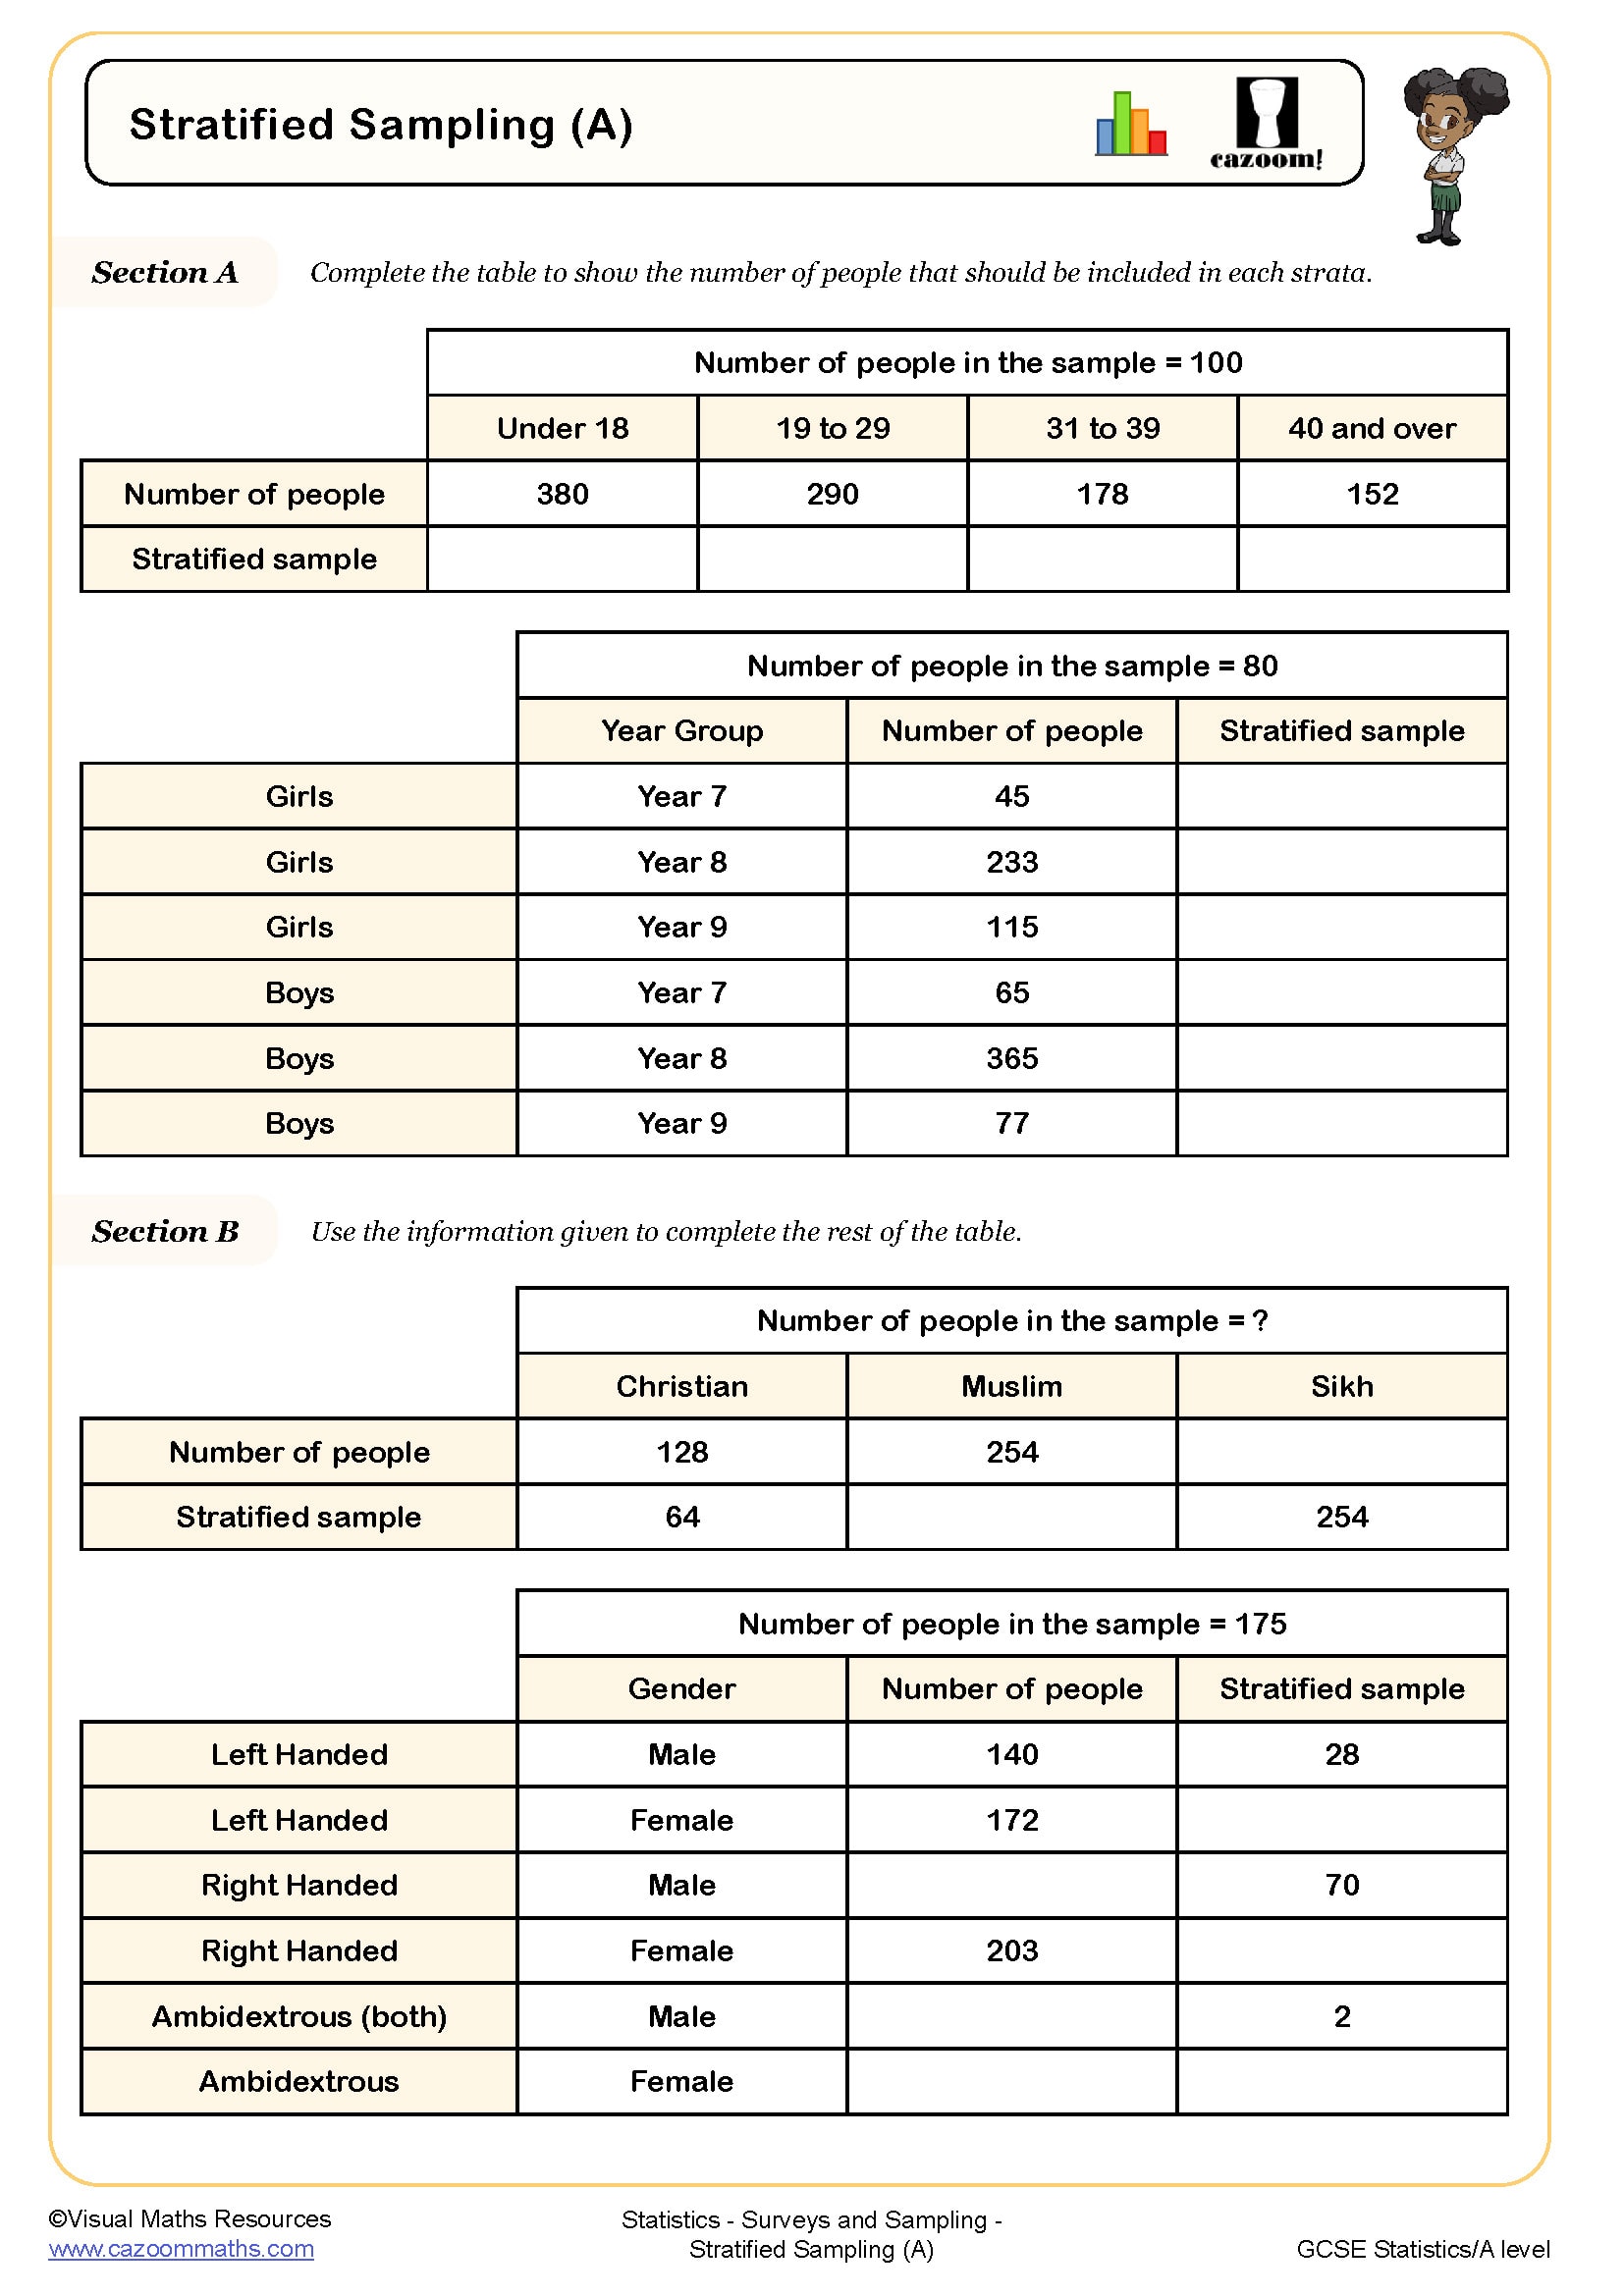
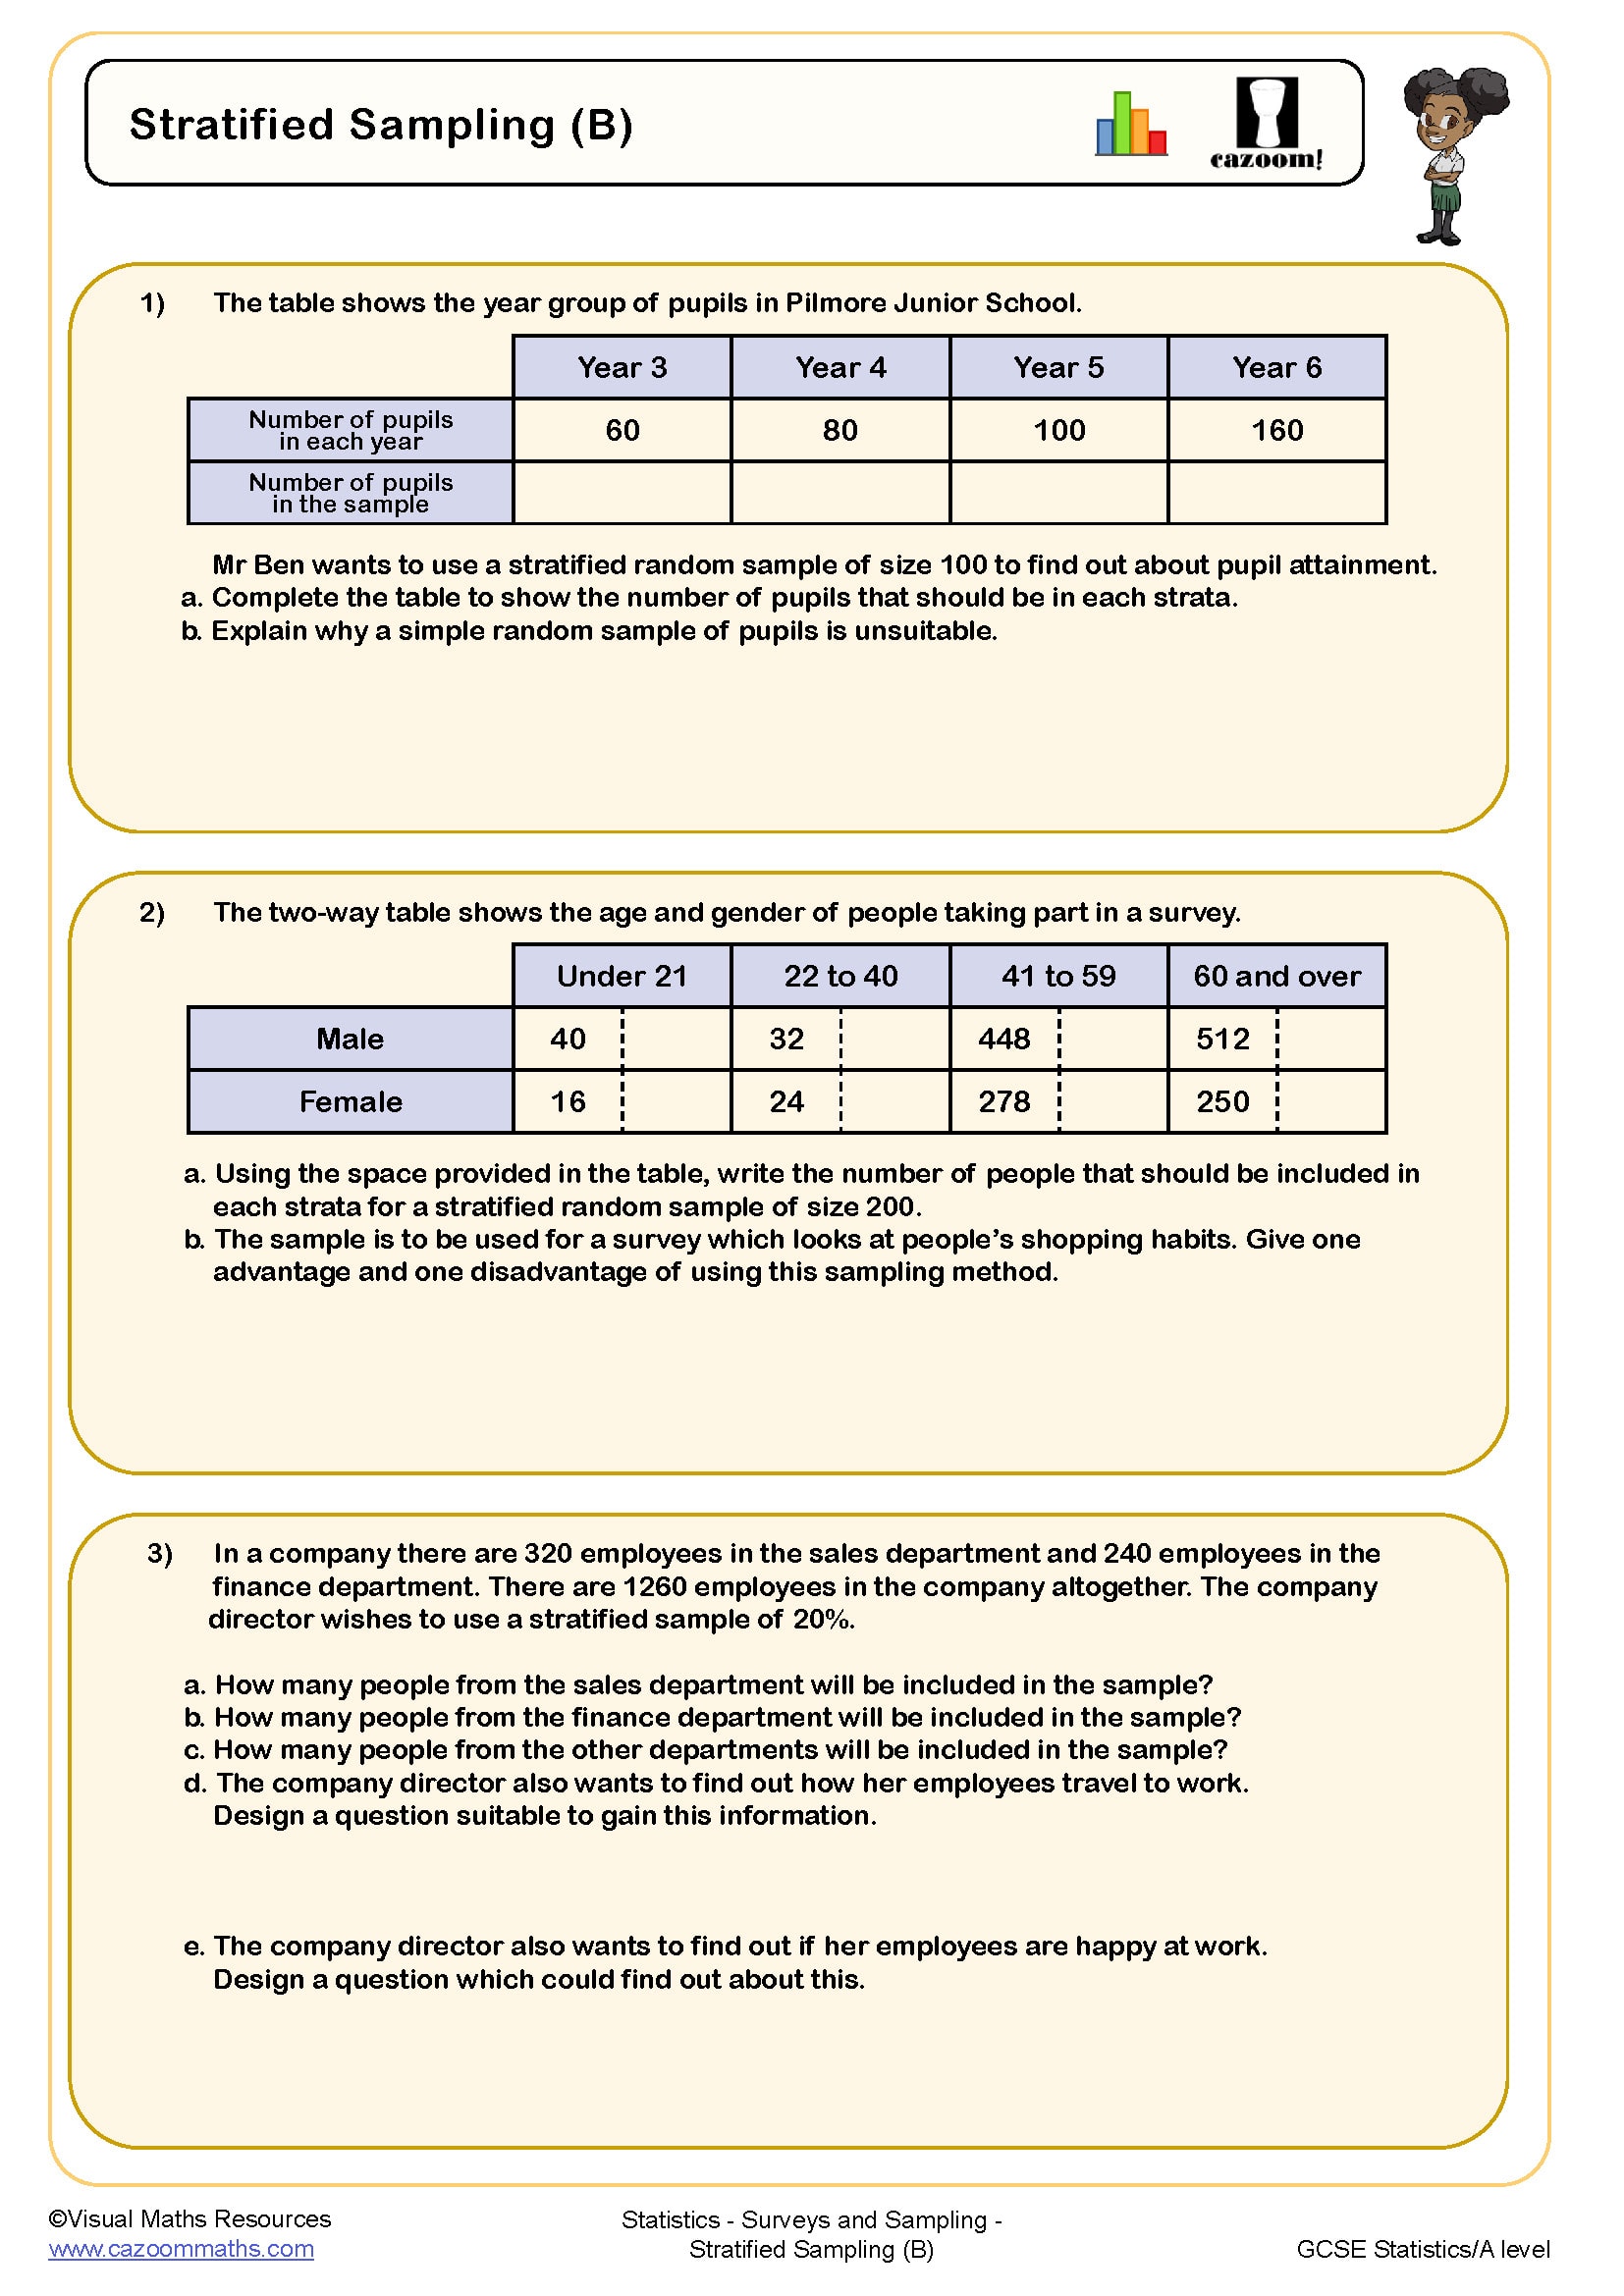
• Data Collection and Sampling - Primary and secondary data, sampling methods, and bias identification

• Measures of Central Tendency - Mean, median, mode, and range calculations with real-world datasets

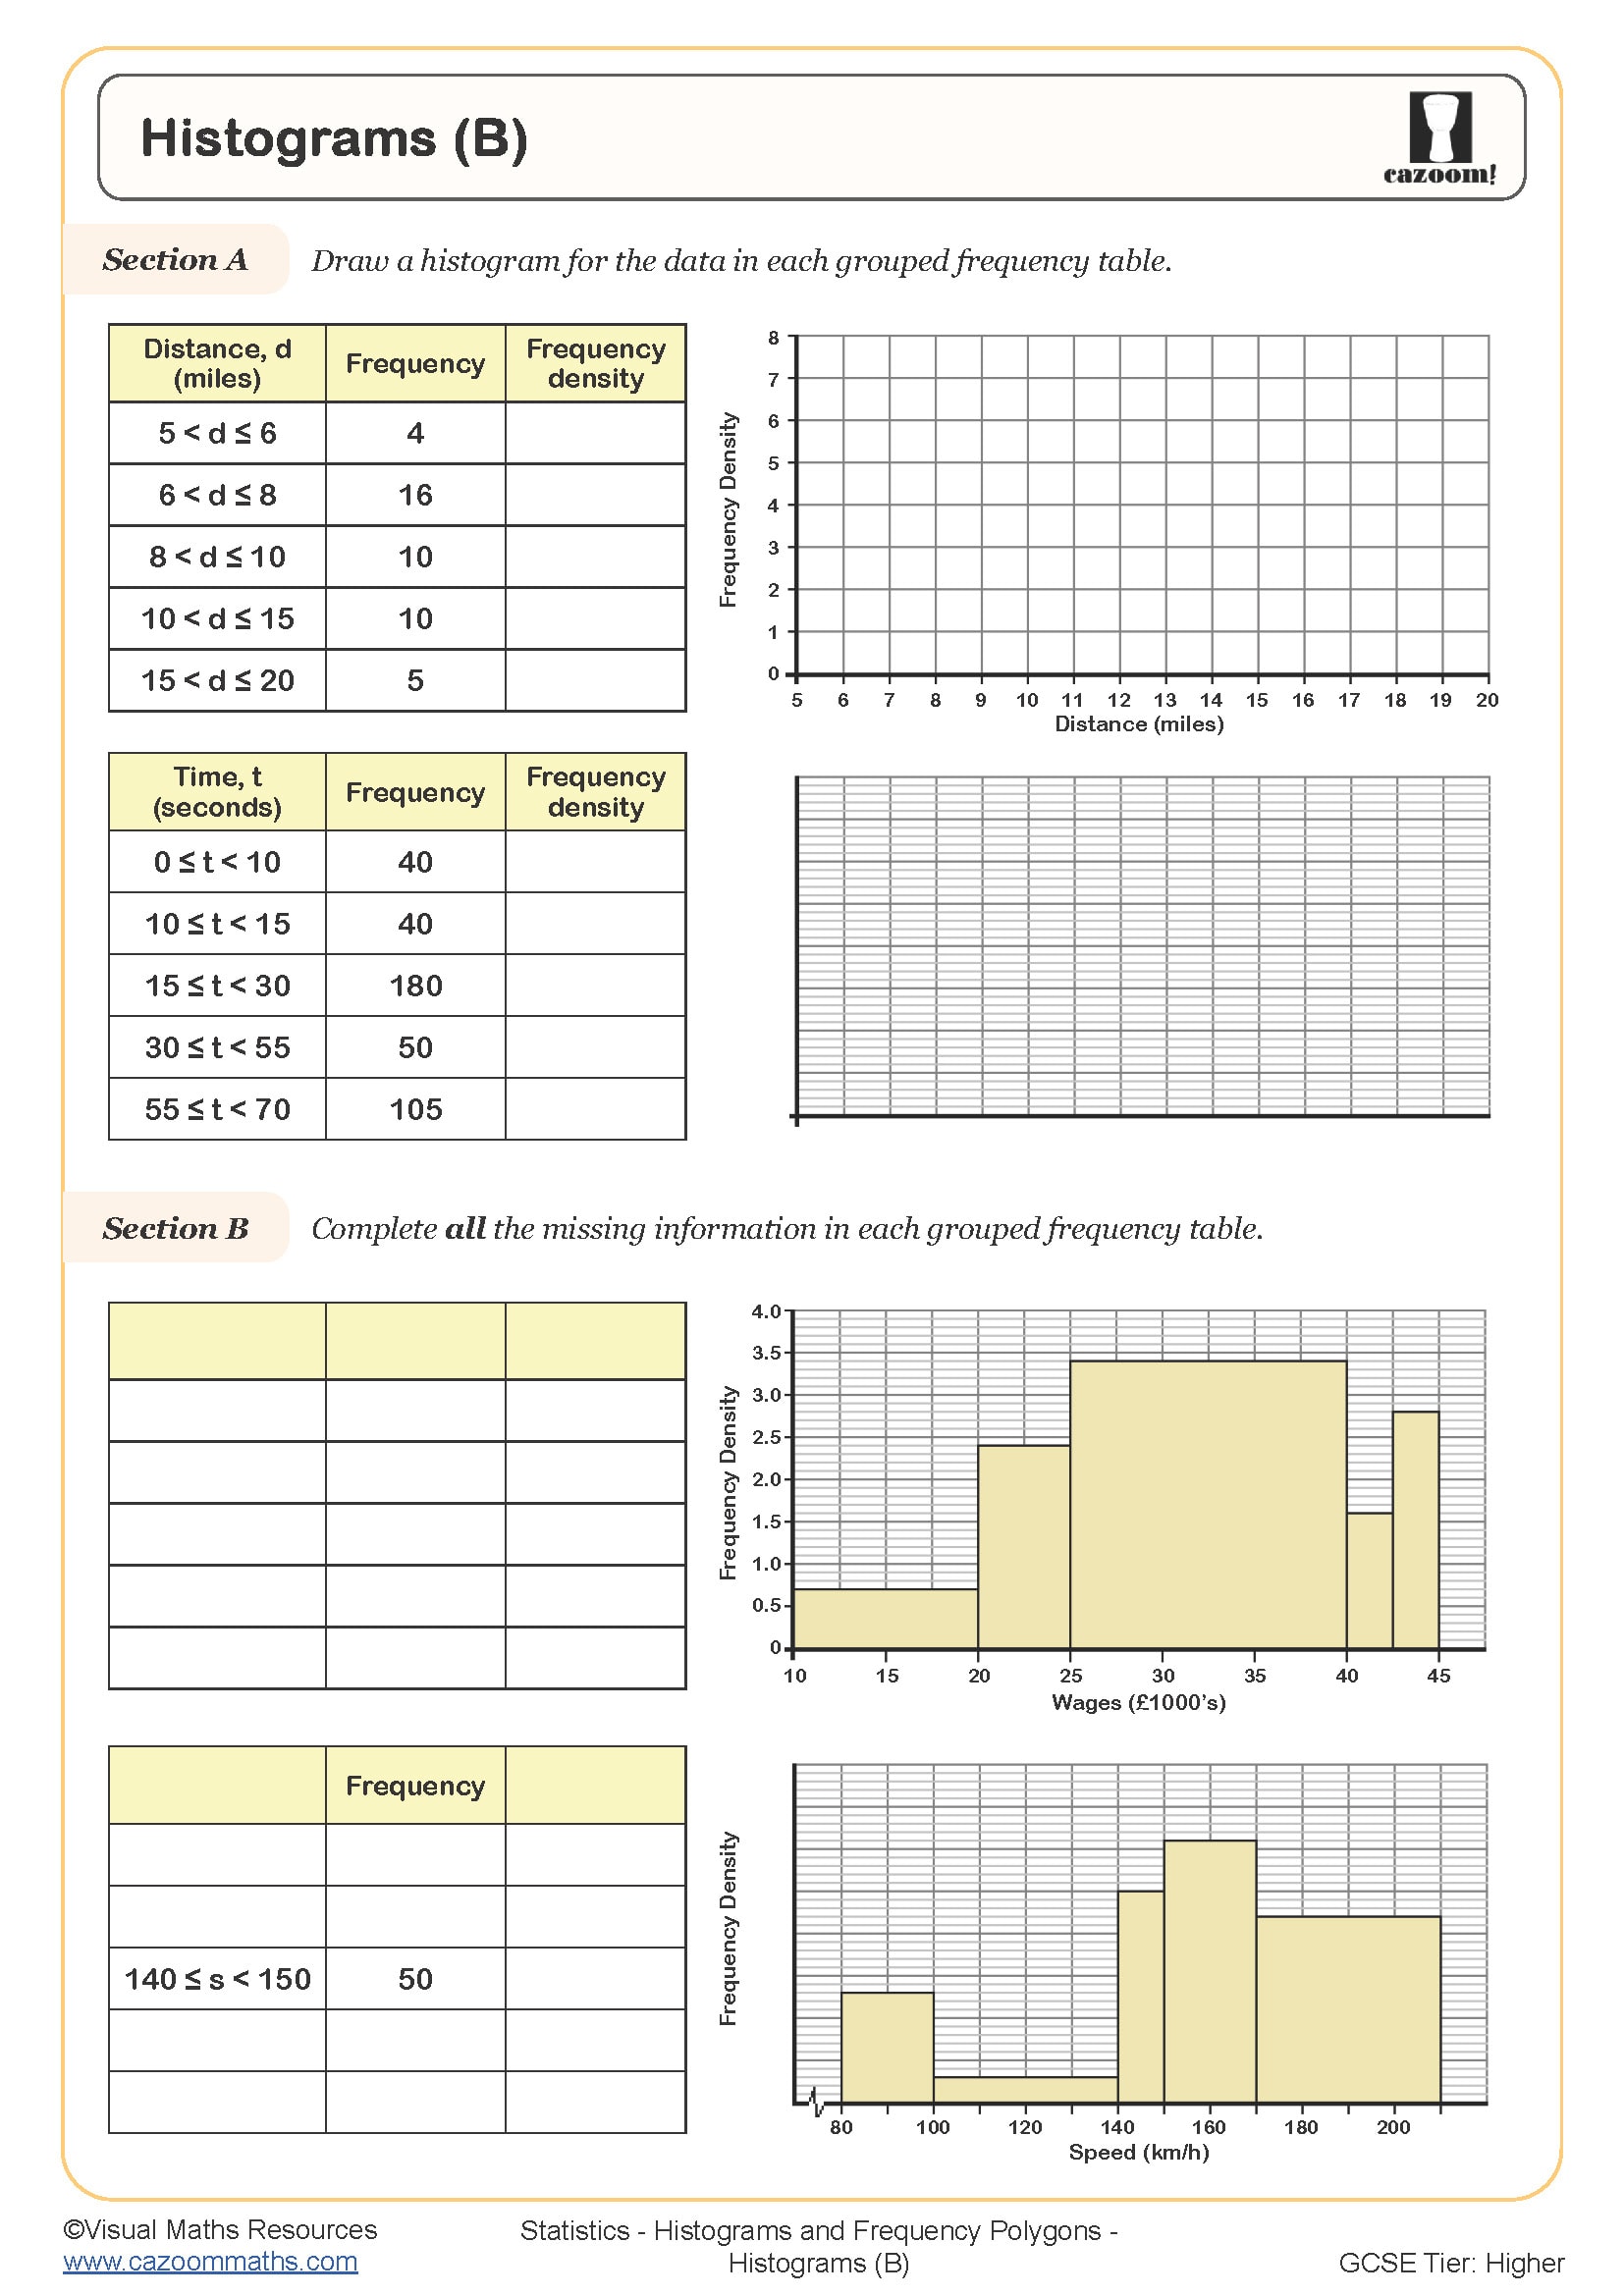
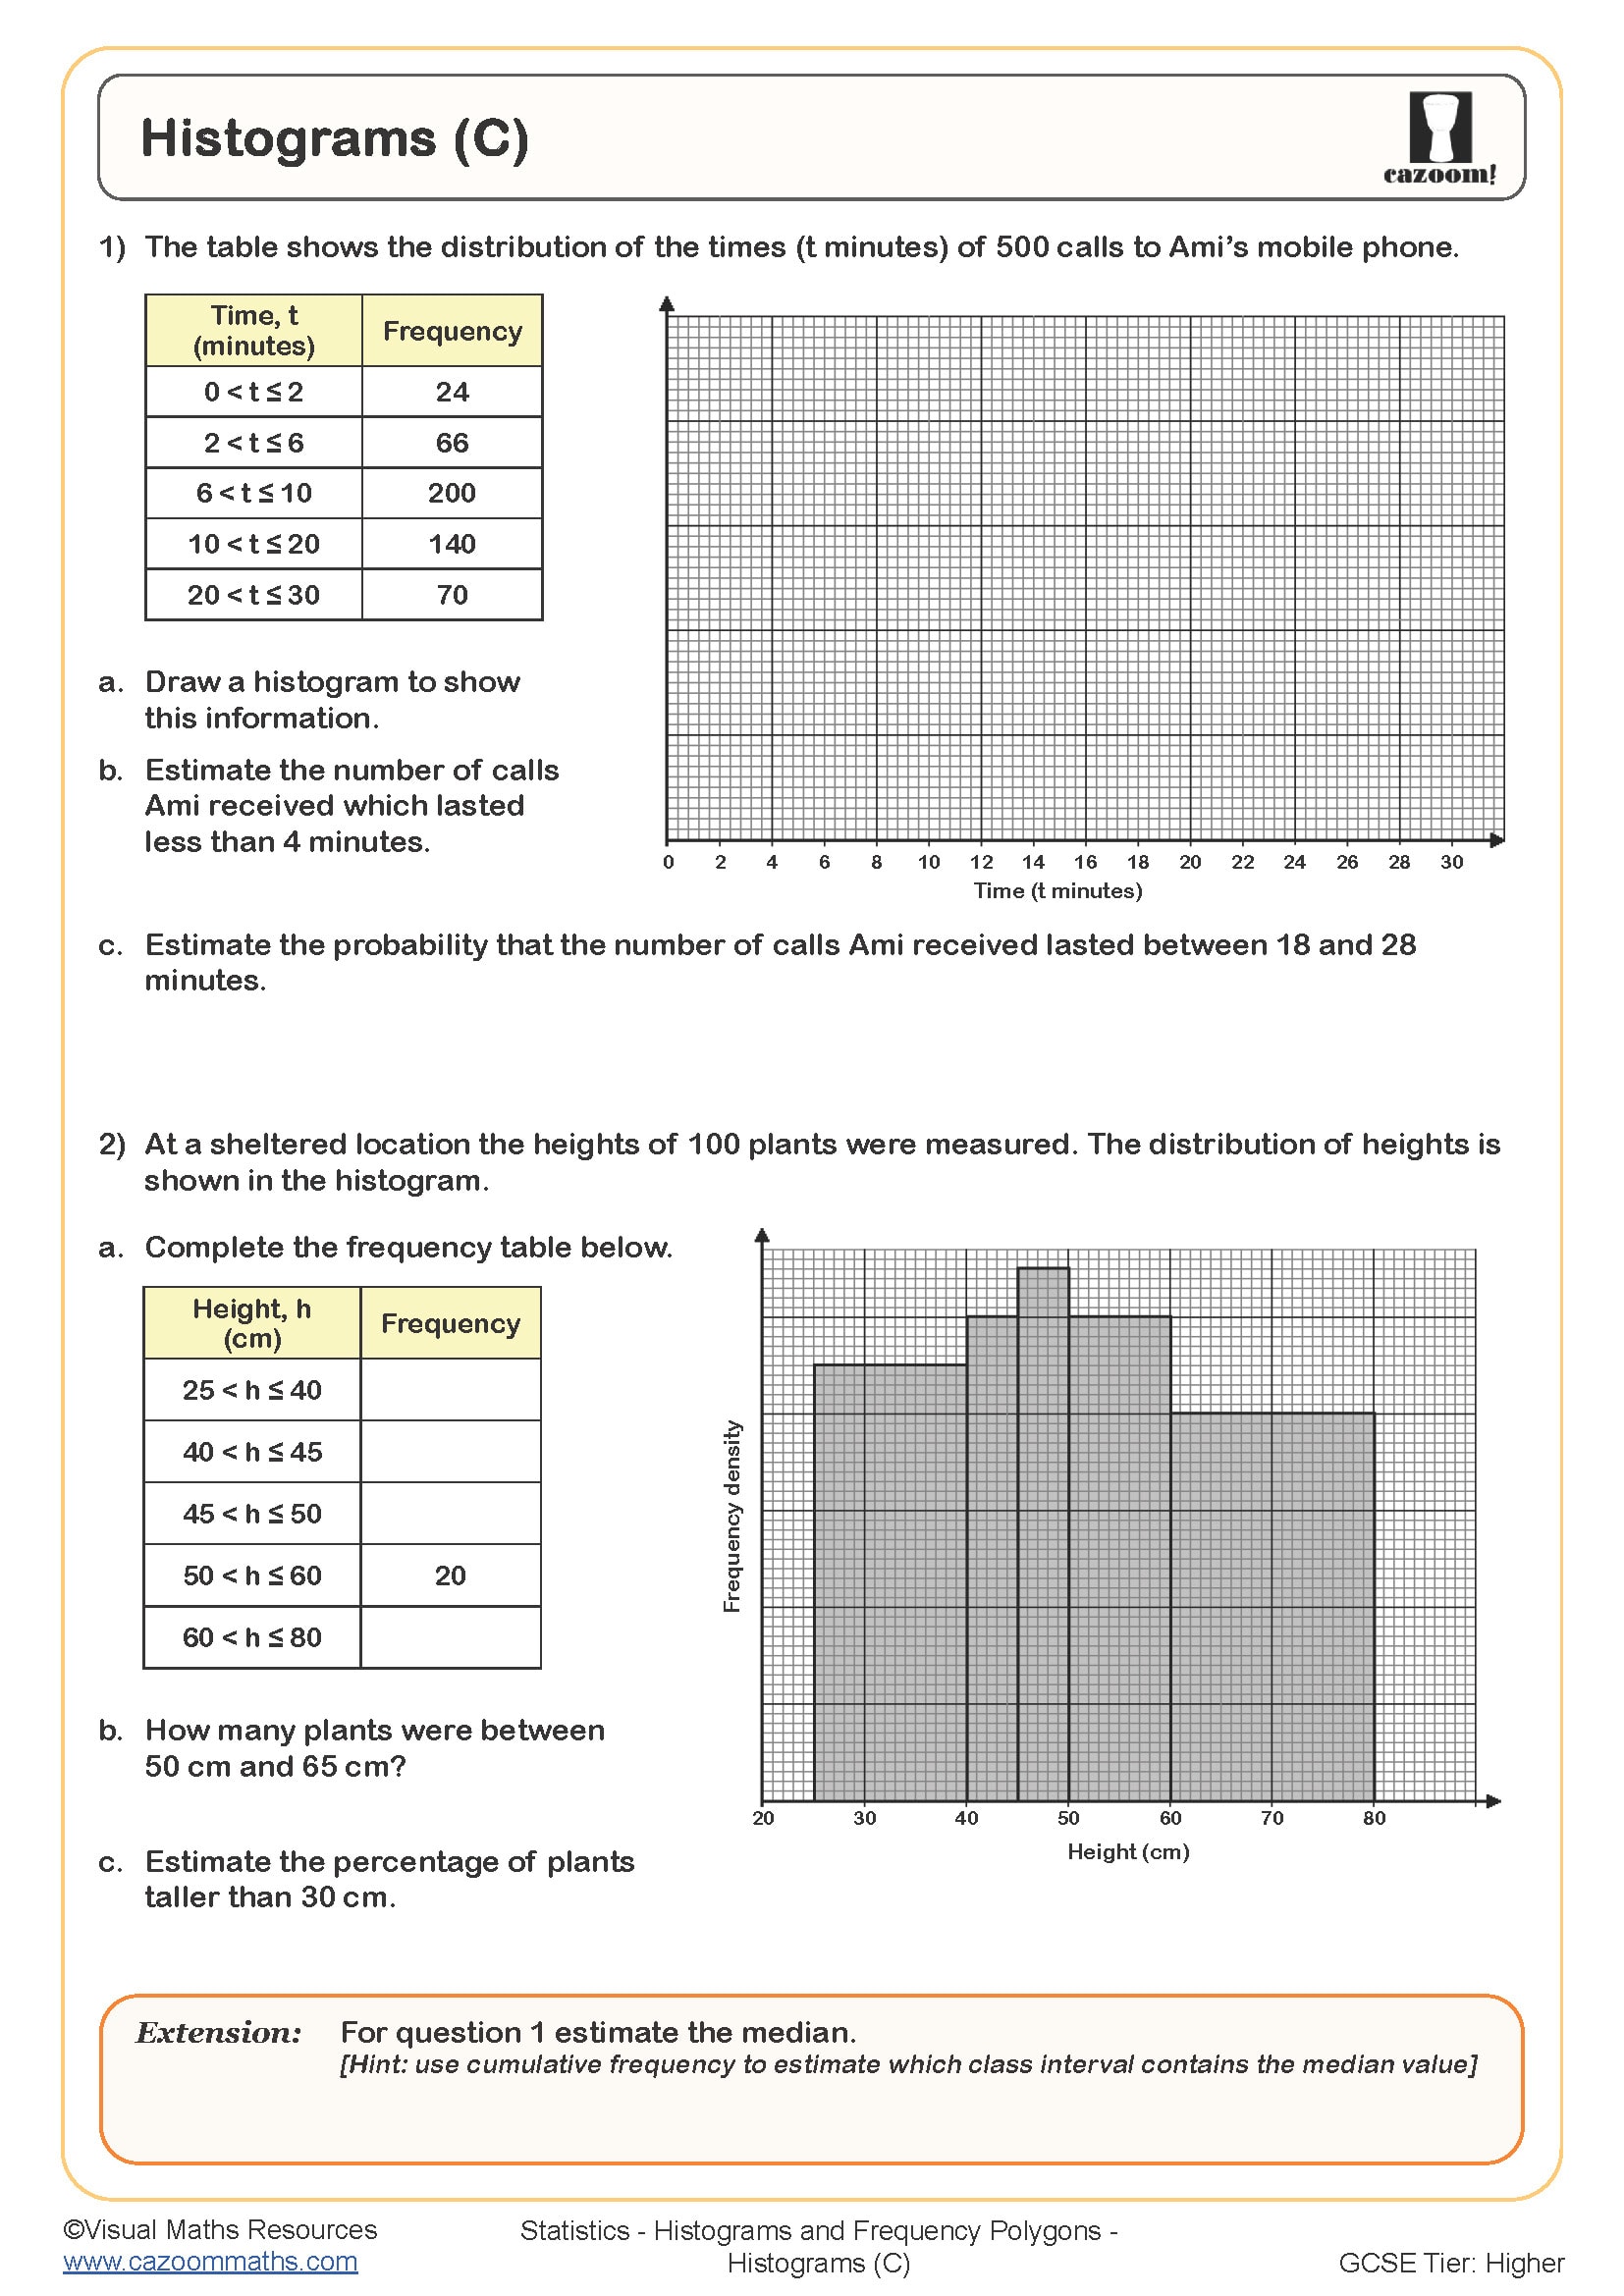
• Frequency Tables and Charts - Constructing and interpreting frequency tables, bar charts, and histograms

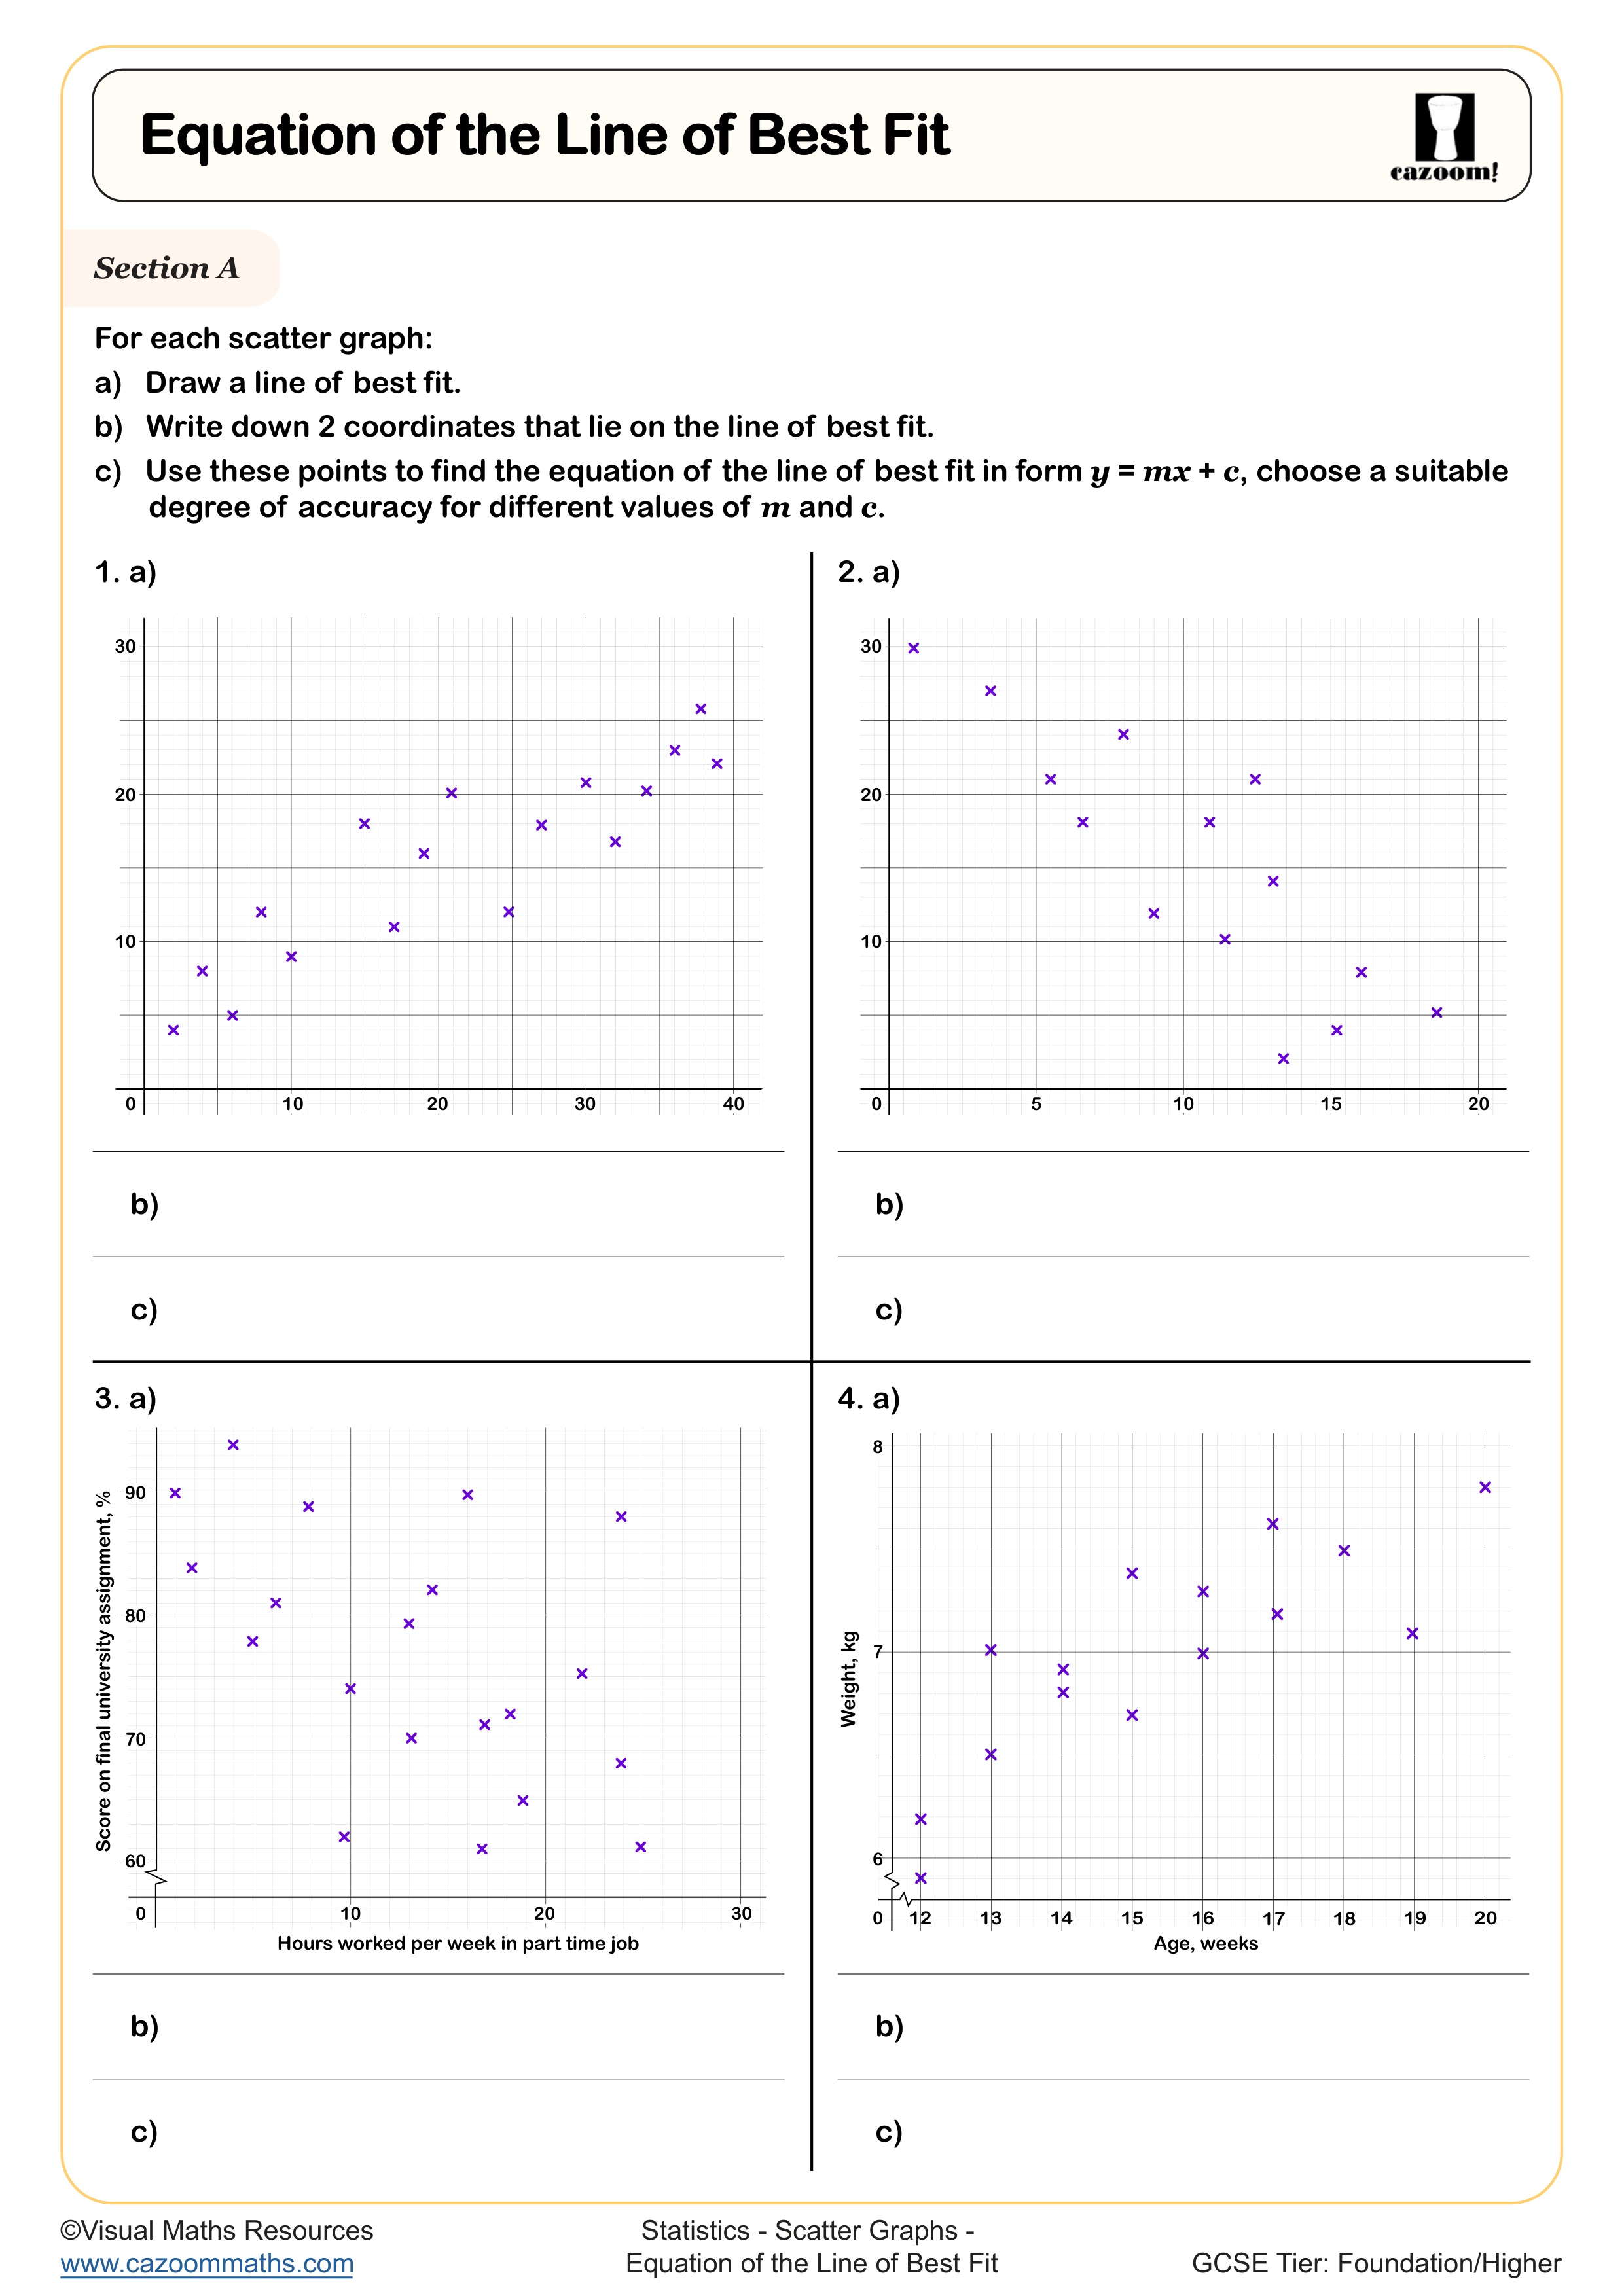
• Scatter Graphs and Correlation - Plotting scatter diagrams, identifying correlation types, and the line of best fit

• Probability Fundamentals - Basic probability calculations, probability trees, and conditional probability

• Statistical Diagrams - Pie charts, stem-and-leaf diagrams, and box plots interpretation

• Data Analysis Projects - Real-world statistical investigations and hypothesis testing basics

Transform Year 11 Statistics Results with Targeted Practice

Here's what we've noticed after years of teaching statistics: students who get regular, focused practice perform significantly better than those who cram before assessments. These worksheets provide that essential repetition without the tedium. Perfect for homework, revision sessions, or cover lessons, they help students build the statistical reasoning skills that GCSE examiners are looking for.

Key benefits teachers report:

• Improved confidence with statistical terminology and notation

• Better understanding of when to use different statistical measures

• Stronger performance in data interpretation questions

• Enhanced problem-solving approaches for unfamiliar contexts

• More accurate calculations under exam pressure

Where Statistics Skills Matter Most - Real Applications Students Actually Encounter

Students always ask, "When will we ever use this?" - and with statistics, we've got brilliant answers! These skills appear across their other GCSE subjects, from analysing experimental data in science to interpreting historical trends in the humanities. It's actually quite satisfying when students start spotting statistical concepts in news articles and sports coverage (they do mention it to us).

Statistics connect directly to:

• Psychology coursework and data analysis

• Geography fieldwork and demographic studies

• Business studies, market research, and trends

• Science practical investigations and results

• Economics data interpretation and forecasting

• Media studies, audience research, and surveys