Year 7 Bar Models Worksheets
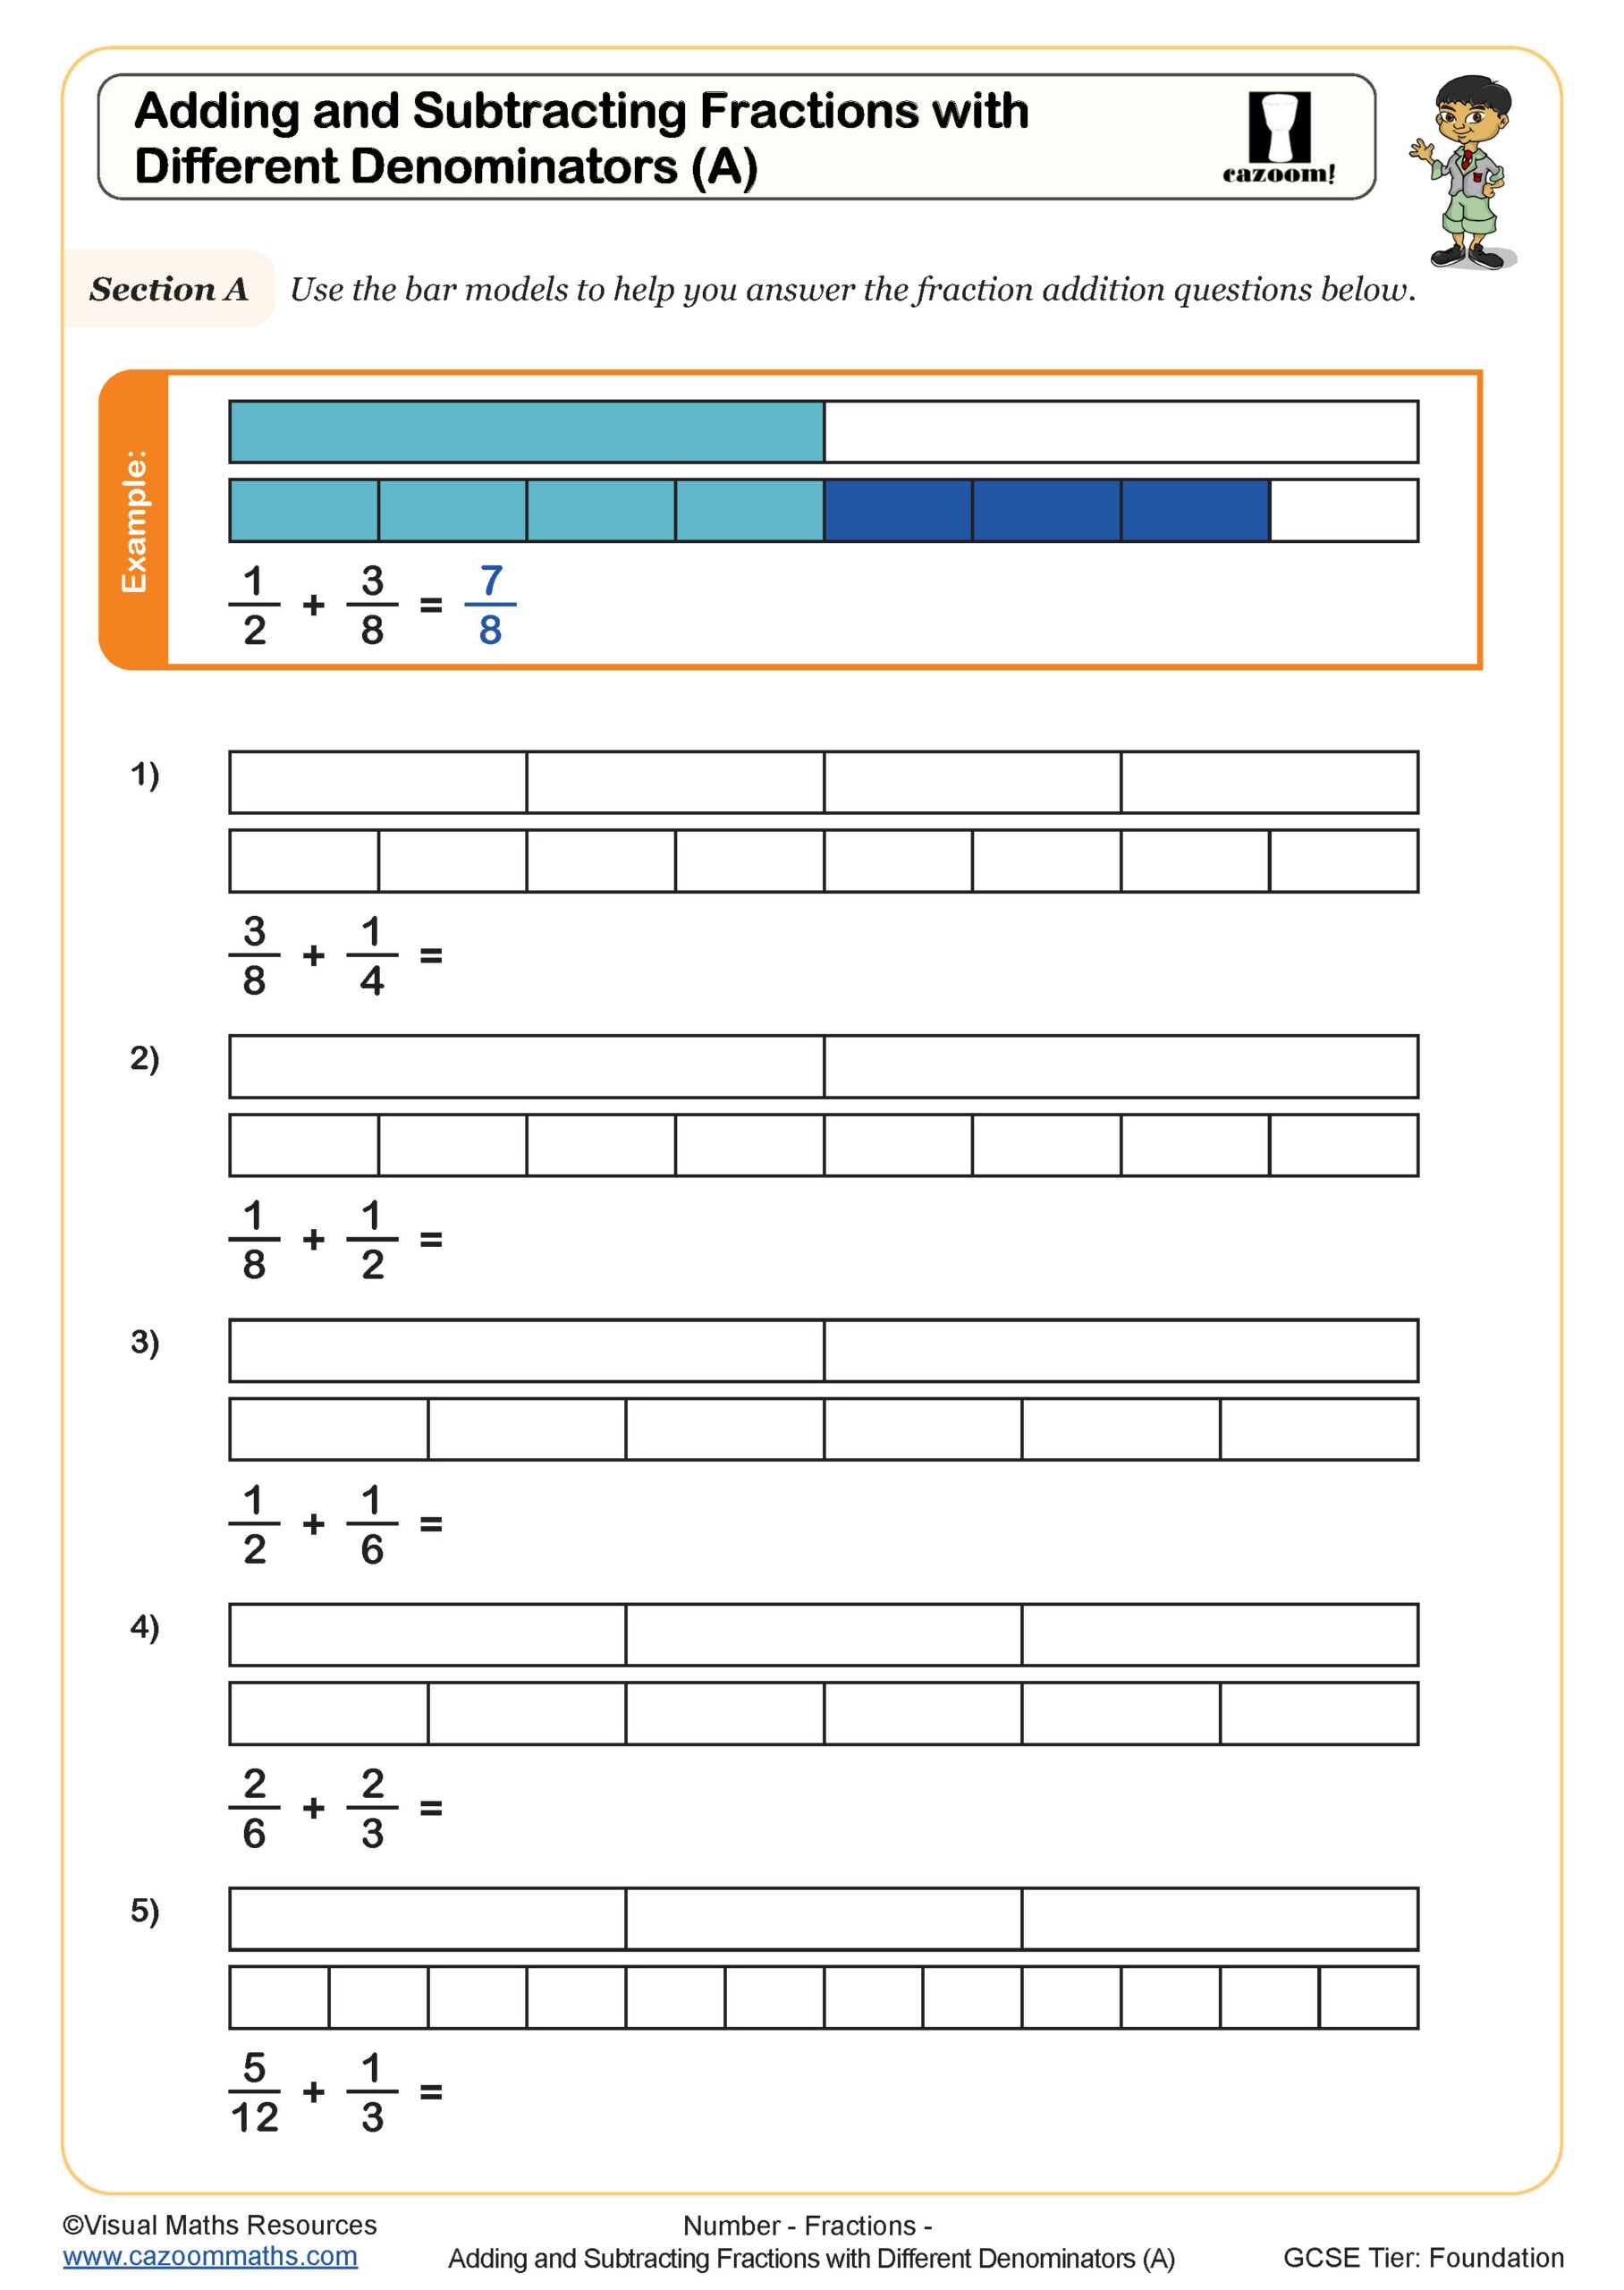
Adding and subtracting fractions with different denominators (A)
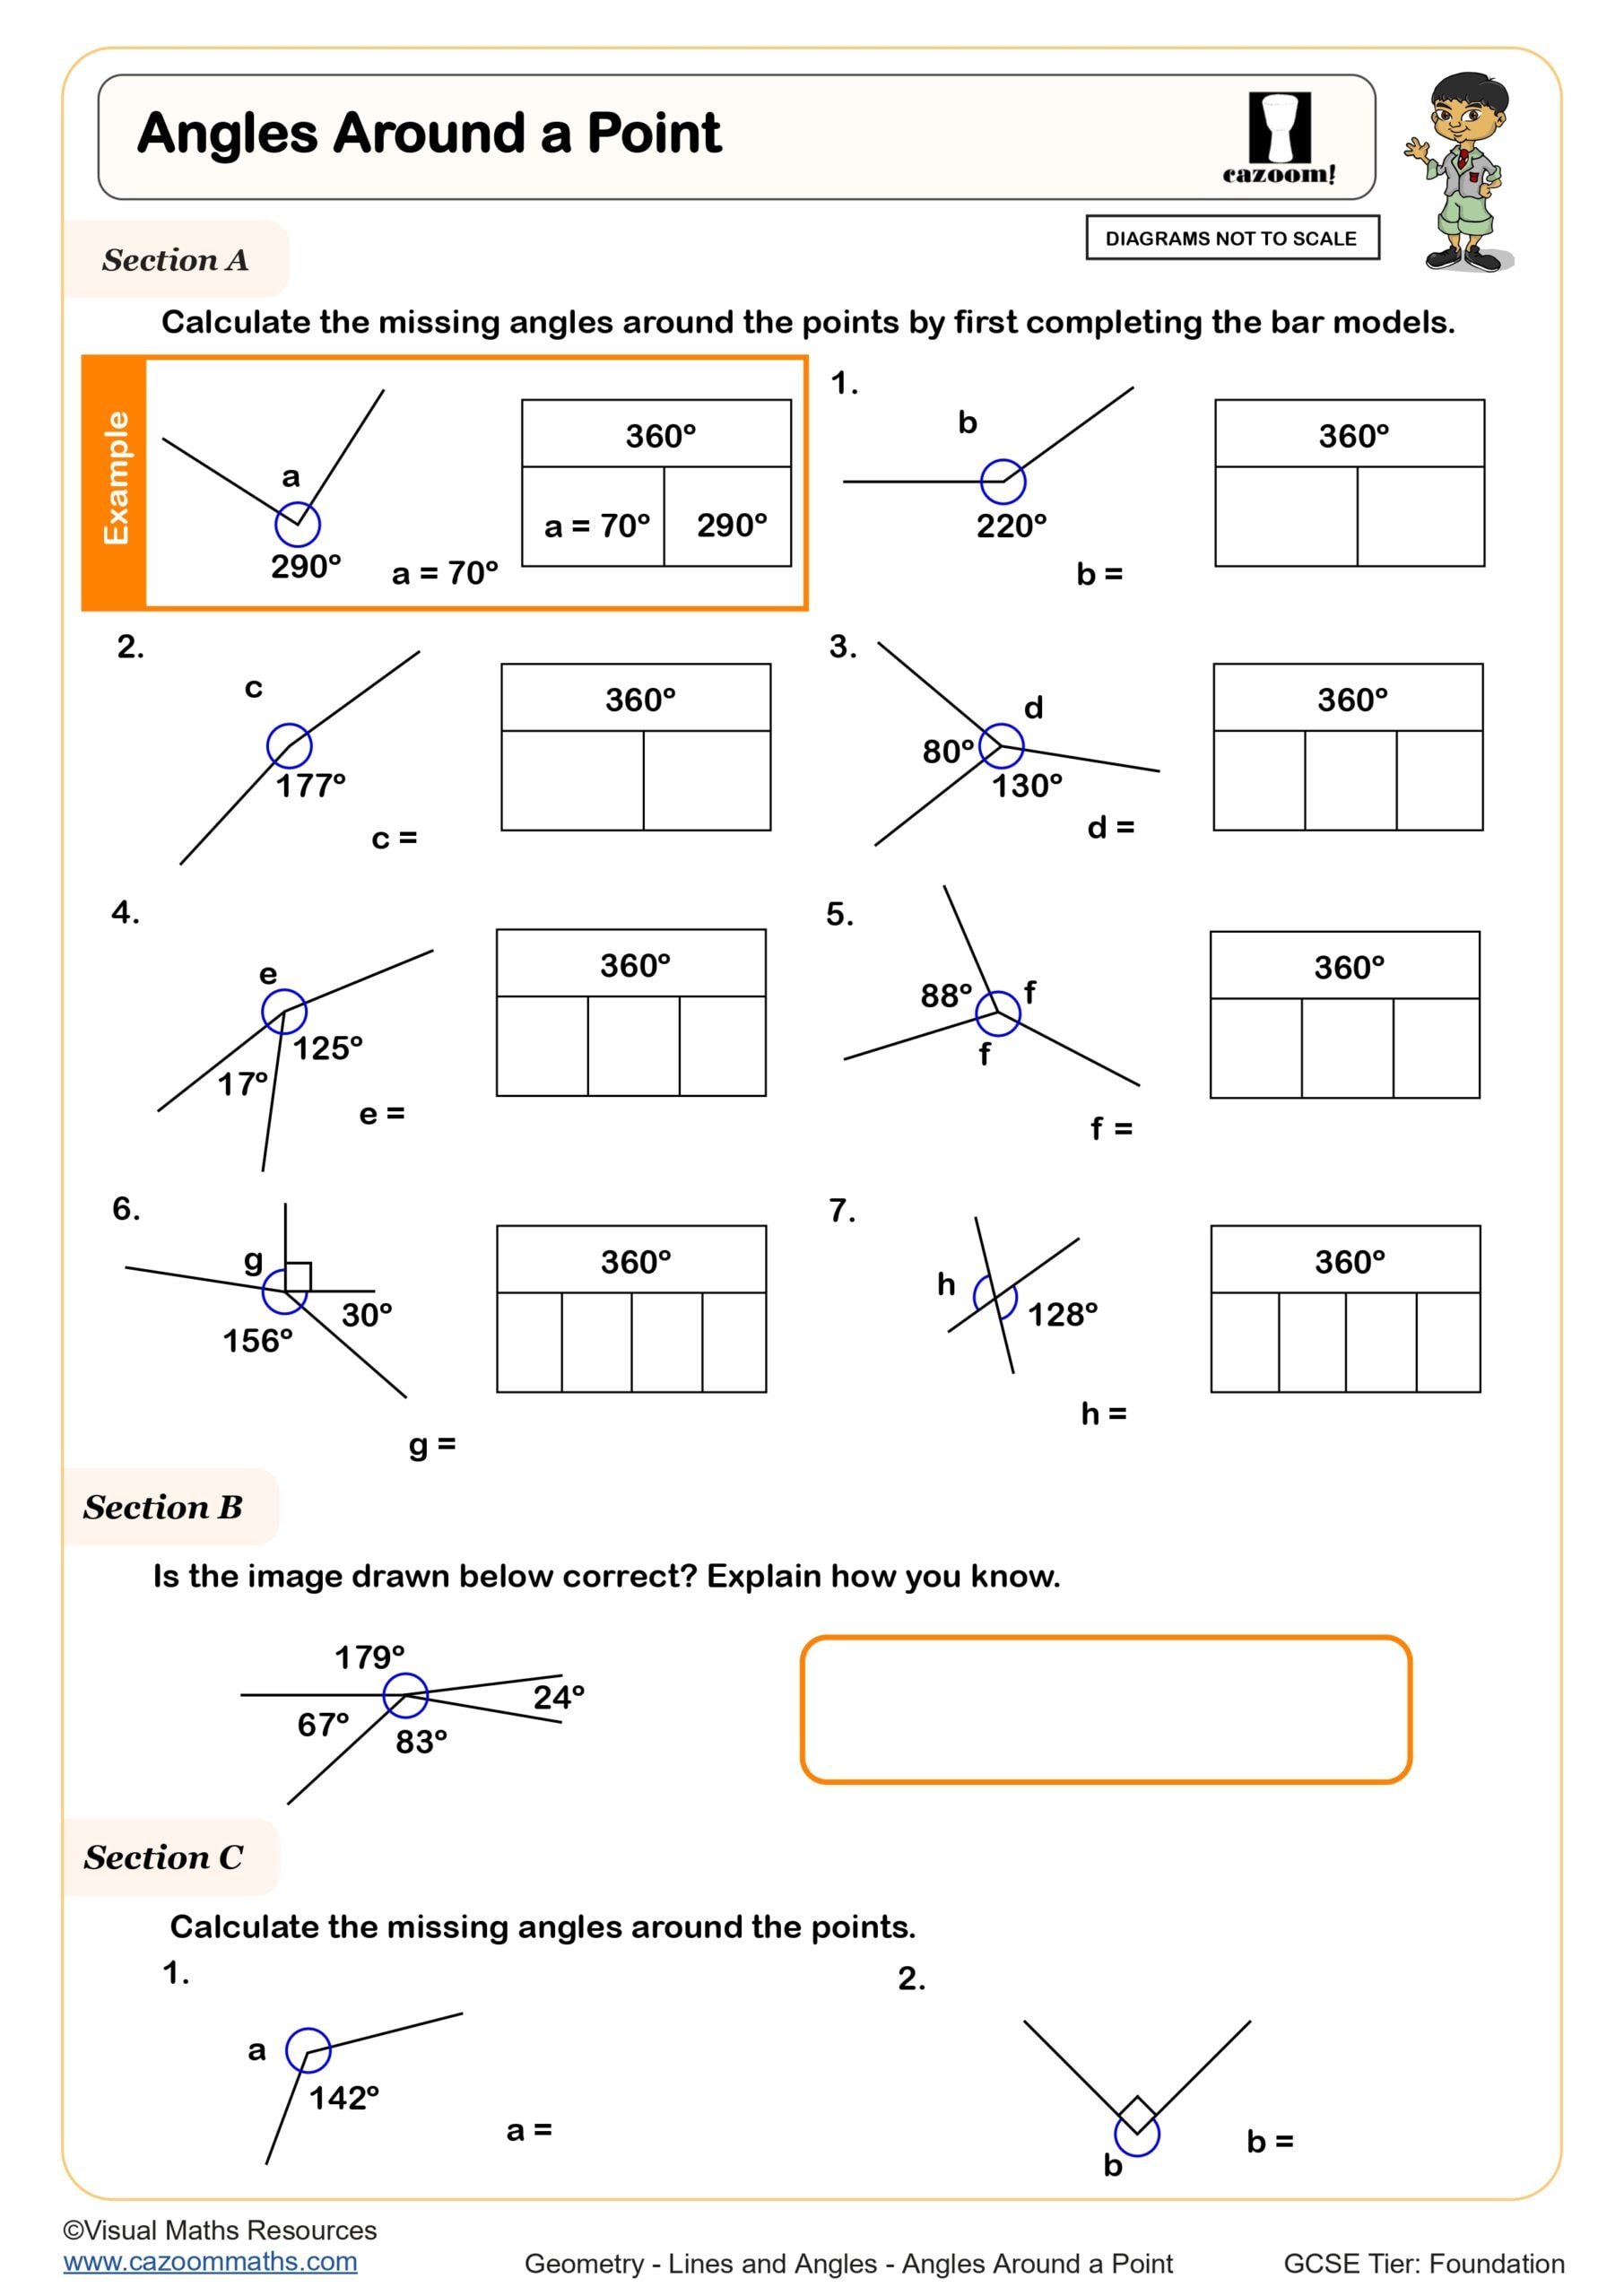
Angles Around a Point
Angles in Triangles (A)
-Worksheet.jpg?w=3840)
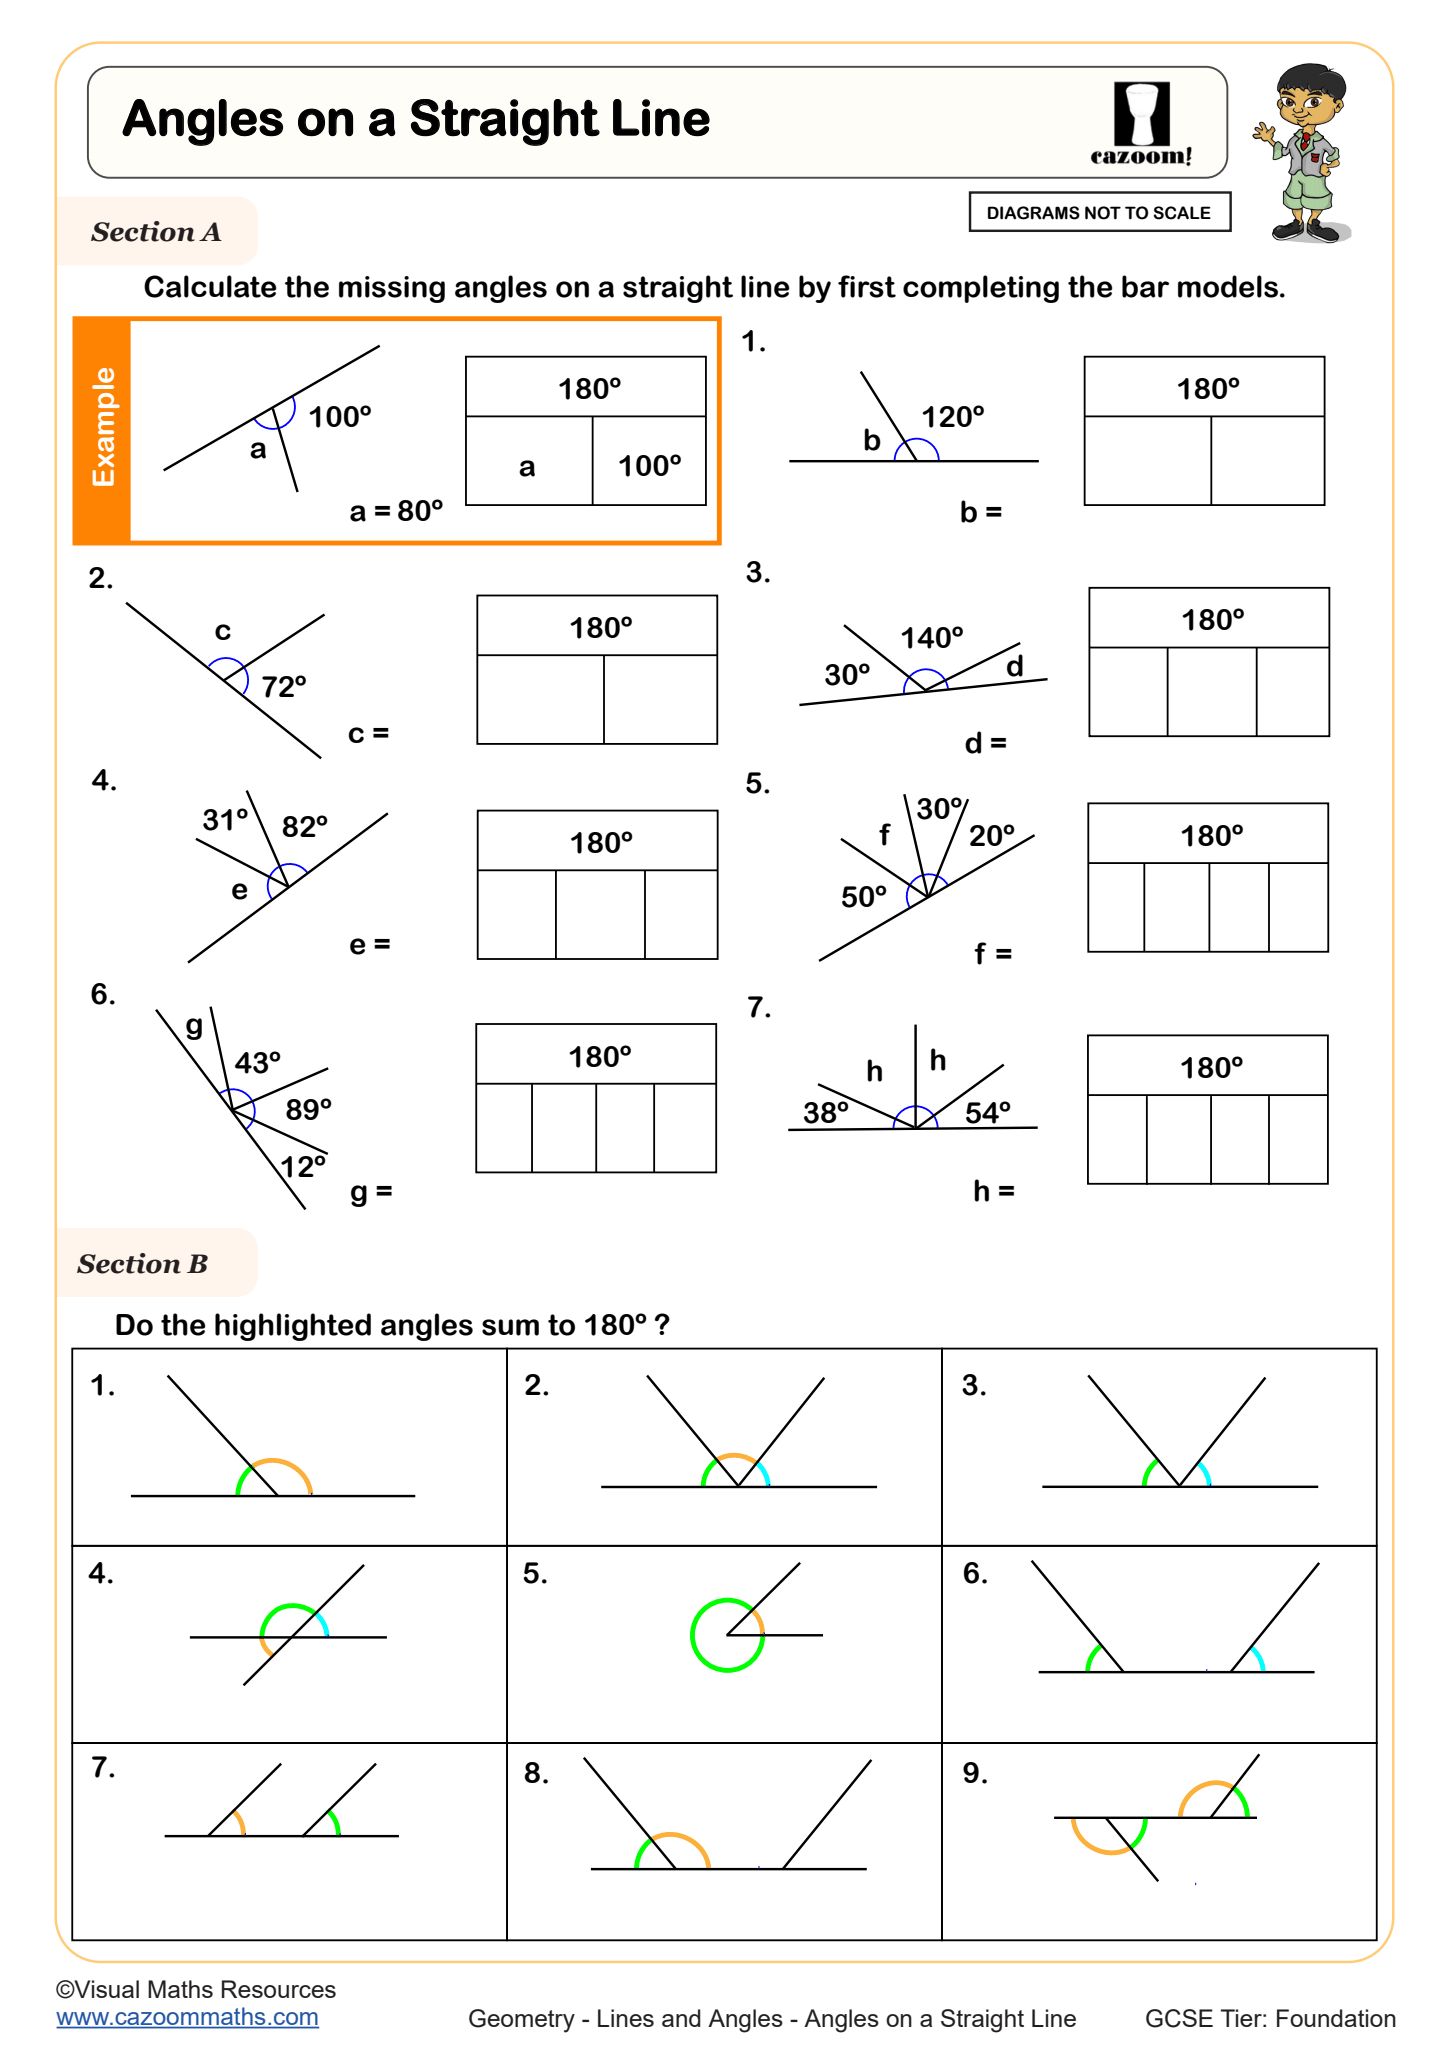
Angles on a Straight Line
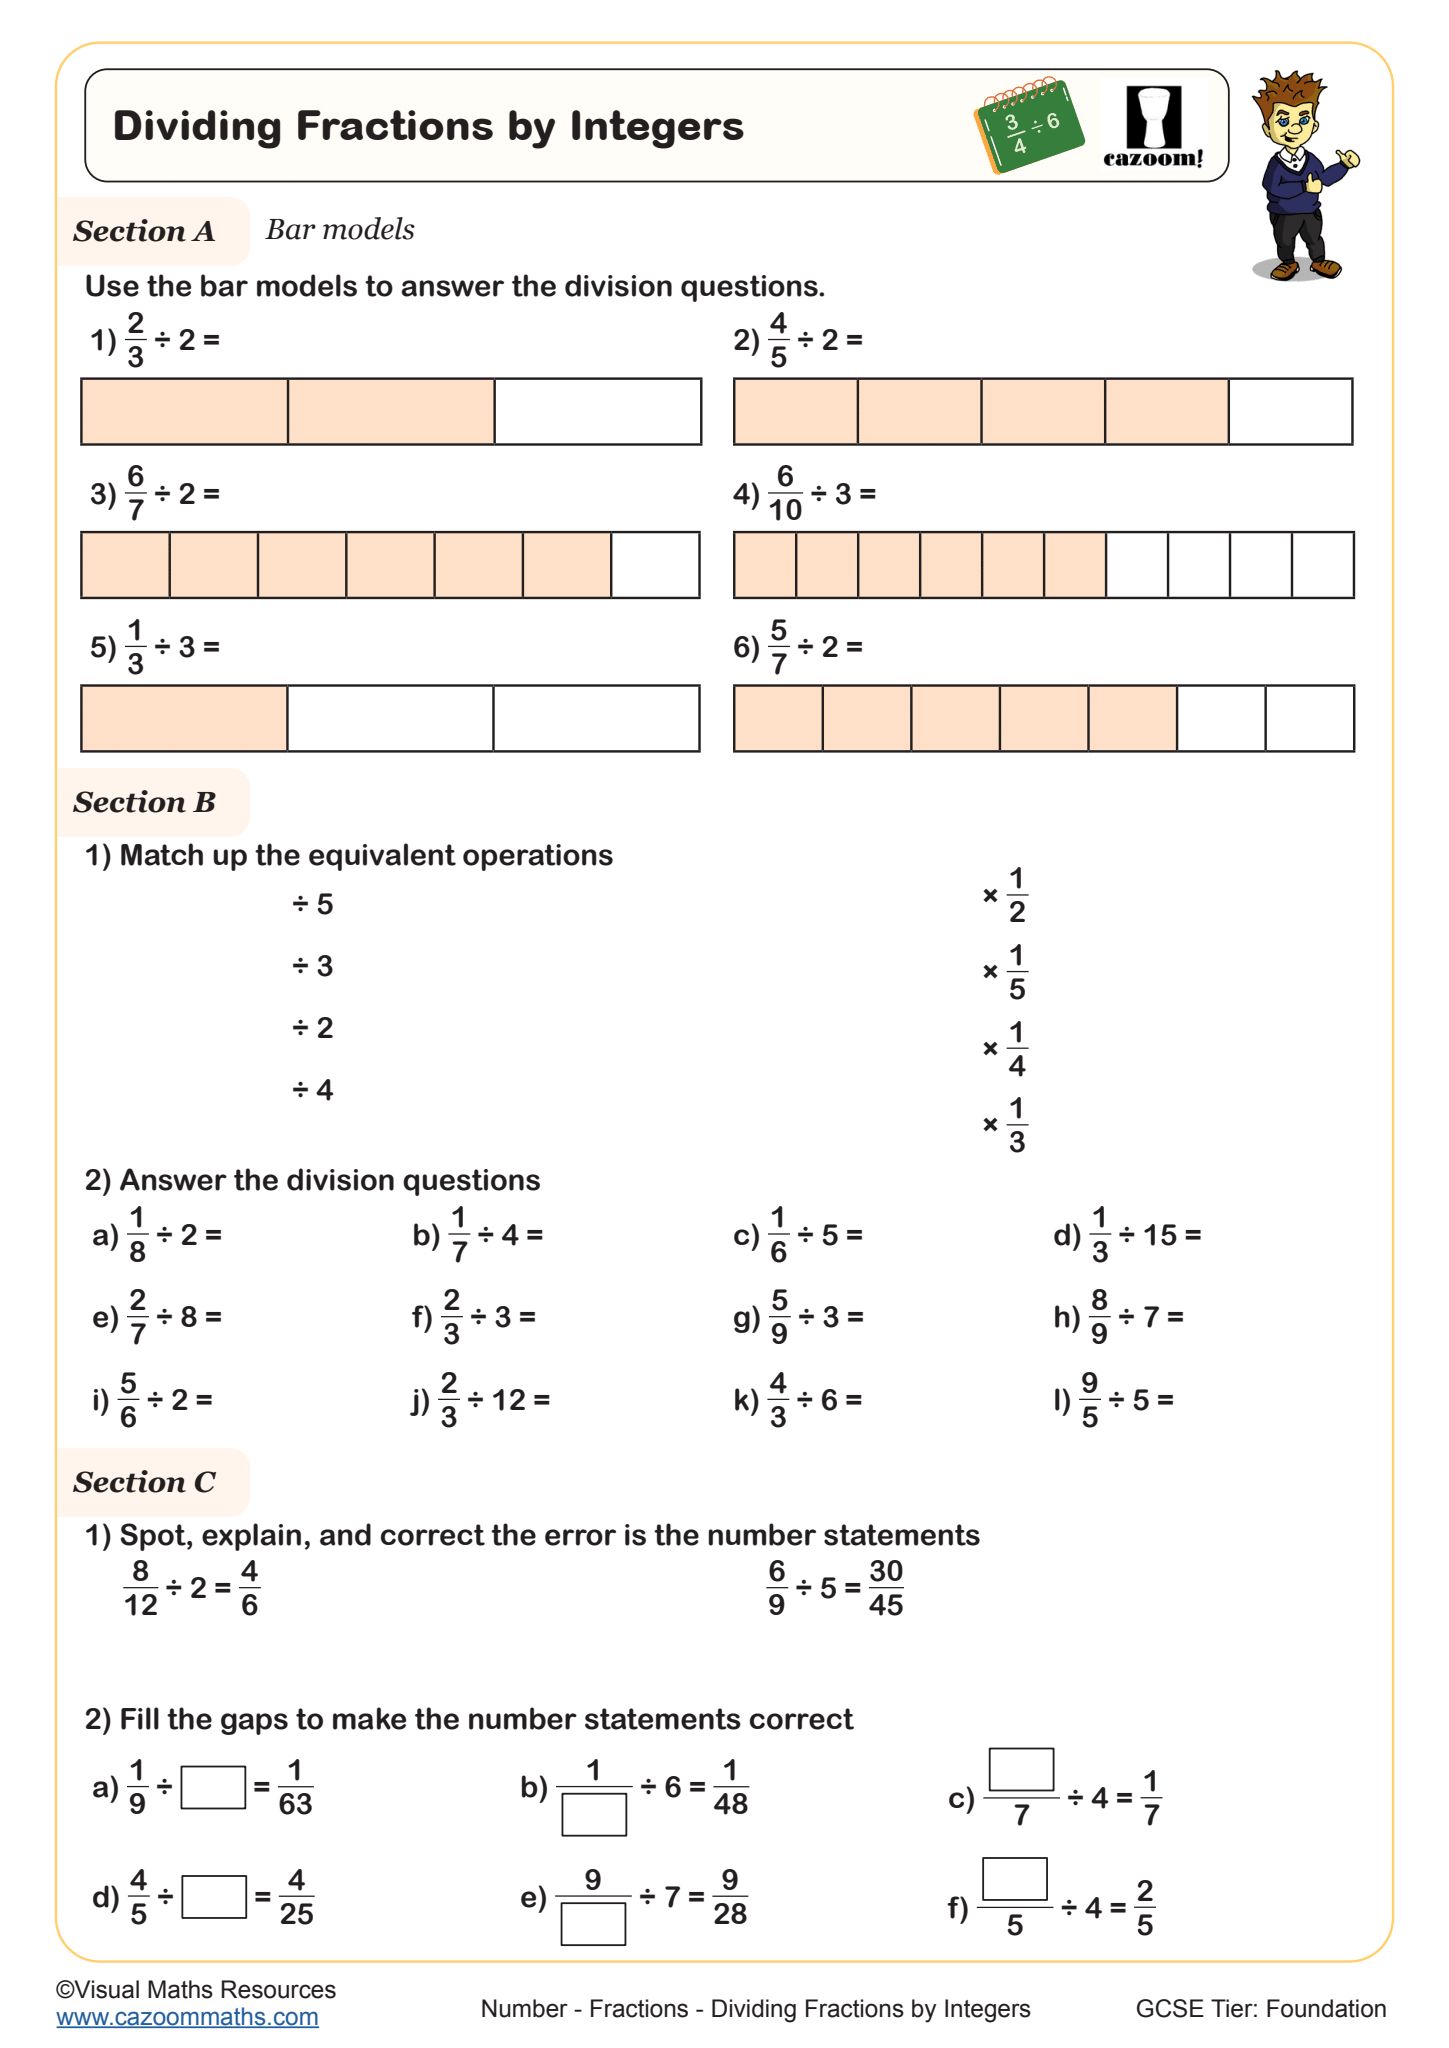
Dividing Fractions by Integers
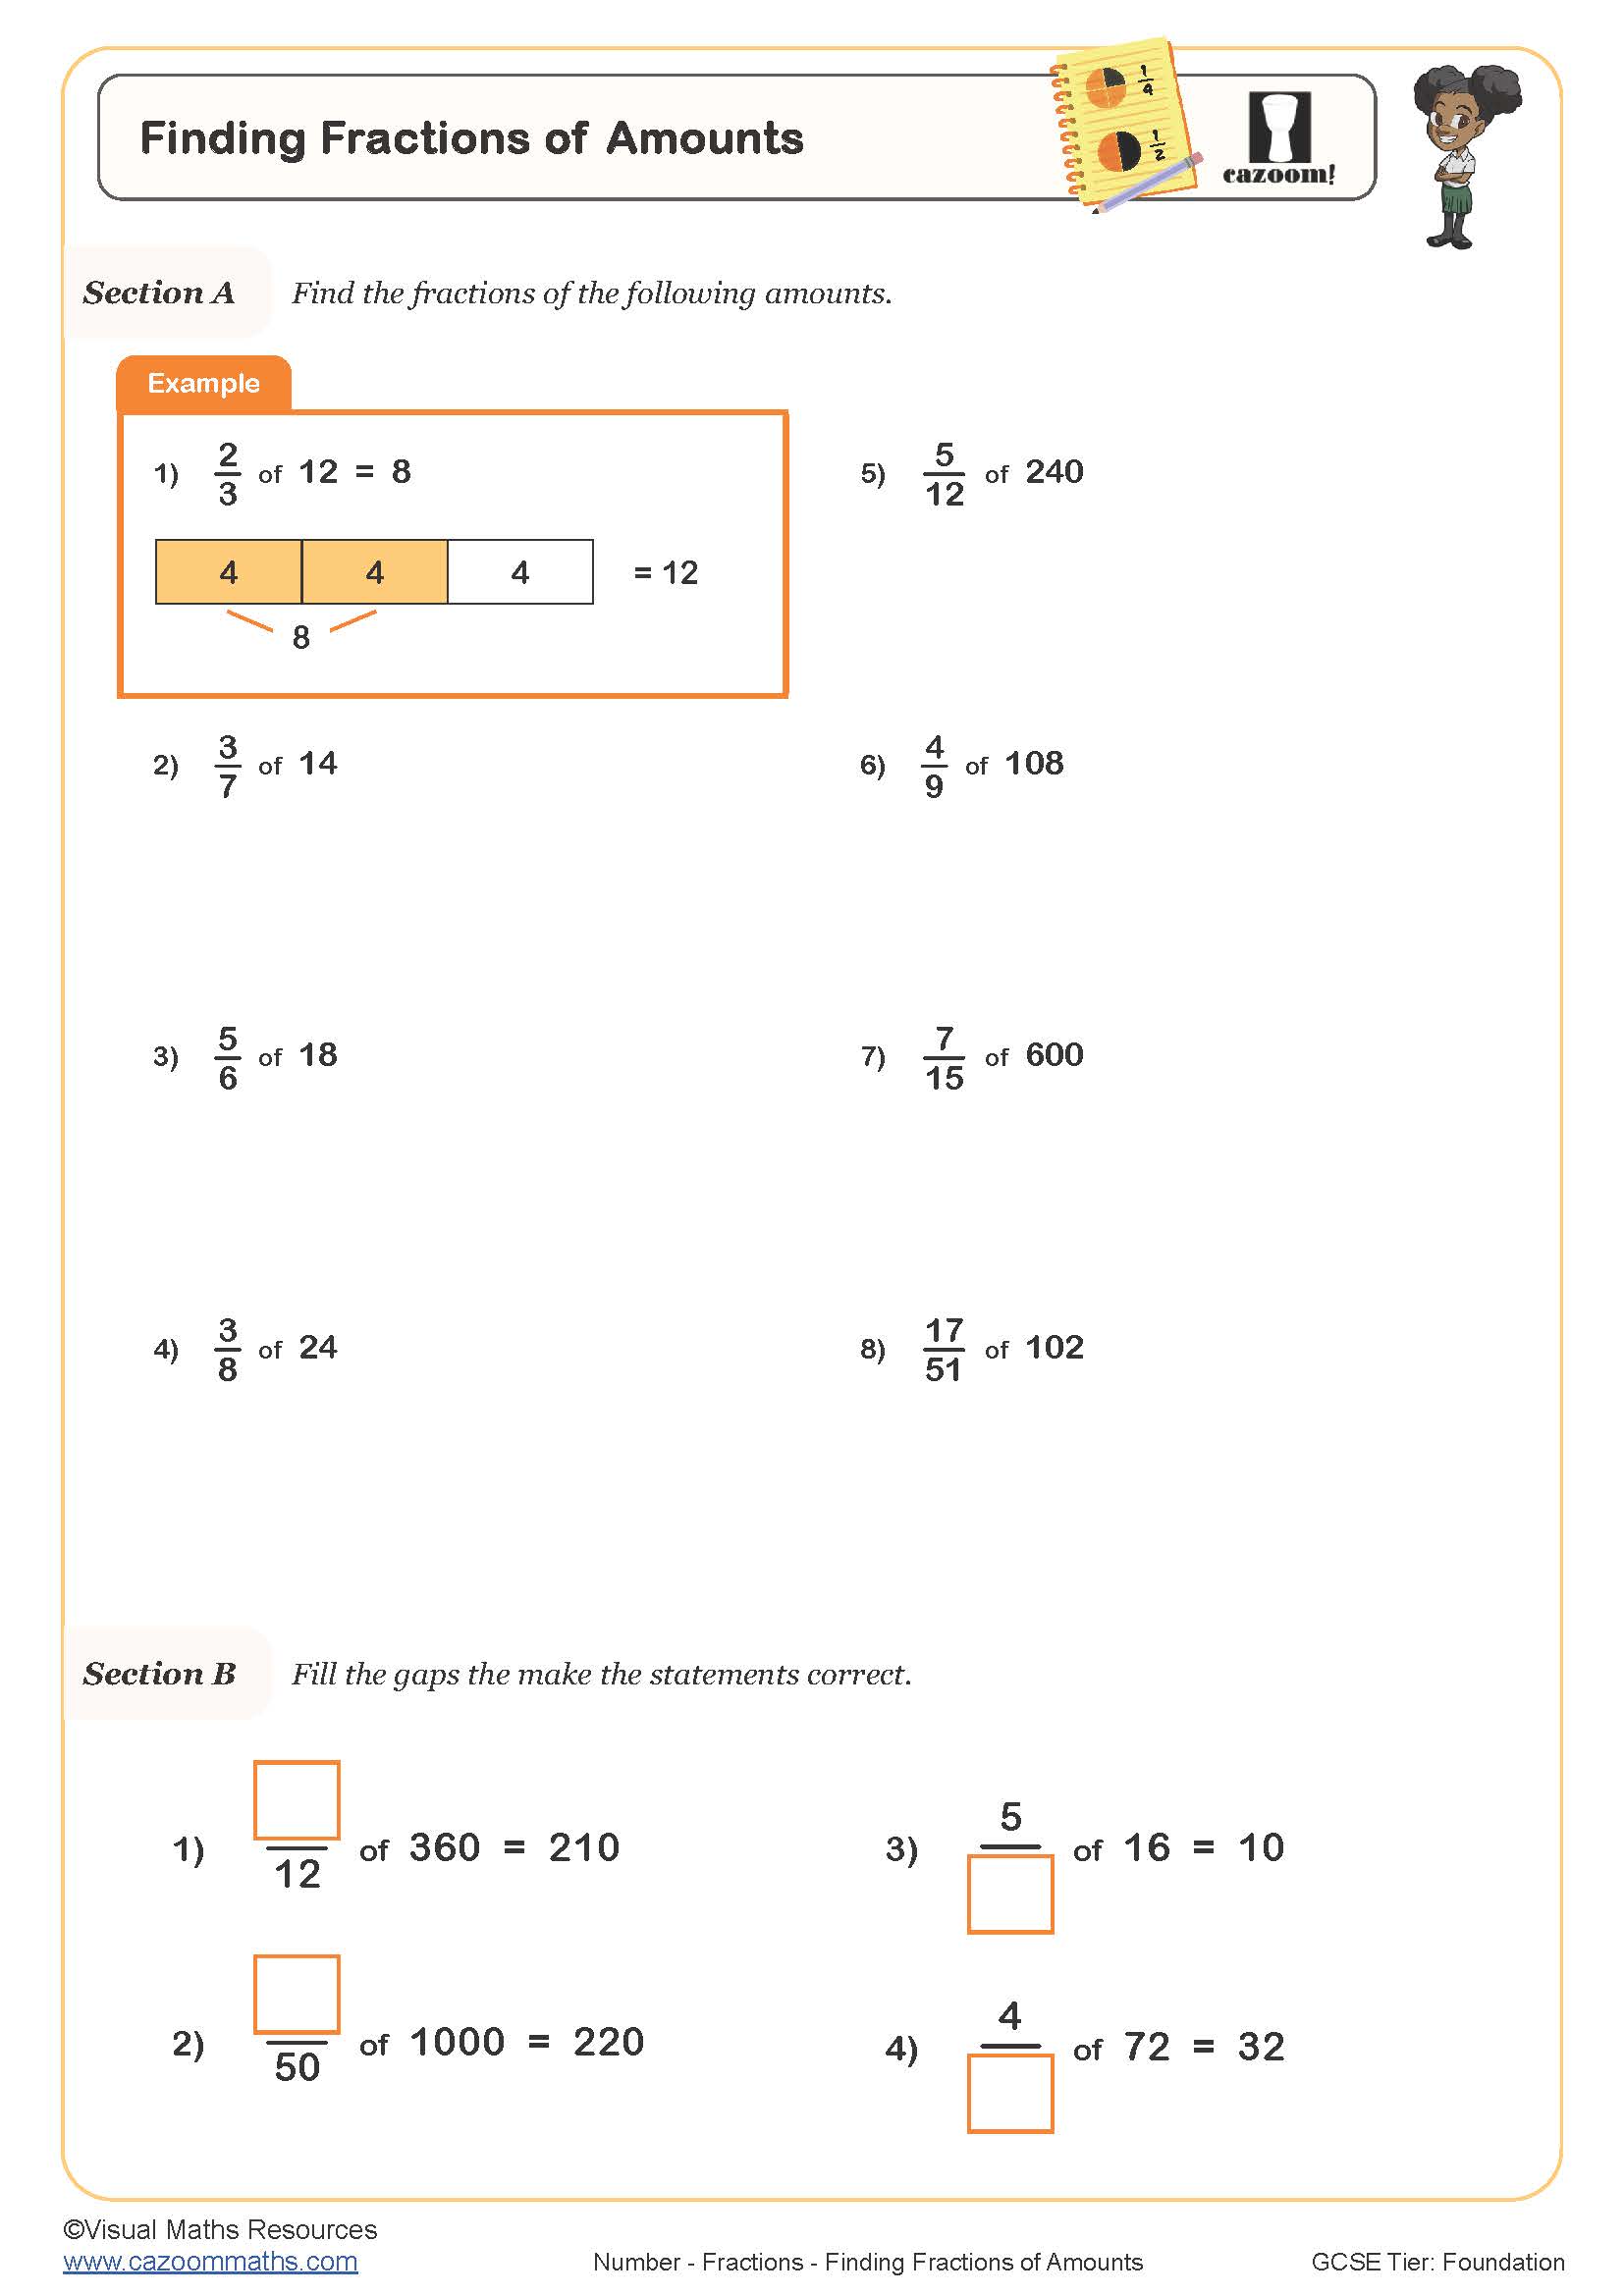
Finding Fractions of Amounts
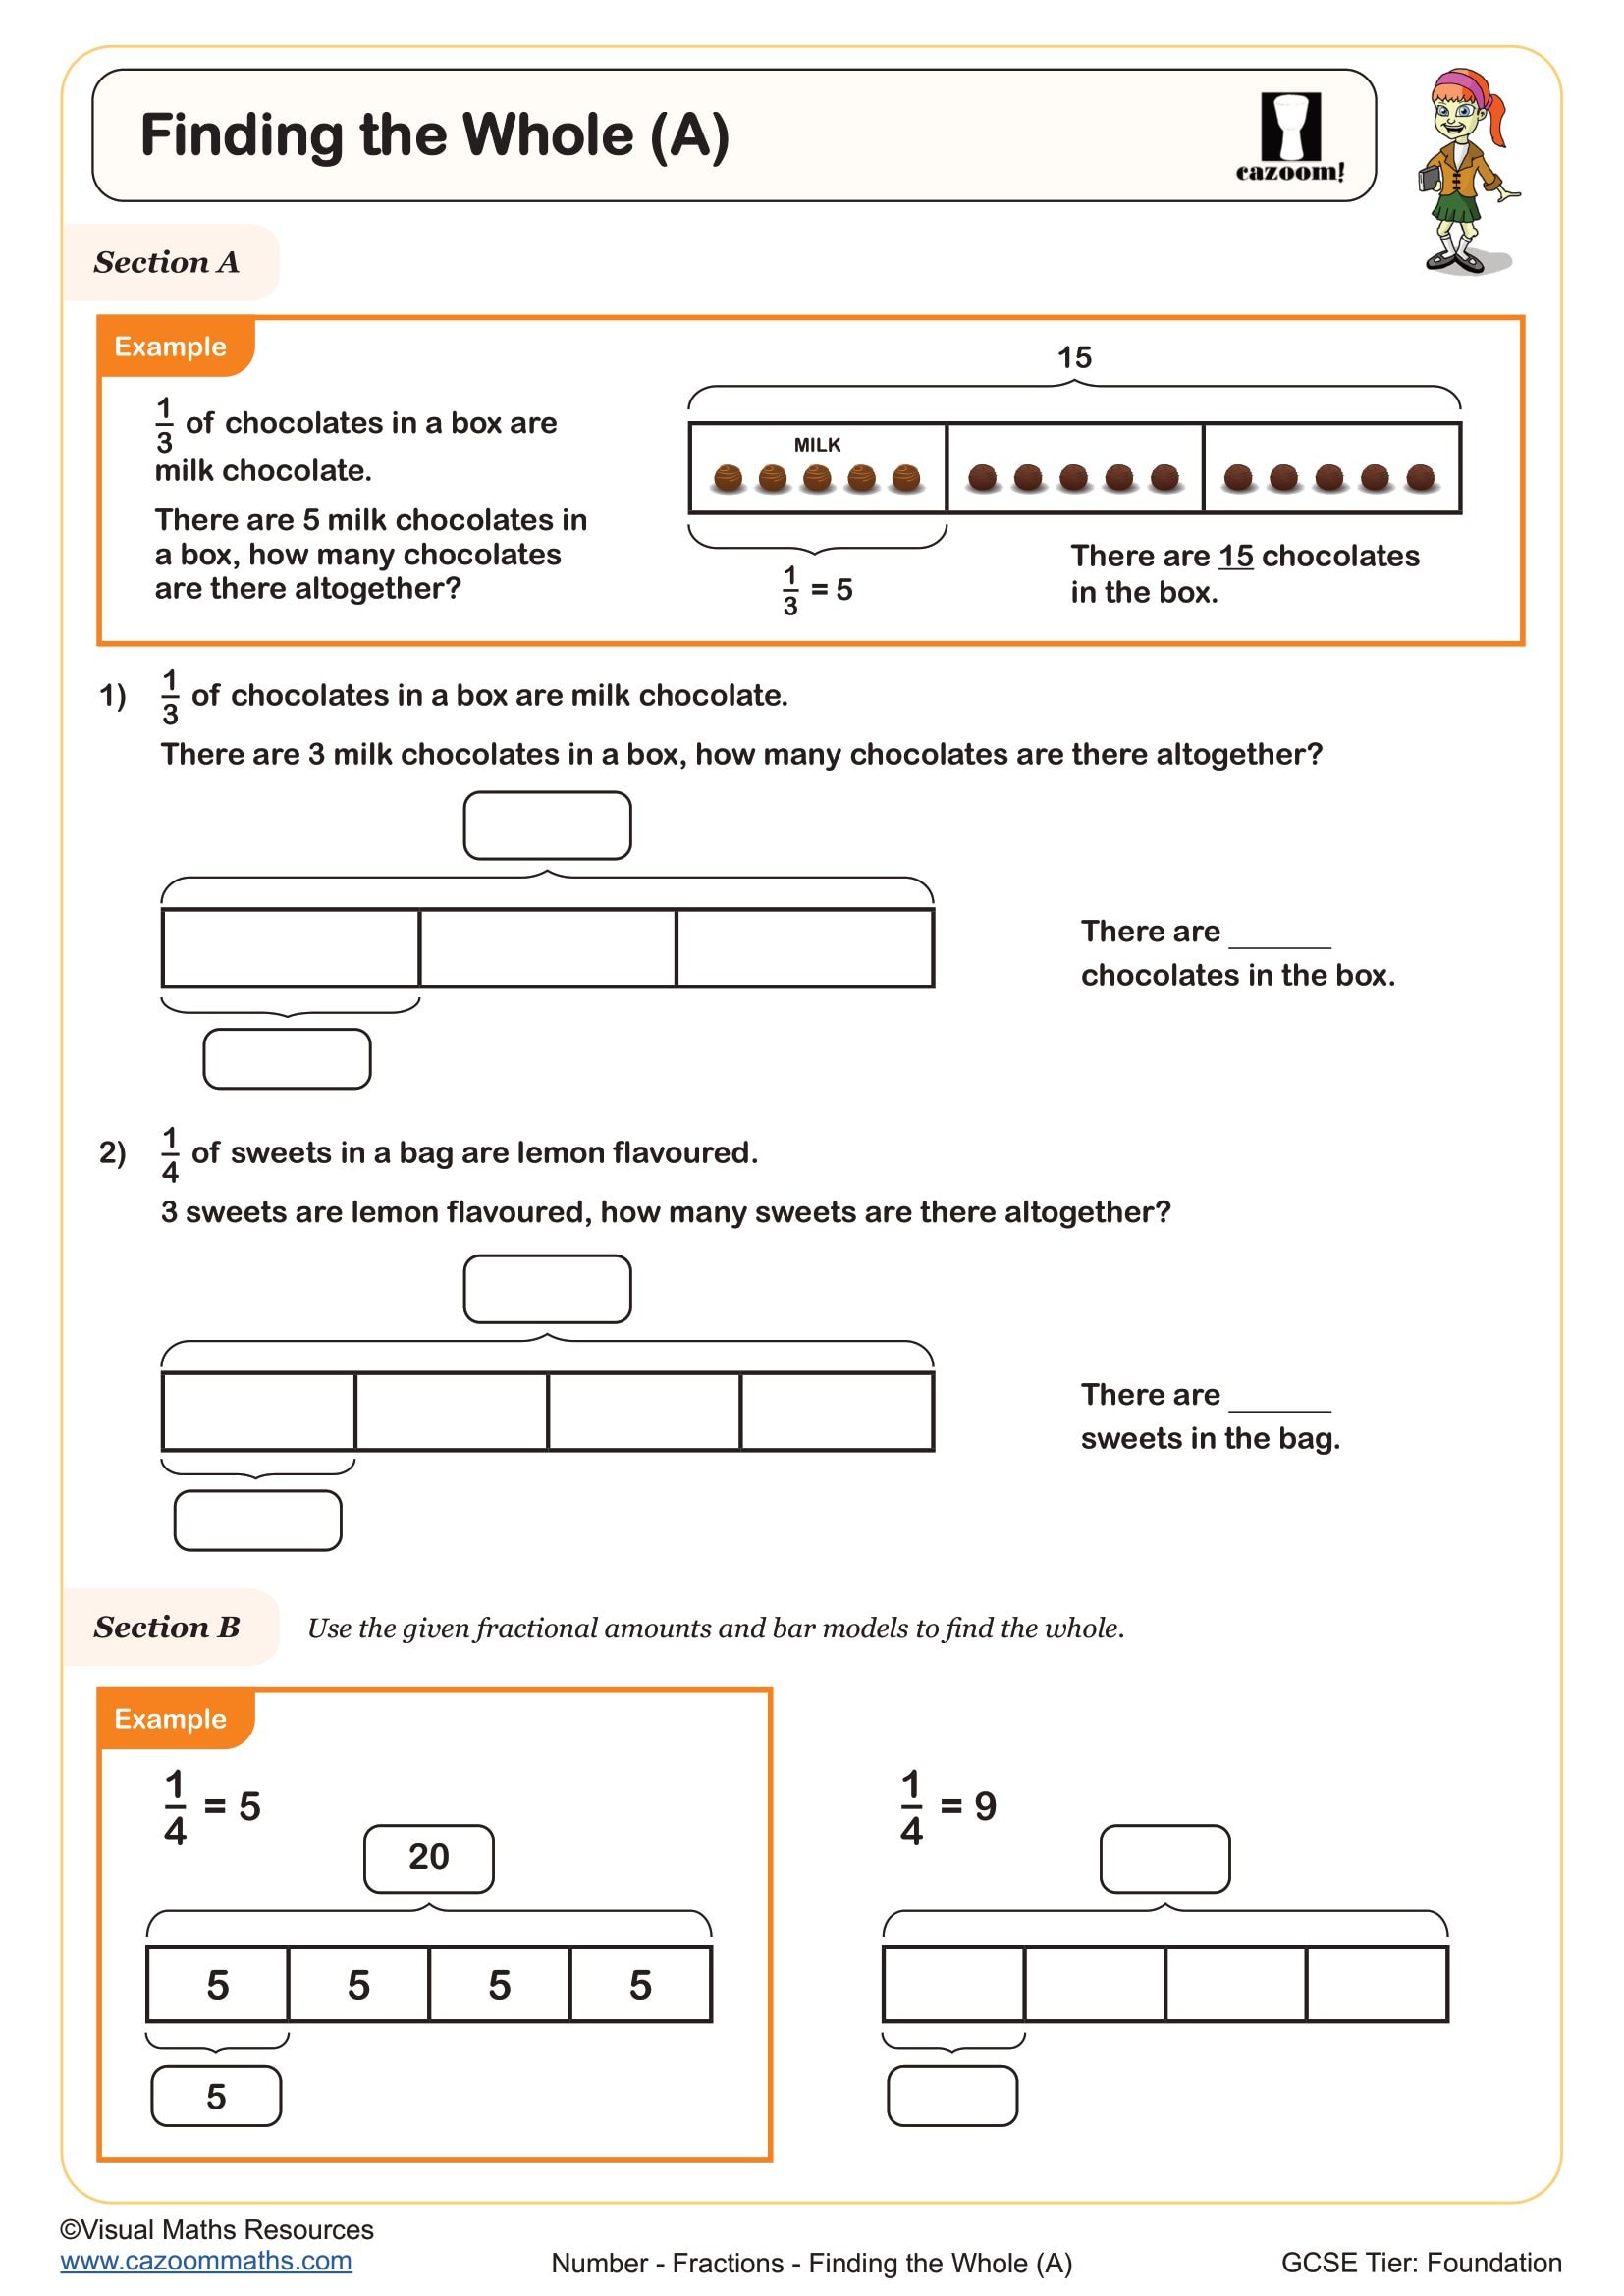
Finding the Whole (A)
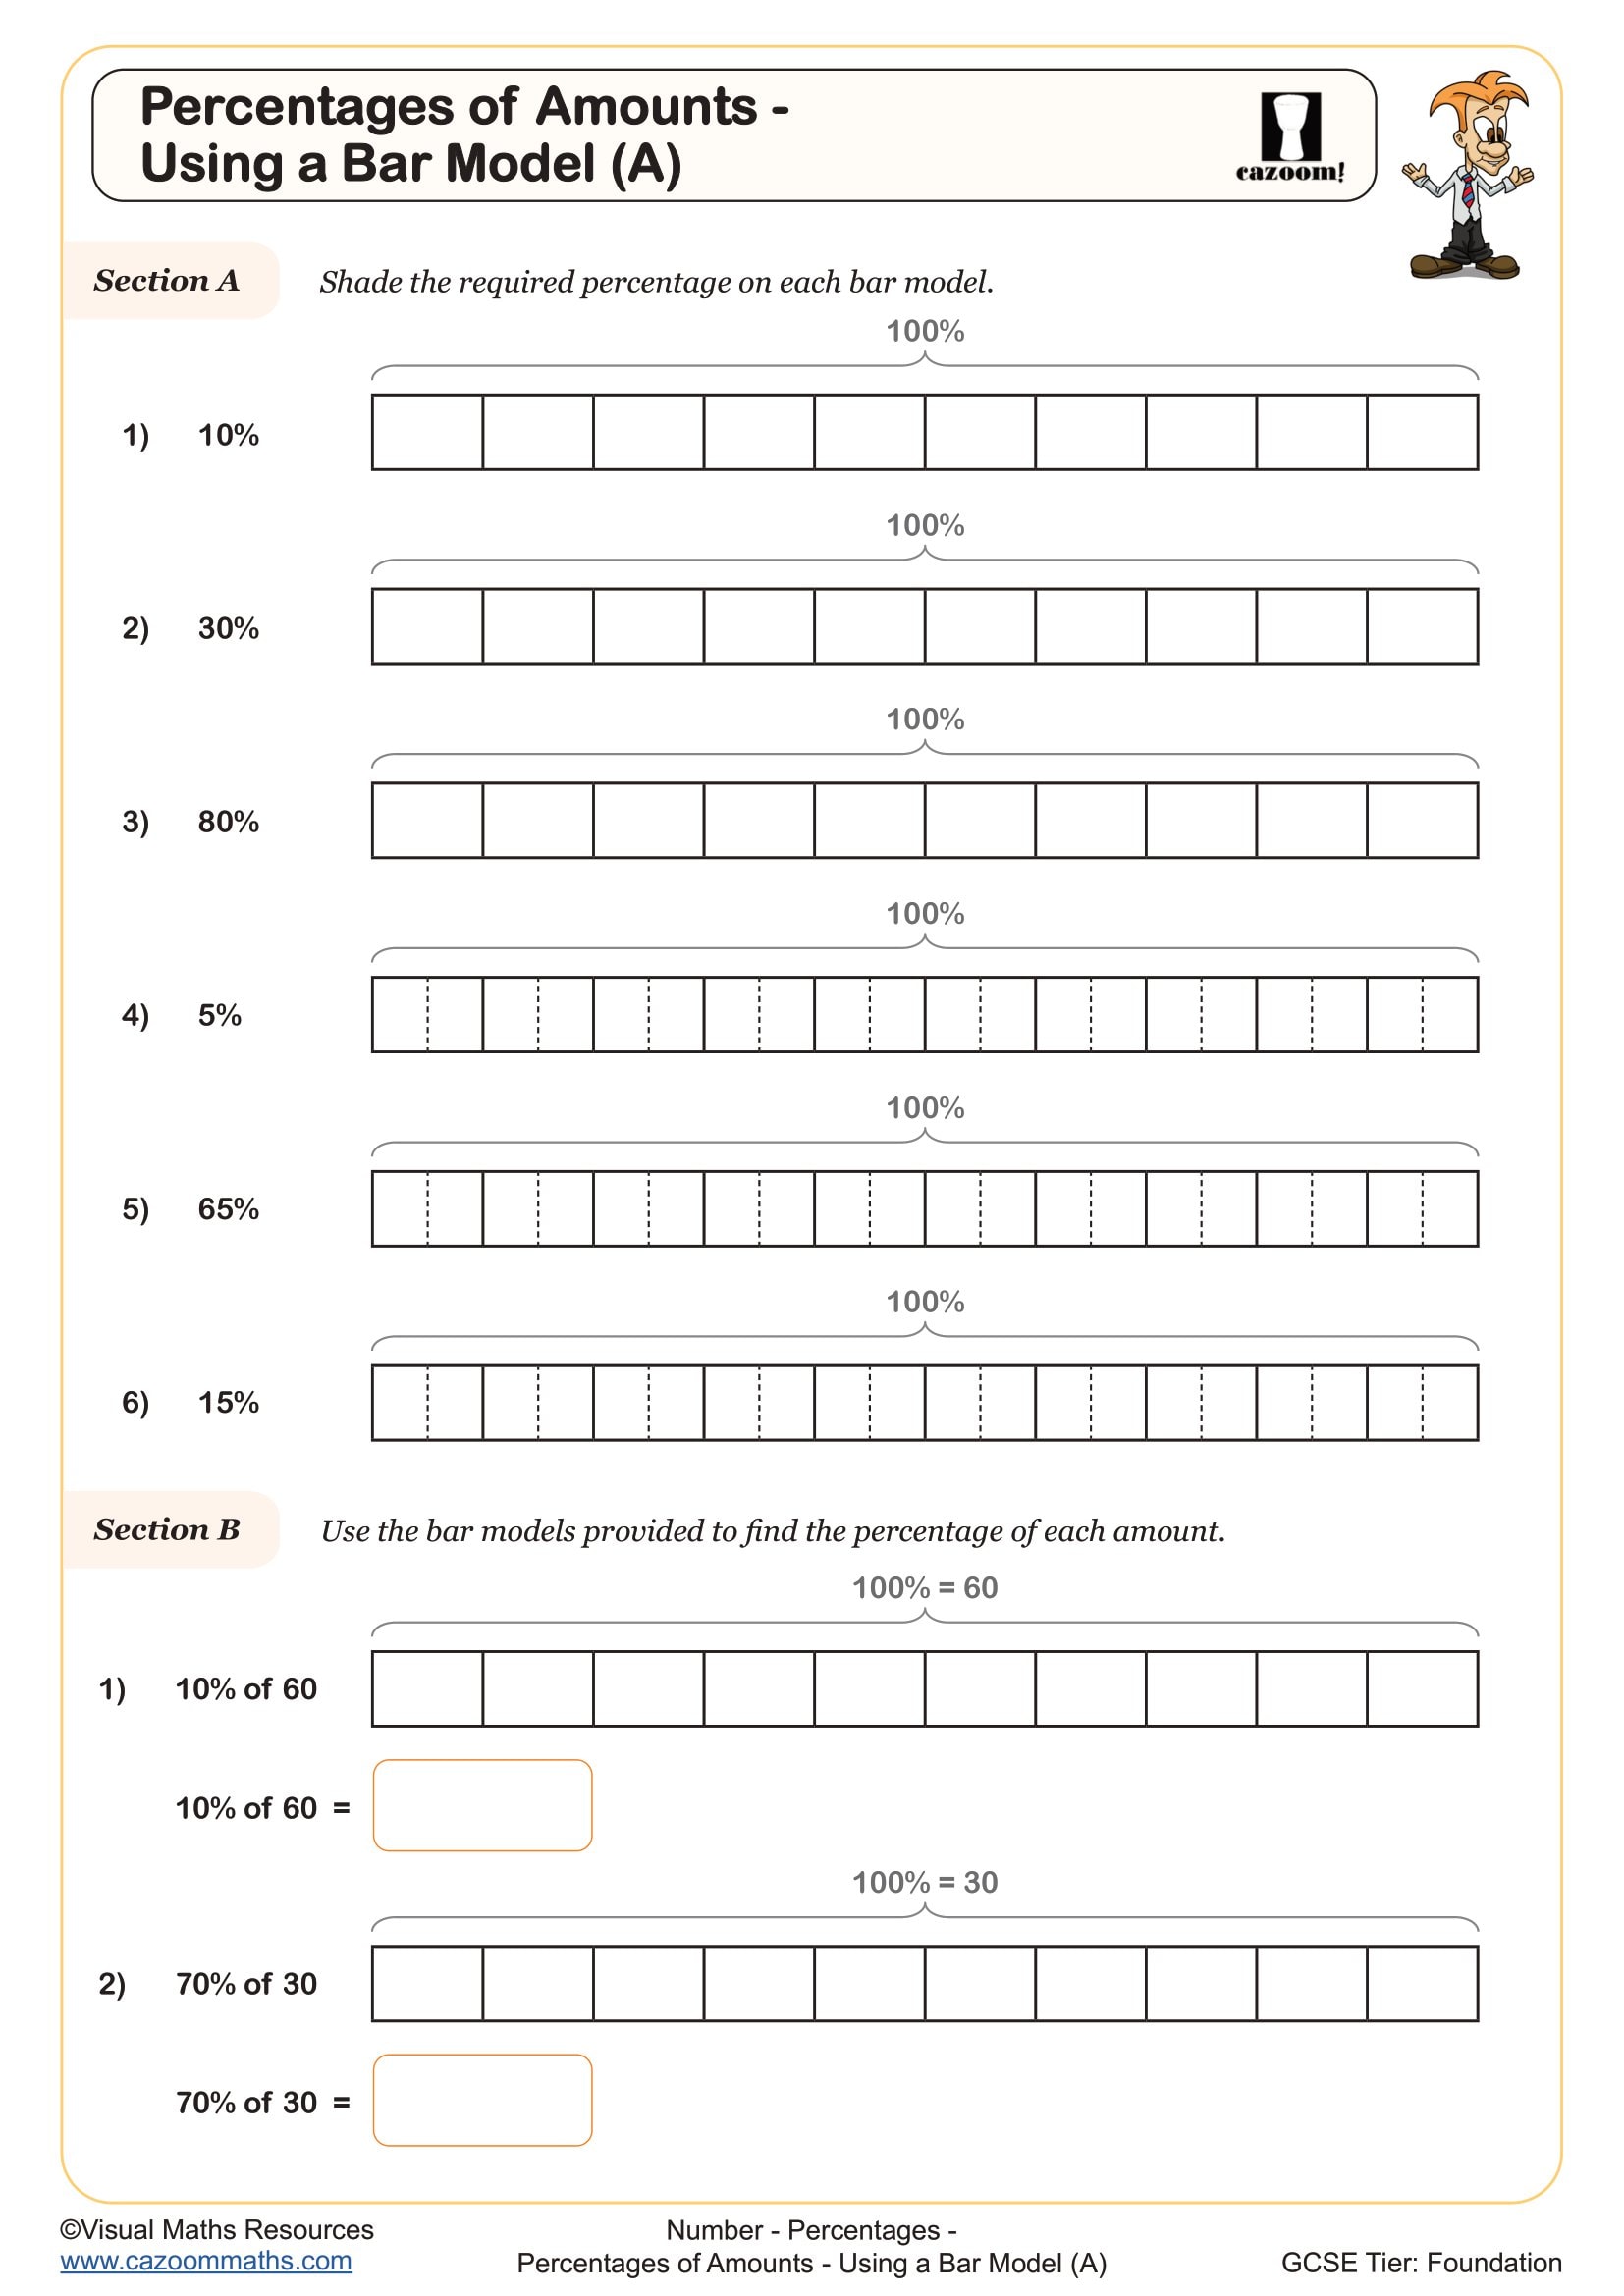
Percentages of Amounts - Using a Bar Model (A)
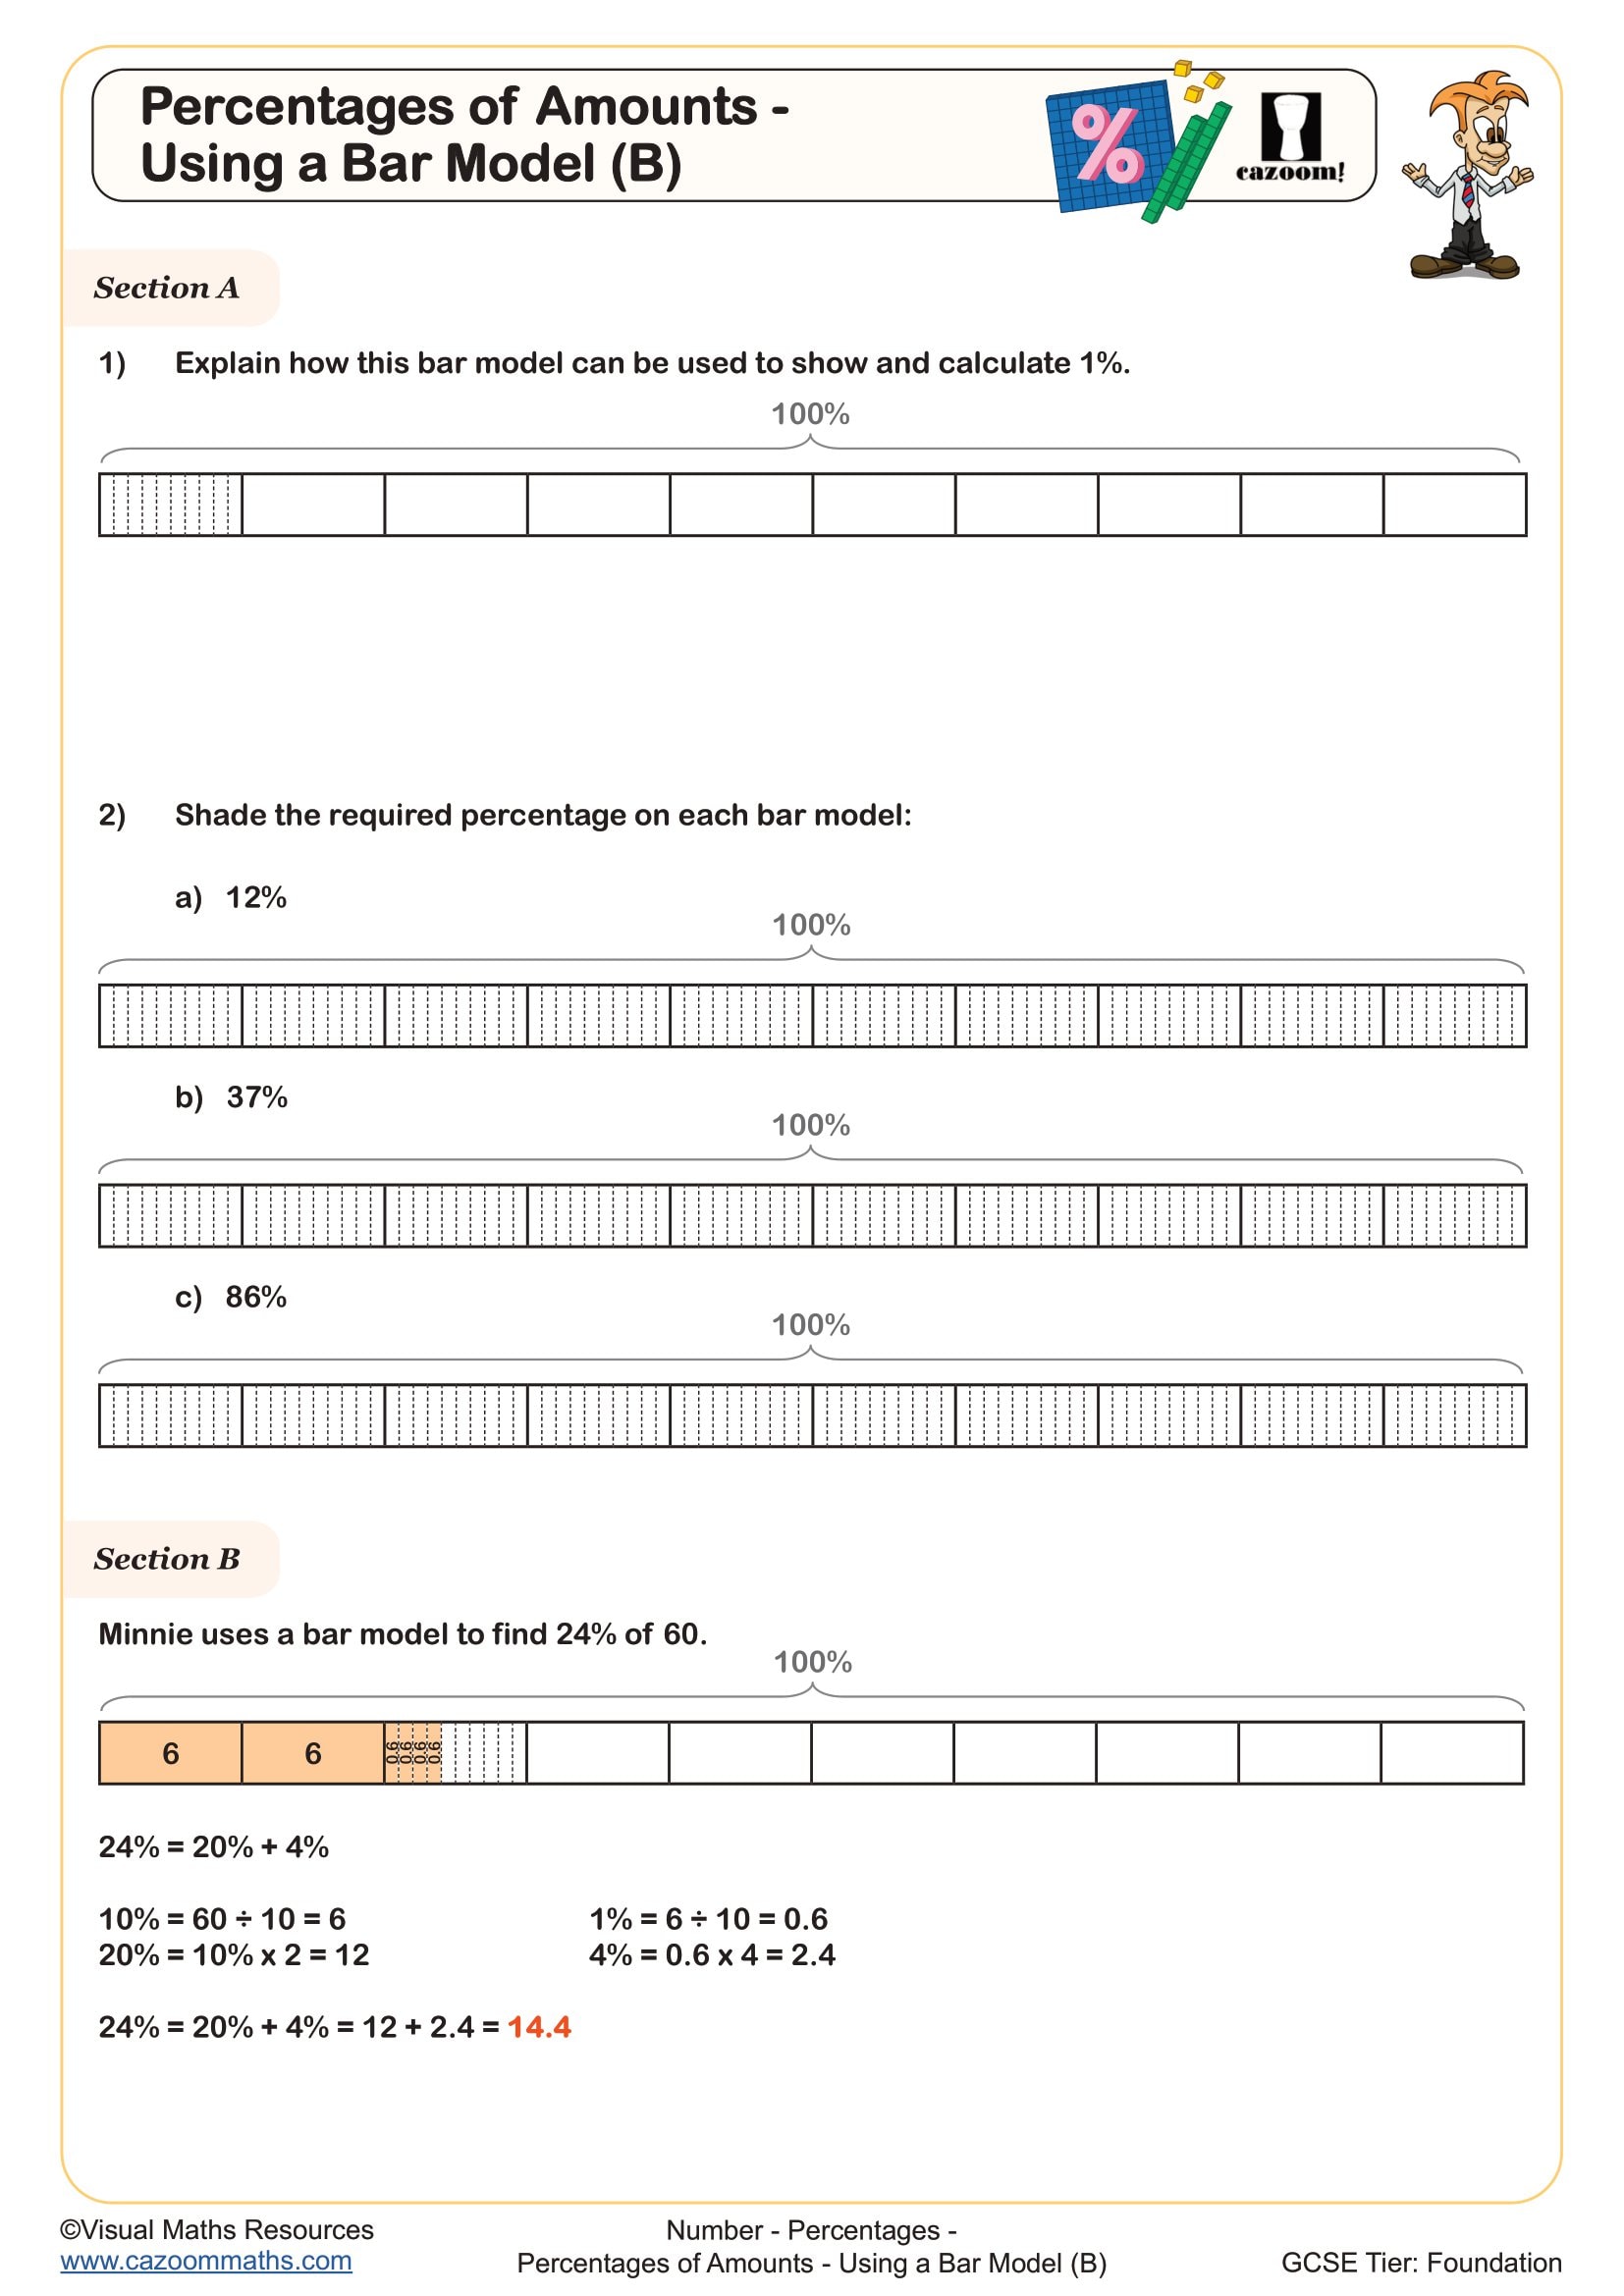
Percentages of Amounts - Using a Bar Model (B)
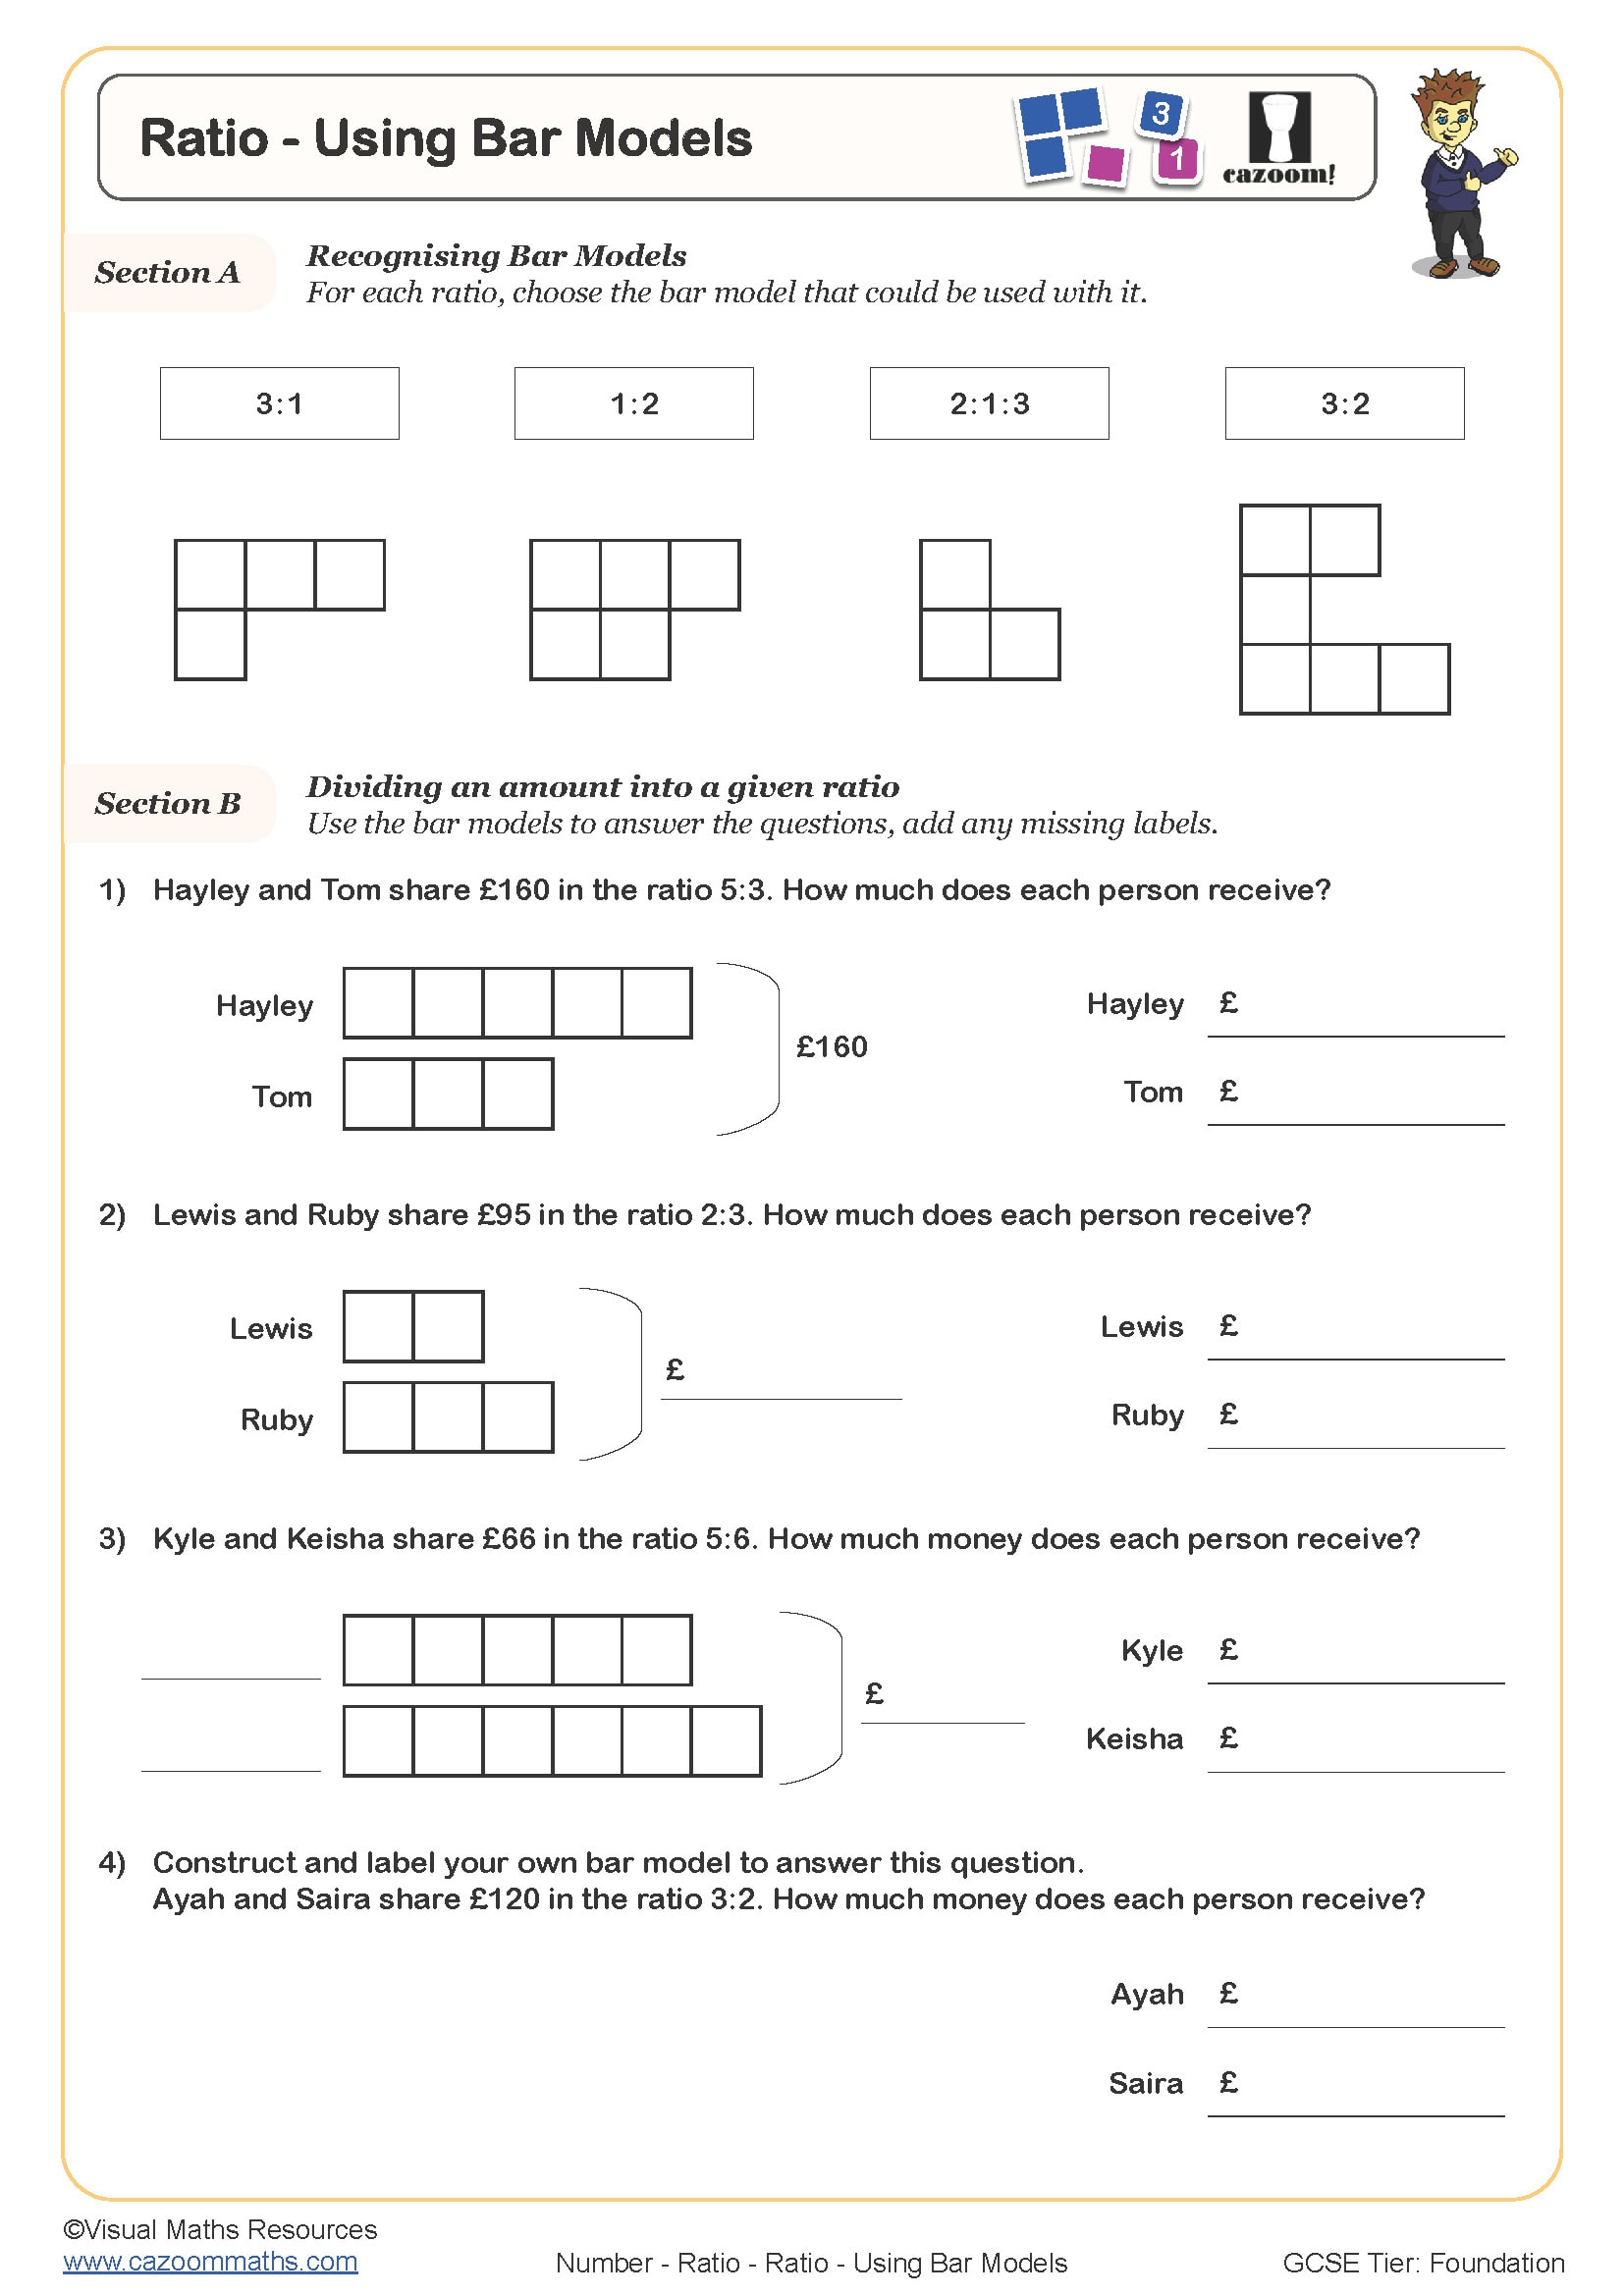
Ratio - Using Bar Models
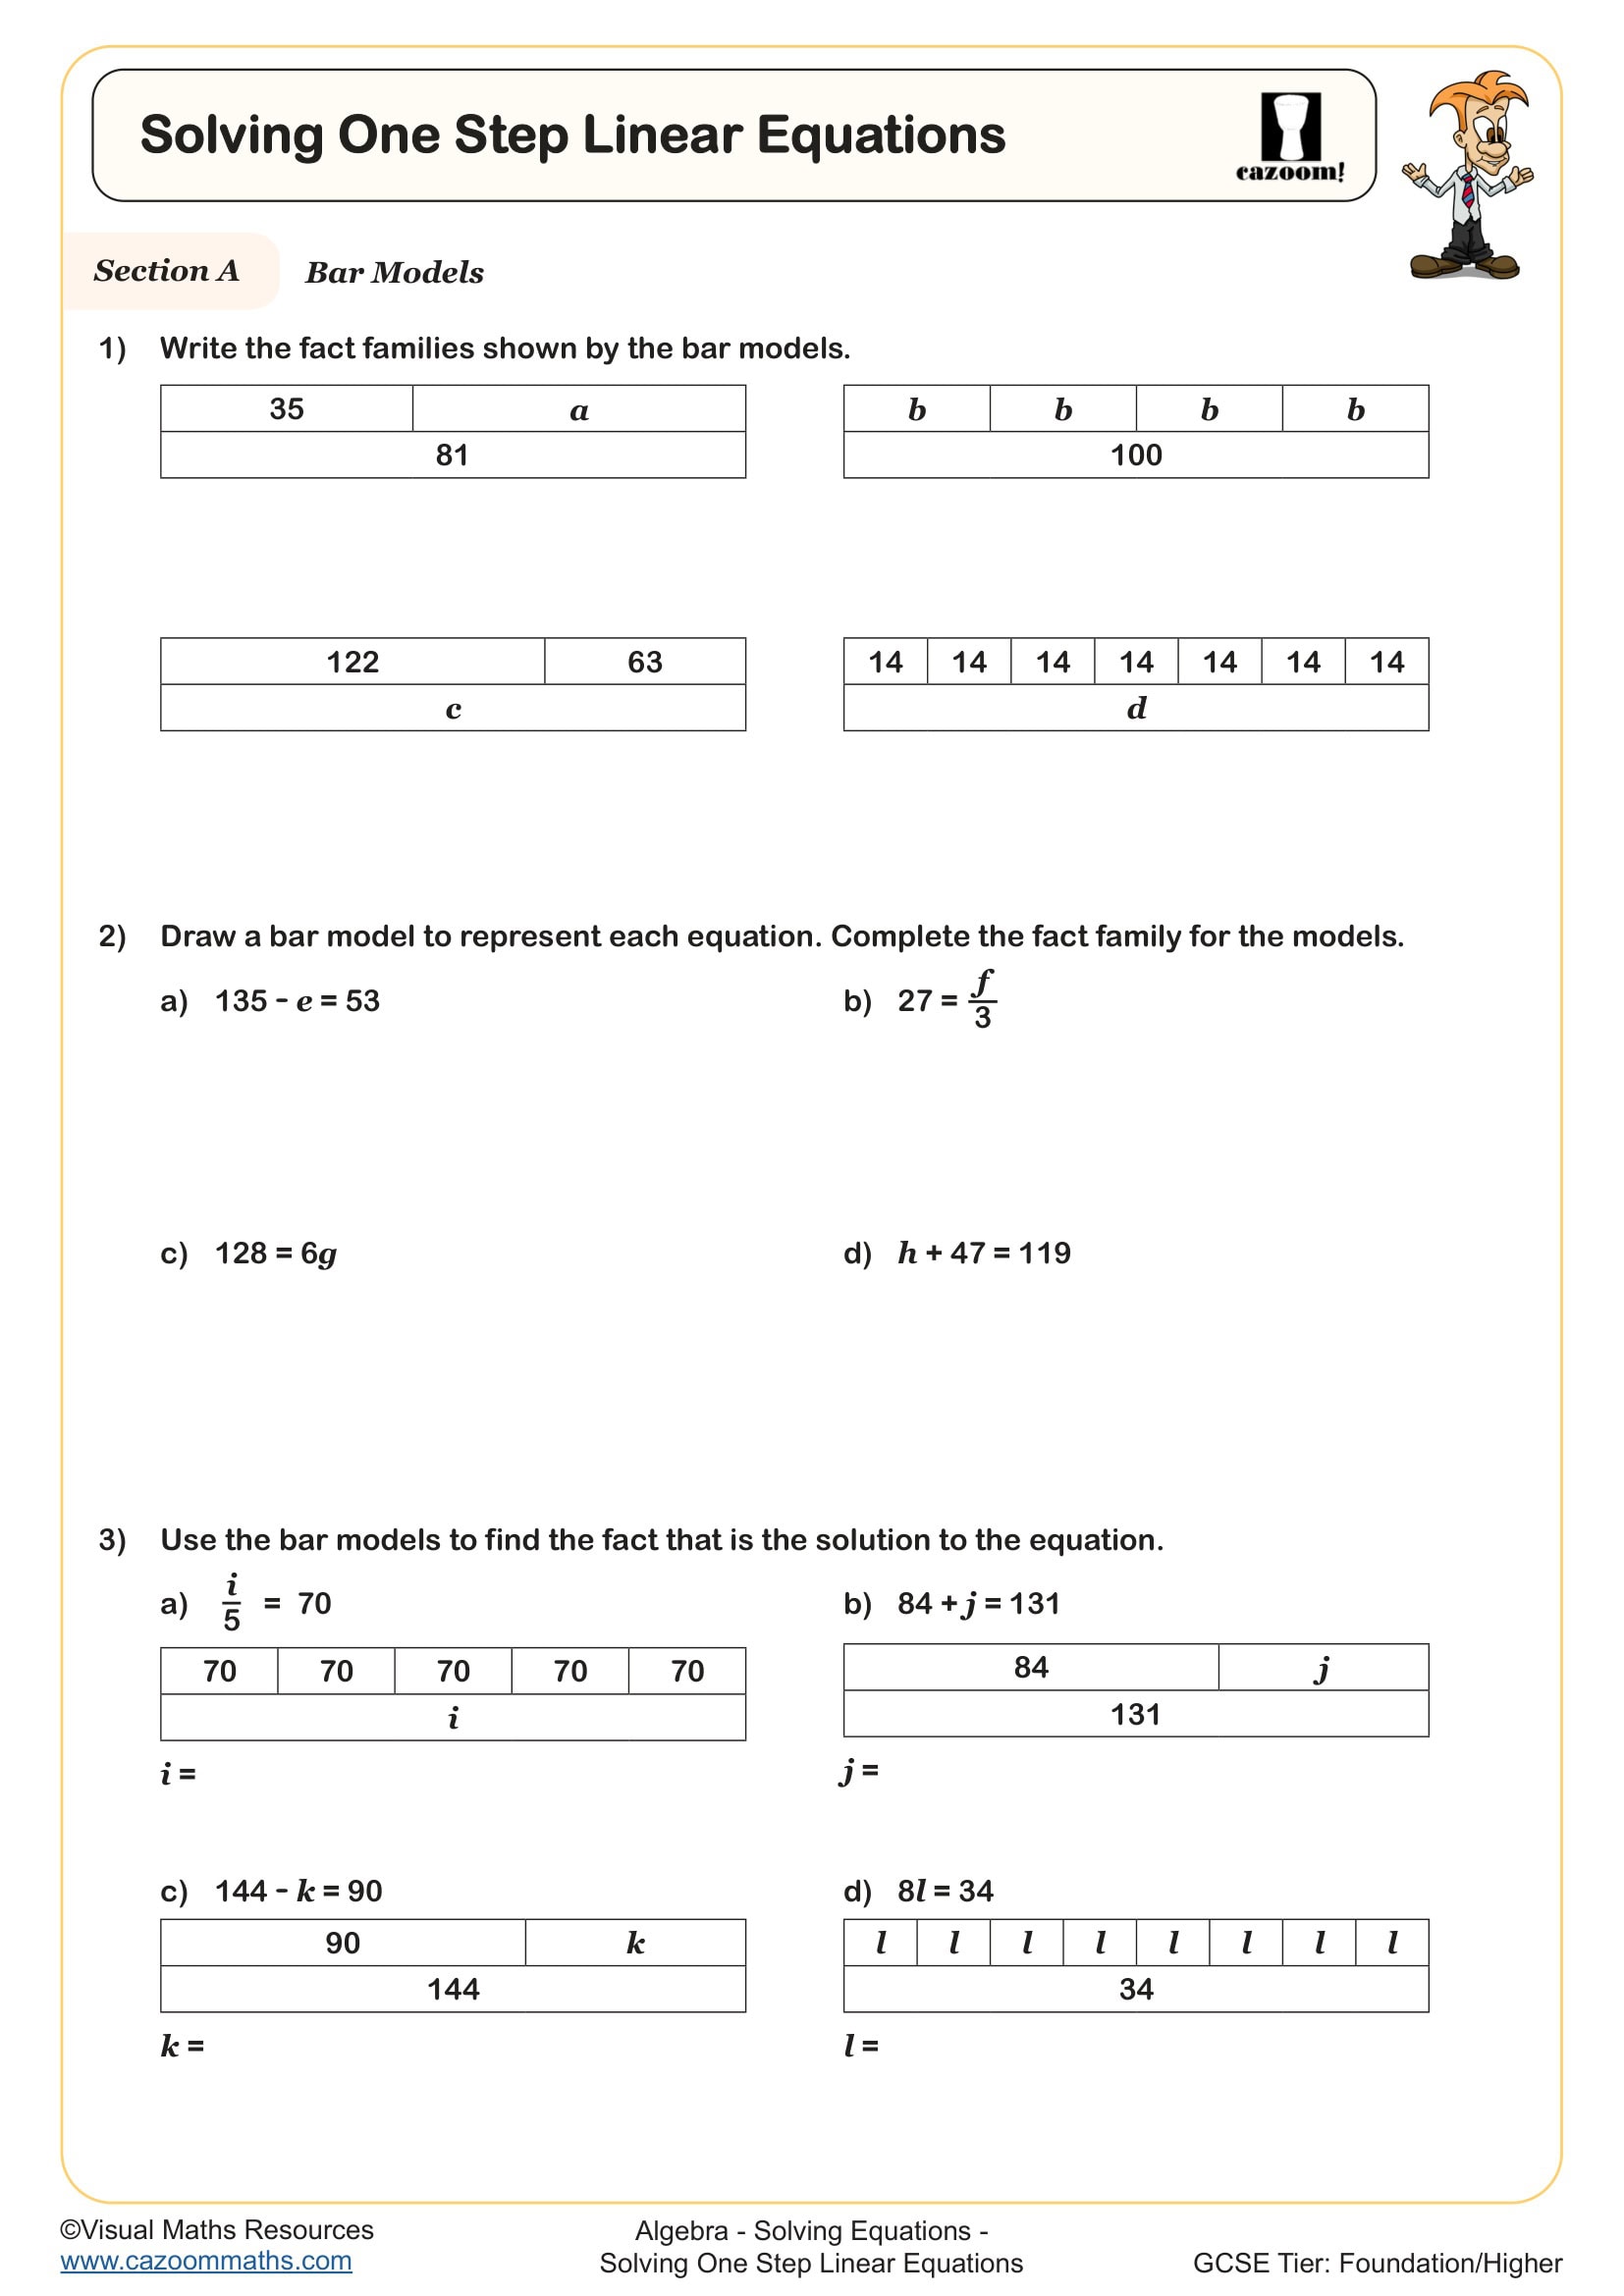
Solving One Step Linear Equations
All worksheets are created by the team of experienced teachers at Cazoom Maths.
What Are Bar Models in Maths?
Bar models are visual diagrams where rectangular bars represent quantities, allowing students to see mathematical relationships before performing calculations. In the National Curriculum for KS3, bar modelling bridges concrete arithmetic and abstract algebraic thinking, particularly for ratio, proportion, and multi-step problems. The method originates from Singapore maths teaching and has become widespread in UK schools for its effectiveness in developing logical reasoning.
Students often confuse which quantity each bar section represents, especially when dealing with comparison problems like "Amy has three times as many sweets as Ben." Teachers notice that explicitly labelling every section and writing what each bar represents prevents this error. The visual nature makes bar models particularly valuable for students who struggle with purely symbolic approaches to problem-solving.
Which Year Groups Use Bar Models?
These worksheets target Year 7 students at KS3, where bar models become a sophisticated tool for solving complex ratio, percentage, and algebraic problems. At this stage, the National Curriculum expects students to apply proportional reasoning and solve multi-step problems, skills that bar models support effectively. While primary schools introduce the concept with simpler part-whole relationships, Year 7 marks a shift towards using bar models for more abstract mathematical thinking.
The progression at KS3 involves moving from straightforward comparison problems to scenarios involving multiple unknowns, percentages of amounts, and ratio problems with more than two parts. Teachers find that students who resist algebraic methods often engage successfully with bar models first, building confidence before transitioning to equation-solving. The visual scaffold remains useful even as students develop more formal mathematical techniques.
How Do Bar Models Connect to Real-World Problem-Solving?
Bar models teach students to break complex problems into manageable visual chunks, a skill that transfers directly to data analysis, project planning, and resource allocation in STEM fields. By representing quantities as proportional bars, students learn to identify what they know, what they need to find, and the relationships between different values. This structured approach mirrors how engineers use diagrams to model systems before performing calculations.
In practical contexts, bar models help students tackle problems like calculating sale prices, dividing resources proportionally in group projects, or understanding nutritional information on food packaging. Scientists use similar proportional reasoning when scaling experimental results or converting between units. Teachers observe that students who can construct accurate bar models develop stronger estimation skills, as they visualise whether their calculated answers make sense in relation to the original quantities represented.
How Should Teachers Use These Bar Model Worksheets?
The worksheets build skills progressively, starting with problems where the bar structure is partially provided before moving to questions where students construct models independently. This scaffolding allows students to focus first on interpreting bar diagrams, then on creating them from written problems. The answer sheets show complete worked solutions, including how to draw and label each bar, which helps students self-check their reasoning process rather than just their final numerical answer.
Many teachers use these worksheets during intervention sessions for students who struggle with word problems, as the visual approach often succeeds where algebraic methods haven't clicked. They work well for paired activities where students discuss what each bar section represents before calculating. For homework, the answer sheets allow students to identify exactly where their reasoning diverged from the correct method, building independence in problem-solving strategies that extend beyond bar modelling to other mathematical contexts.