Year 8 Stacked Number Lines Worksheets
All worksheets are created by the team of experienced teachers at Cazoom Maths.
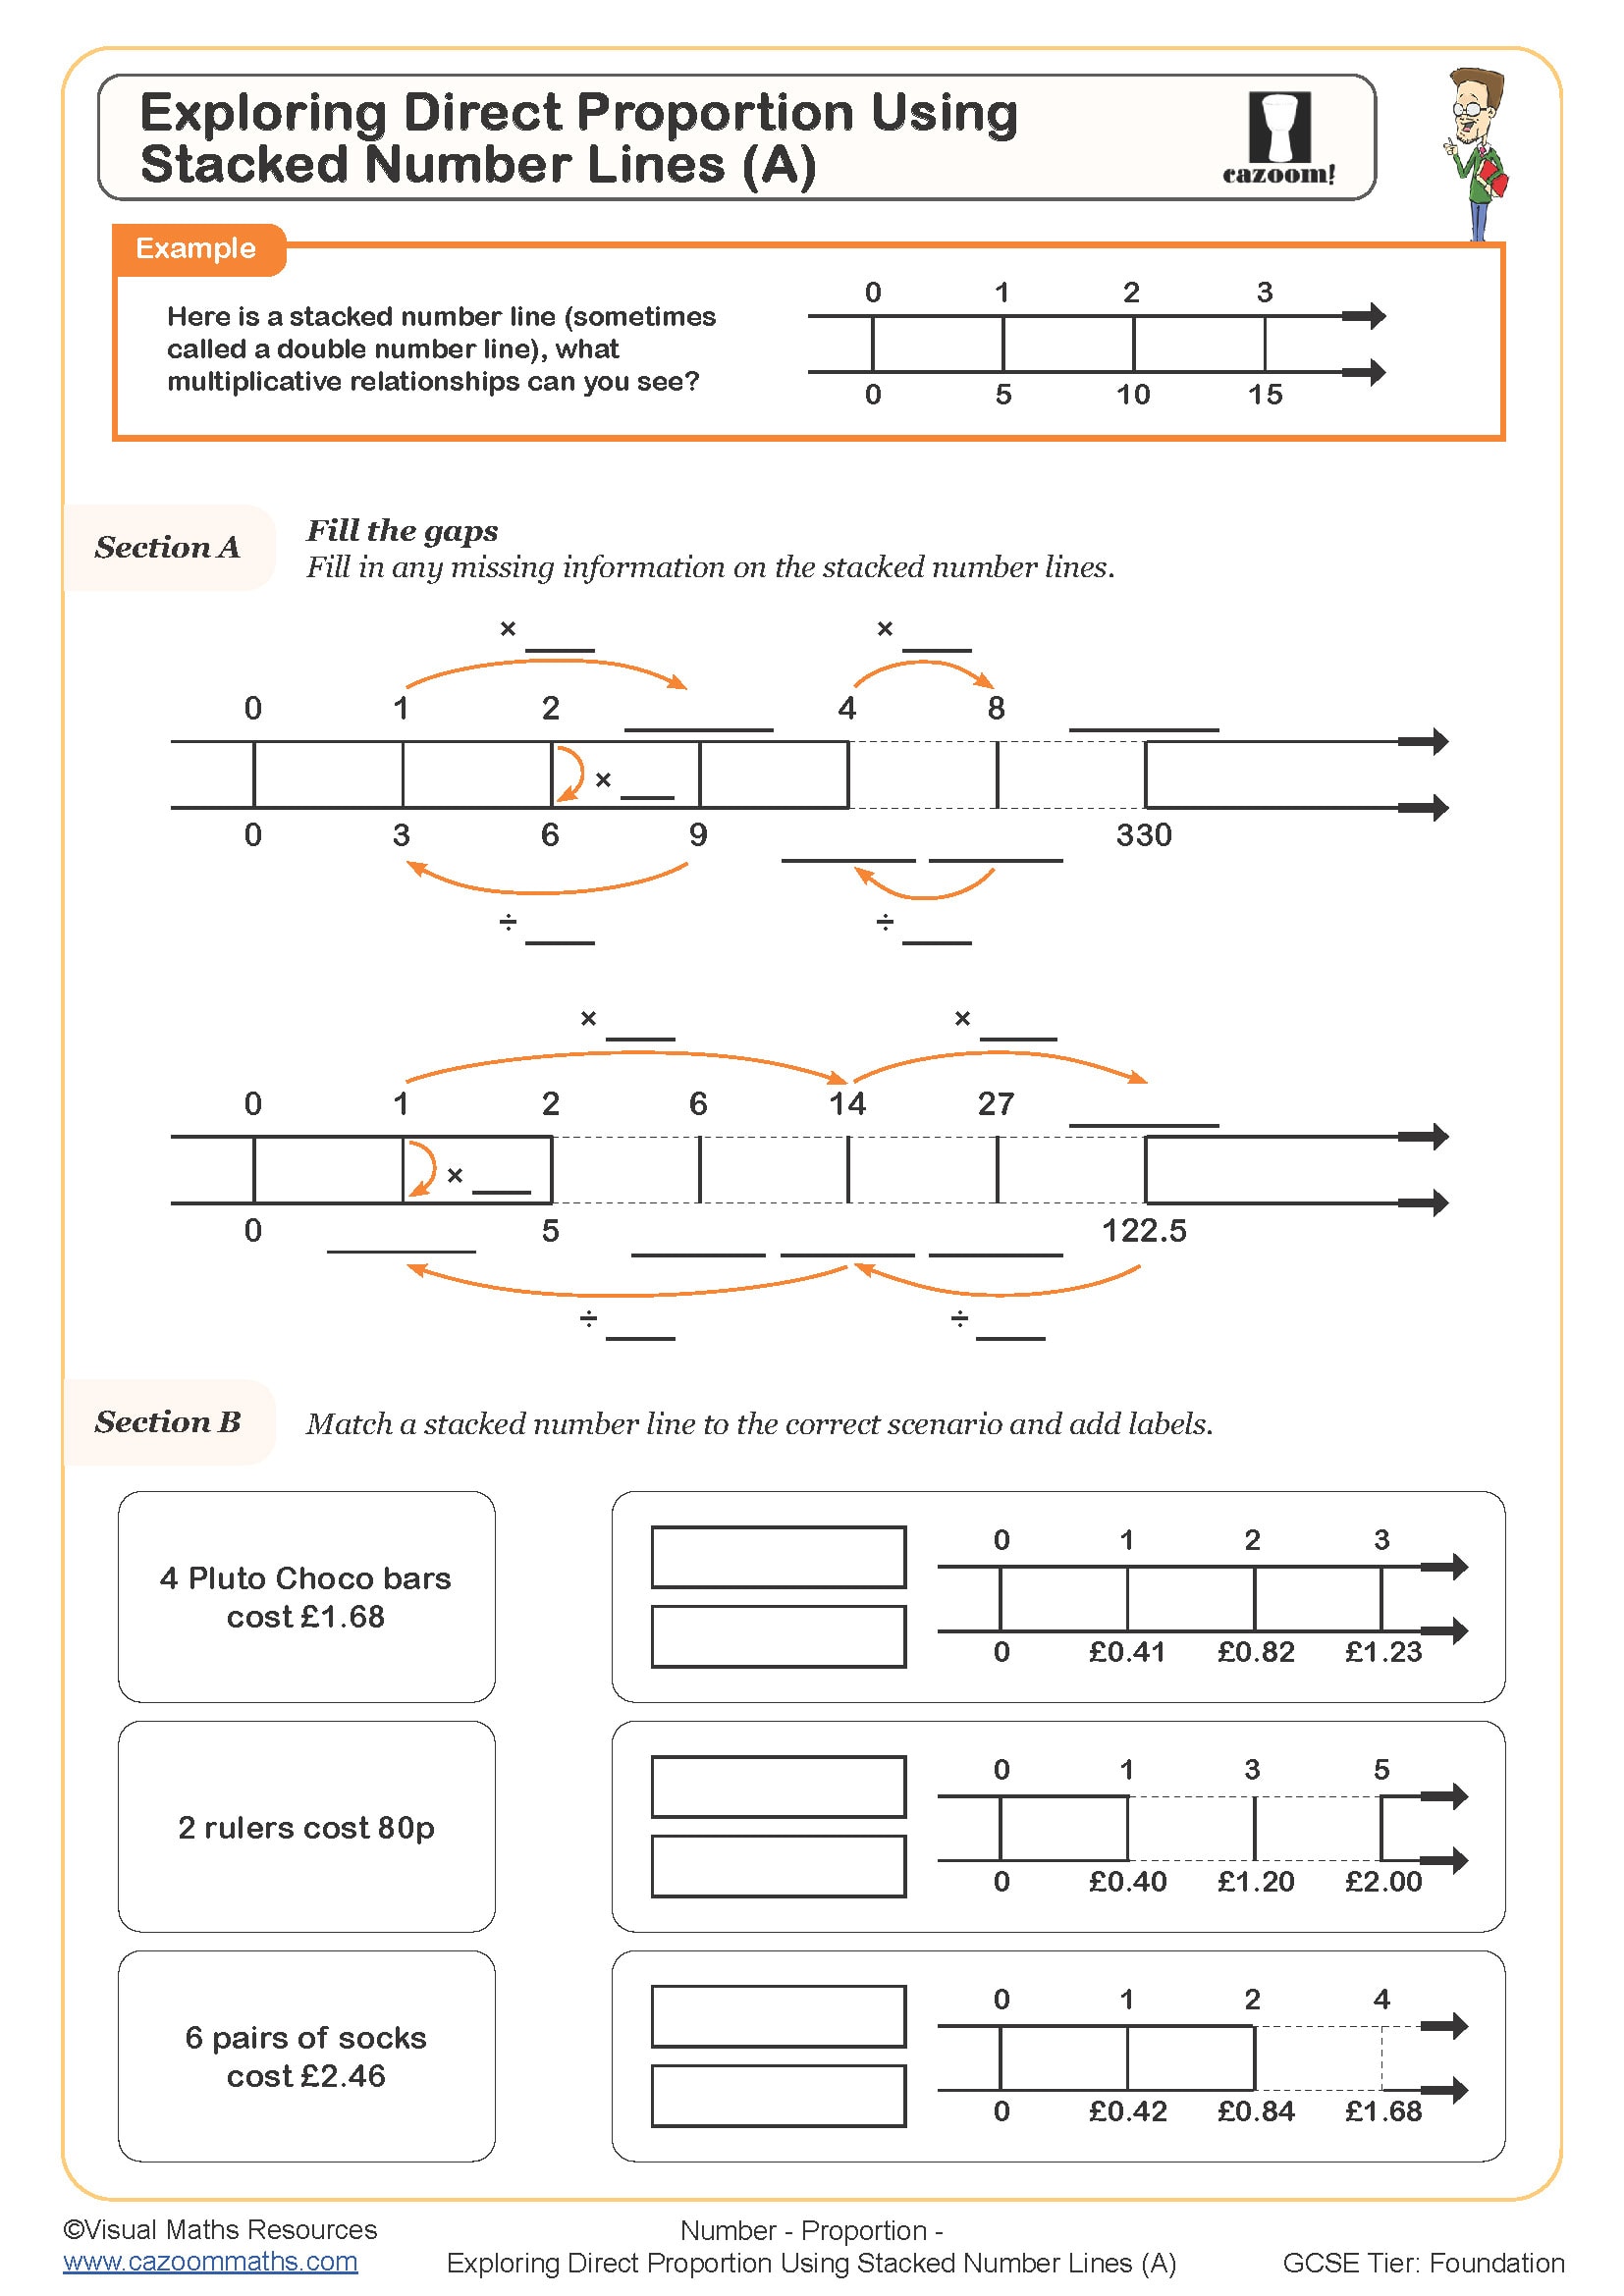
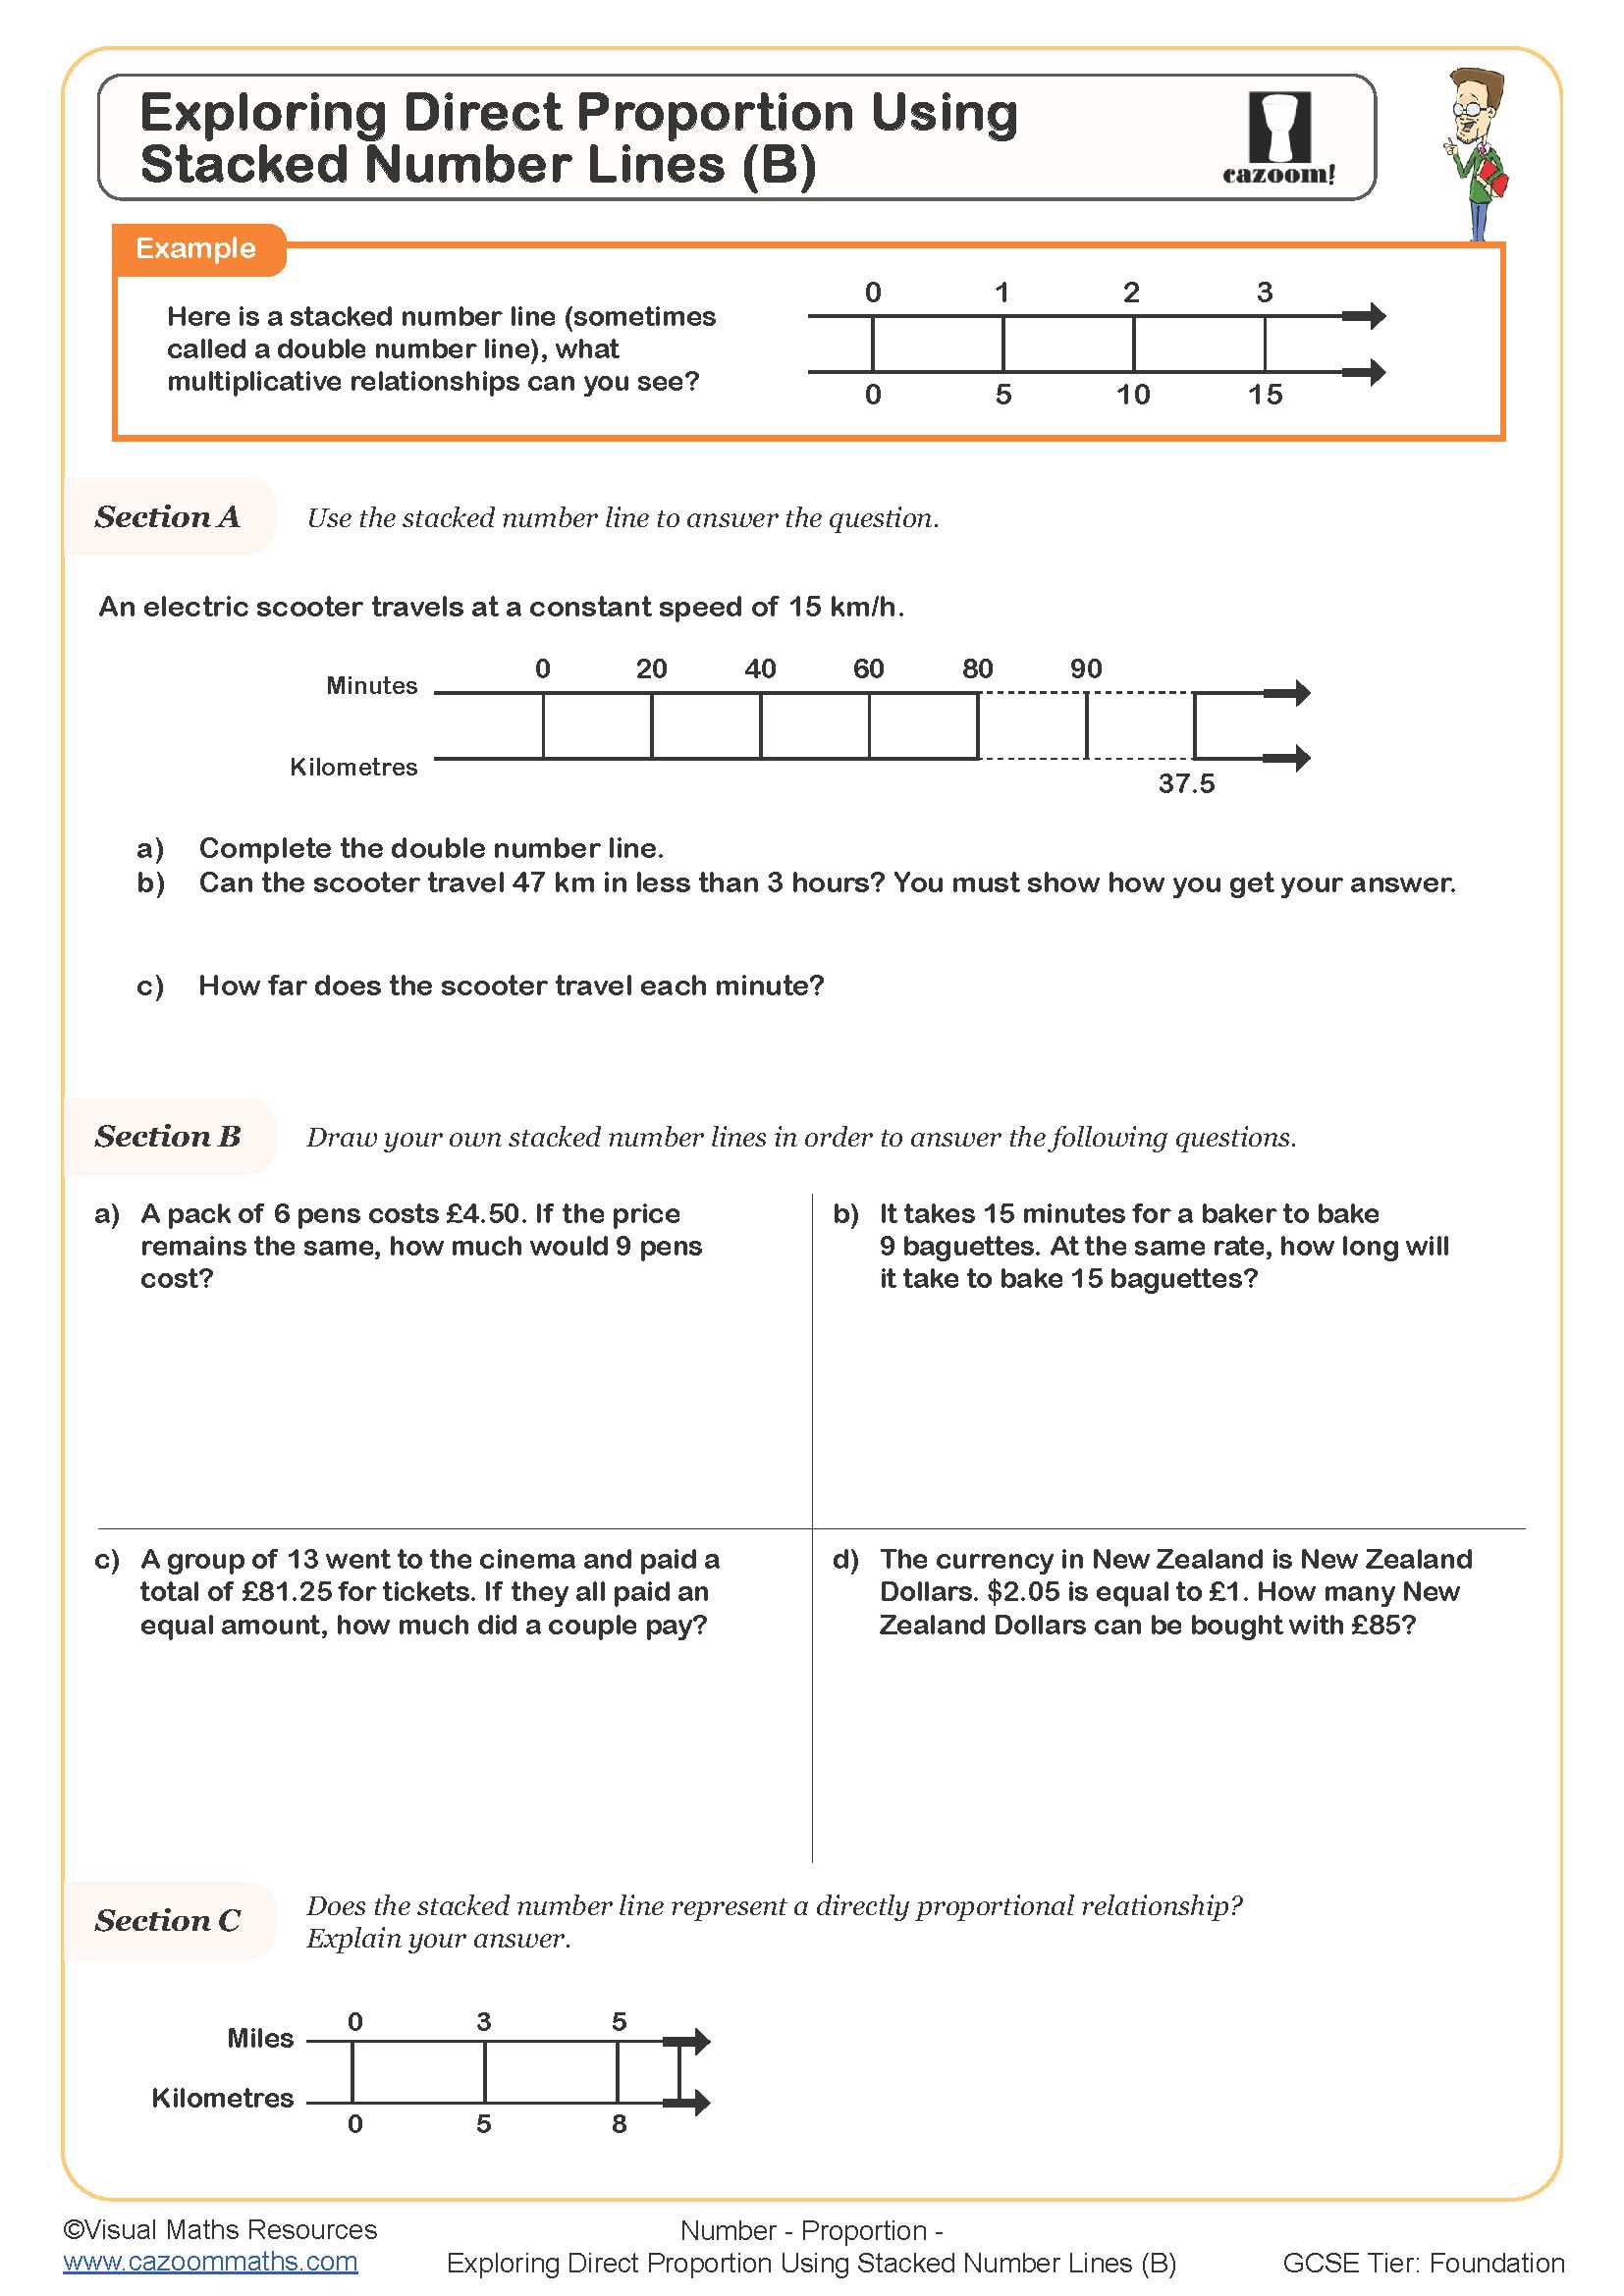
What are stacked number lines and why are they used in maths?
Stacked number lines are two or more parallel number lines placed vertically to show different quantities or operations simultaneously. This visual tool allows students to compare values, track operations, or model differences between numbers by aligning corresponding points. The National Curriculum for KS3 emphasises using multiple representations to develop mathematical reasoning, and stacked number lines provide this bridge between visual and abstract thinking.
Students often misalign the scales when creating their own stacked number lines, leading to incorrect comparisons. For example, when comparing 15 and −8, placing zero at different positions on each line makes the difference appear larger or smaller than it actually is. Teaching students to align equivalent values vertically helps them see relationships more clearly and builds accuracy when interpreting or constructing these diagrams.
Which year groups use stacked number lines?
These worksheets are designed for Year 8 students working within Key Stage 3, where the focus shifts to using number lines as analytical tools rather than basic counting aids. At this level, stacked number lines support work with integers, rational numbers, and increasingly complex operations that require tracking multiple values or transformations simultaneously.
Whilst younger students use single number lines to model simple addition and subtraction, Year 8 students apply stacked number lines to problems involving negative numbers, fractional intervals, and algebraic thinking. The progression involves moving from visual dependence to using the representation strategically when problems become conceptually demanding, such as finding differences between temperatures or comparing quantities in scientific contexts.
How do stacked number lines help with negative numbers?
Stacked number lines make the direction and magnitude of movement visible when working with negative numbers. By placing one number line above another, students can see that subtracting a negative number means moving in the opposite direction, clarifying why −5 − (−3) equals −2. This visual method prevents the common error of treating all subtraction as 'making smaller', which fails with negative values.
Temperature changes provide a natural application of this skill. Meteorologists use similar representations to track temperature variations across different altitudes or time periods, and climate scientists compare historical data using stacked graphs. Understanding how to read and construct stacked number lines prepares students for interpreting scientific data displays, where multiple variables are compared visually to identify patterns, anomalies, or trends across different conditions.
How should teachers use these stacked number lines worksheets?
The worksheets build from identifying positions and differences on pre-drawn stacked number lines to constructing and interpreting more complex diagrams independently. Worked examples demonstrate the alignment techniques and systematic approaches needed for accuracy, whilst varied questions prevent students from simply memorising patterns. This scaffolding helps students develop confidence with the visual representation before transitioning to purely symbolic calculations.
Many teachers use these worksheets during intervention sessions for students who struggle with integer operations, as the visual element often clarifies concepts that remain abstract through calculation alone. They work effectively as homework to consolidate classwork or as starter activities to recall prior learning. The answer sheets enable paired marking activities where students discuss discrepancies in their working, developing mathematical communication skills alongside procedural accuracy.