Year 9 Statistics Worksheets
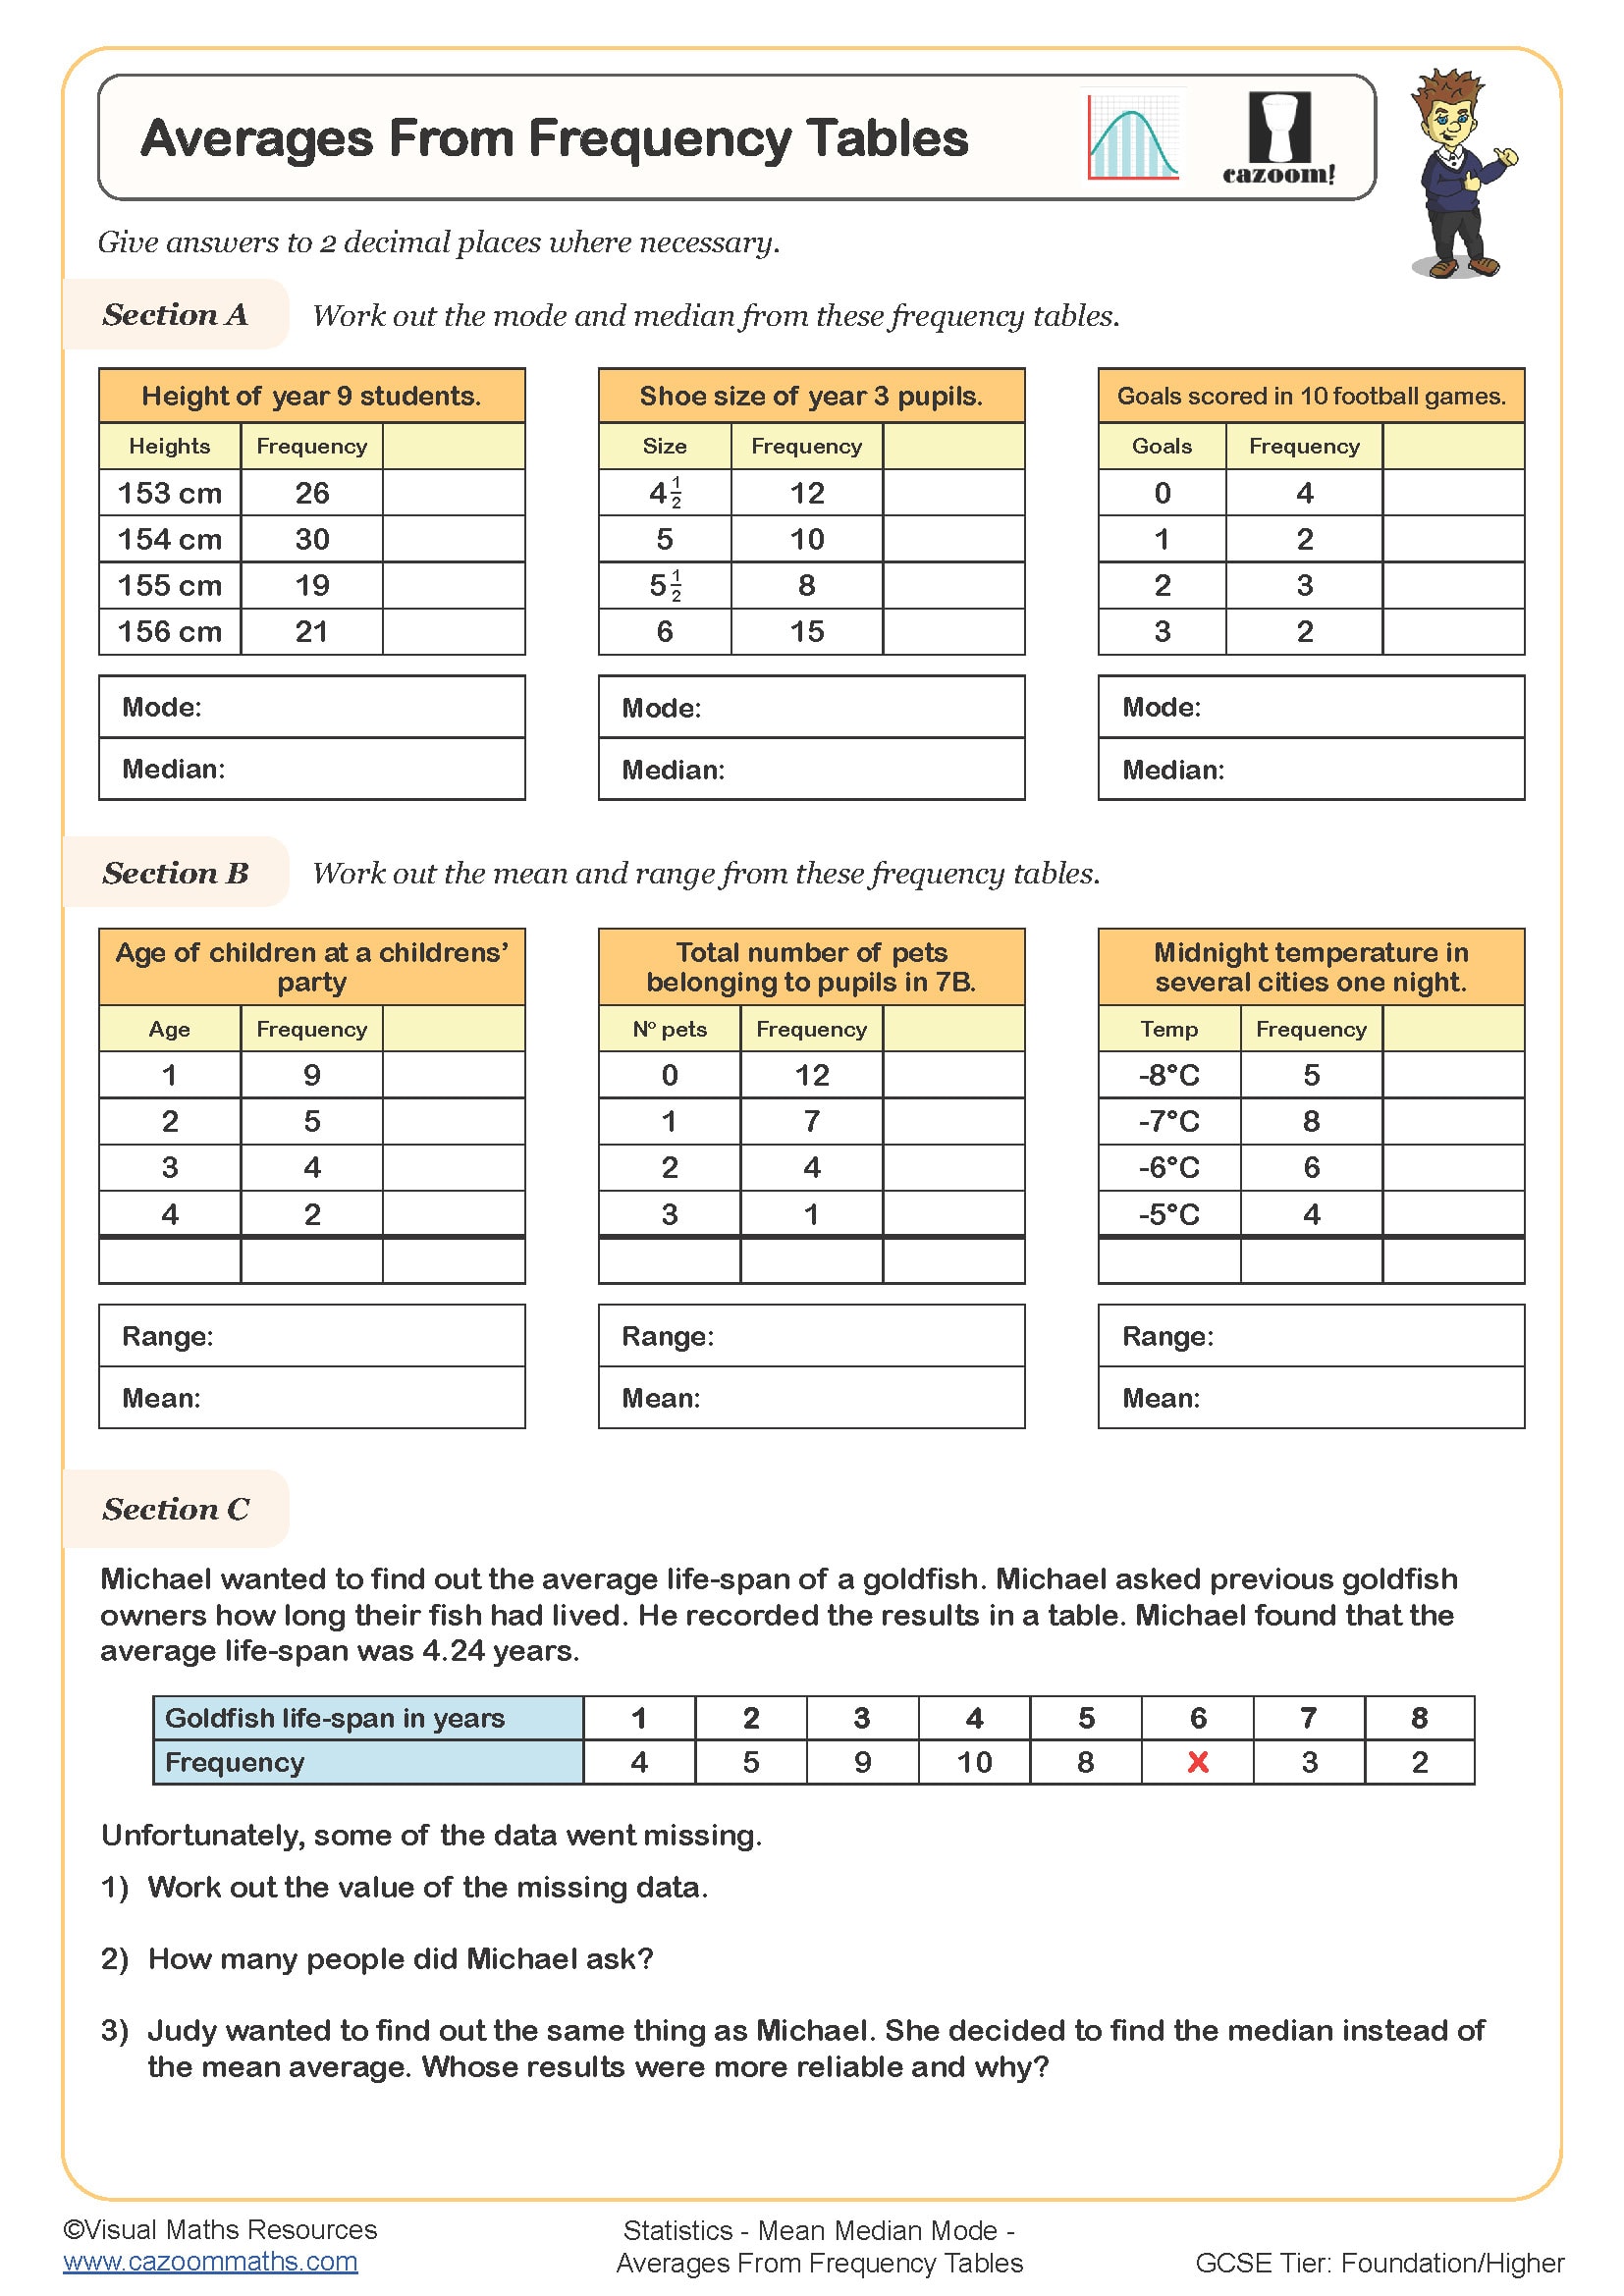
Averages from Frequency Tables
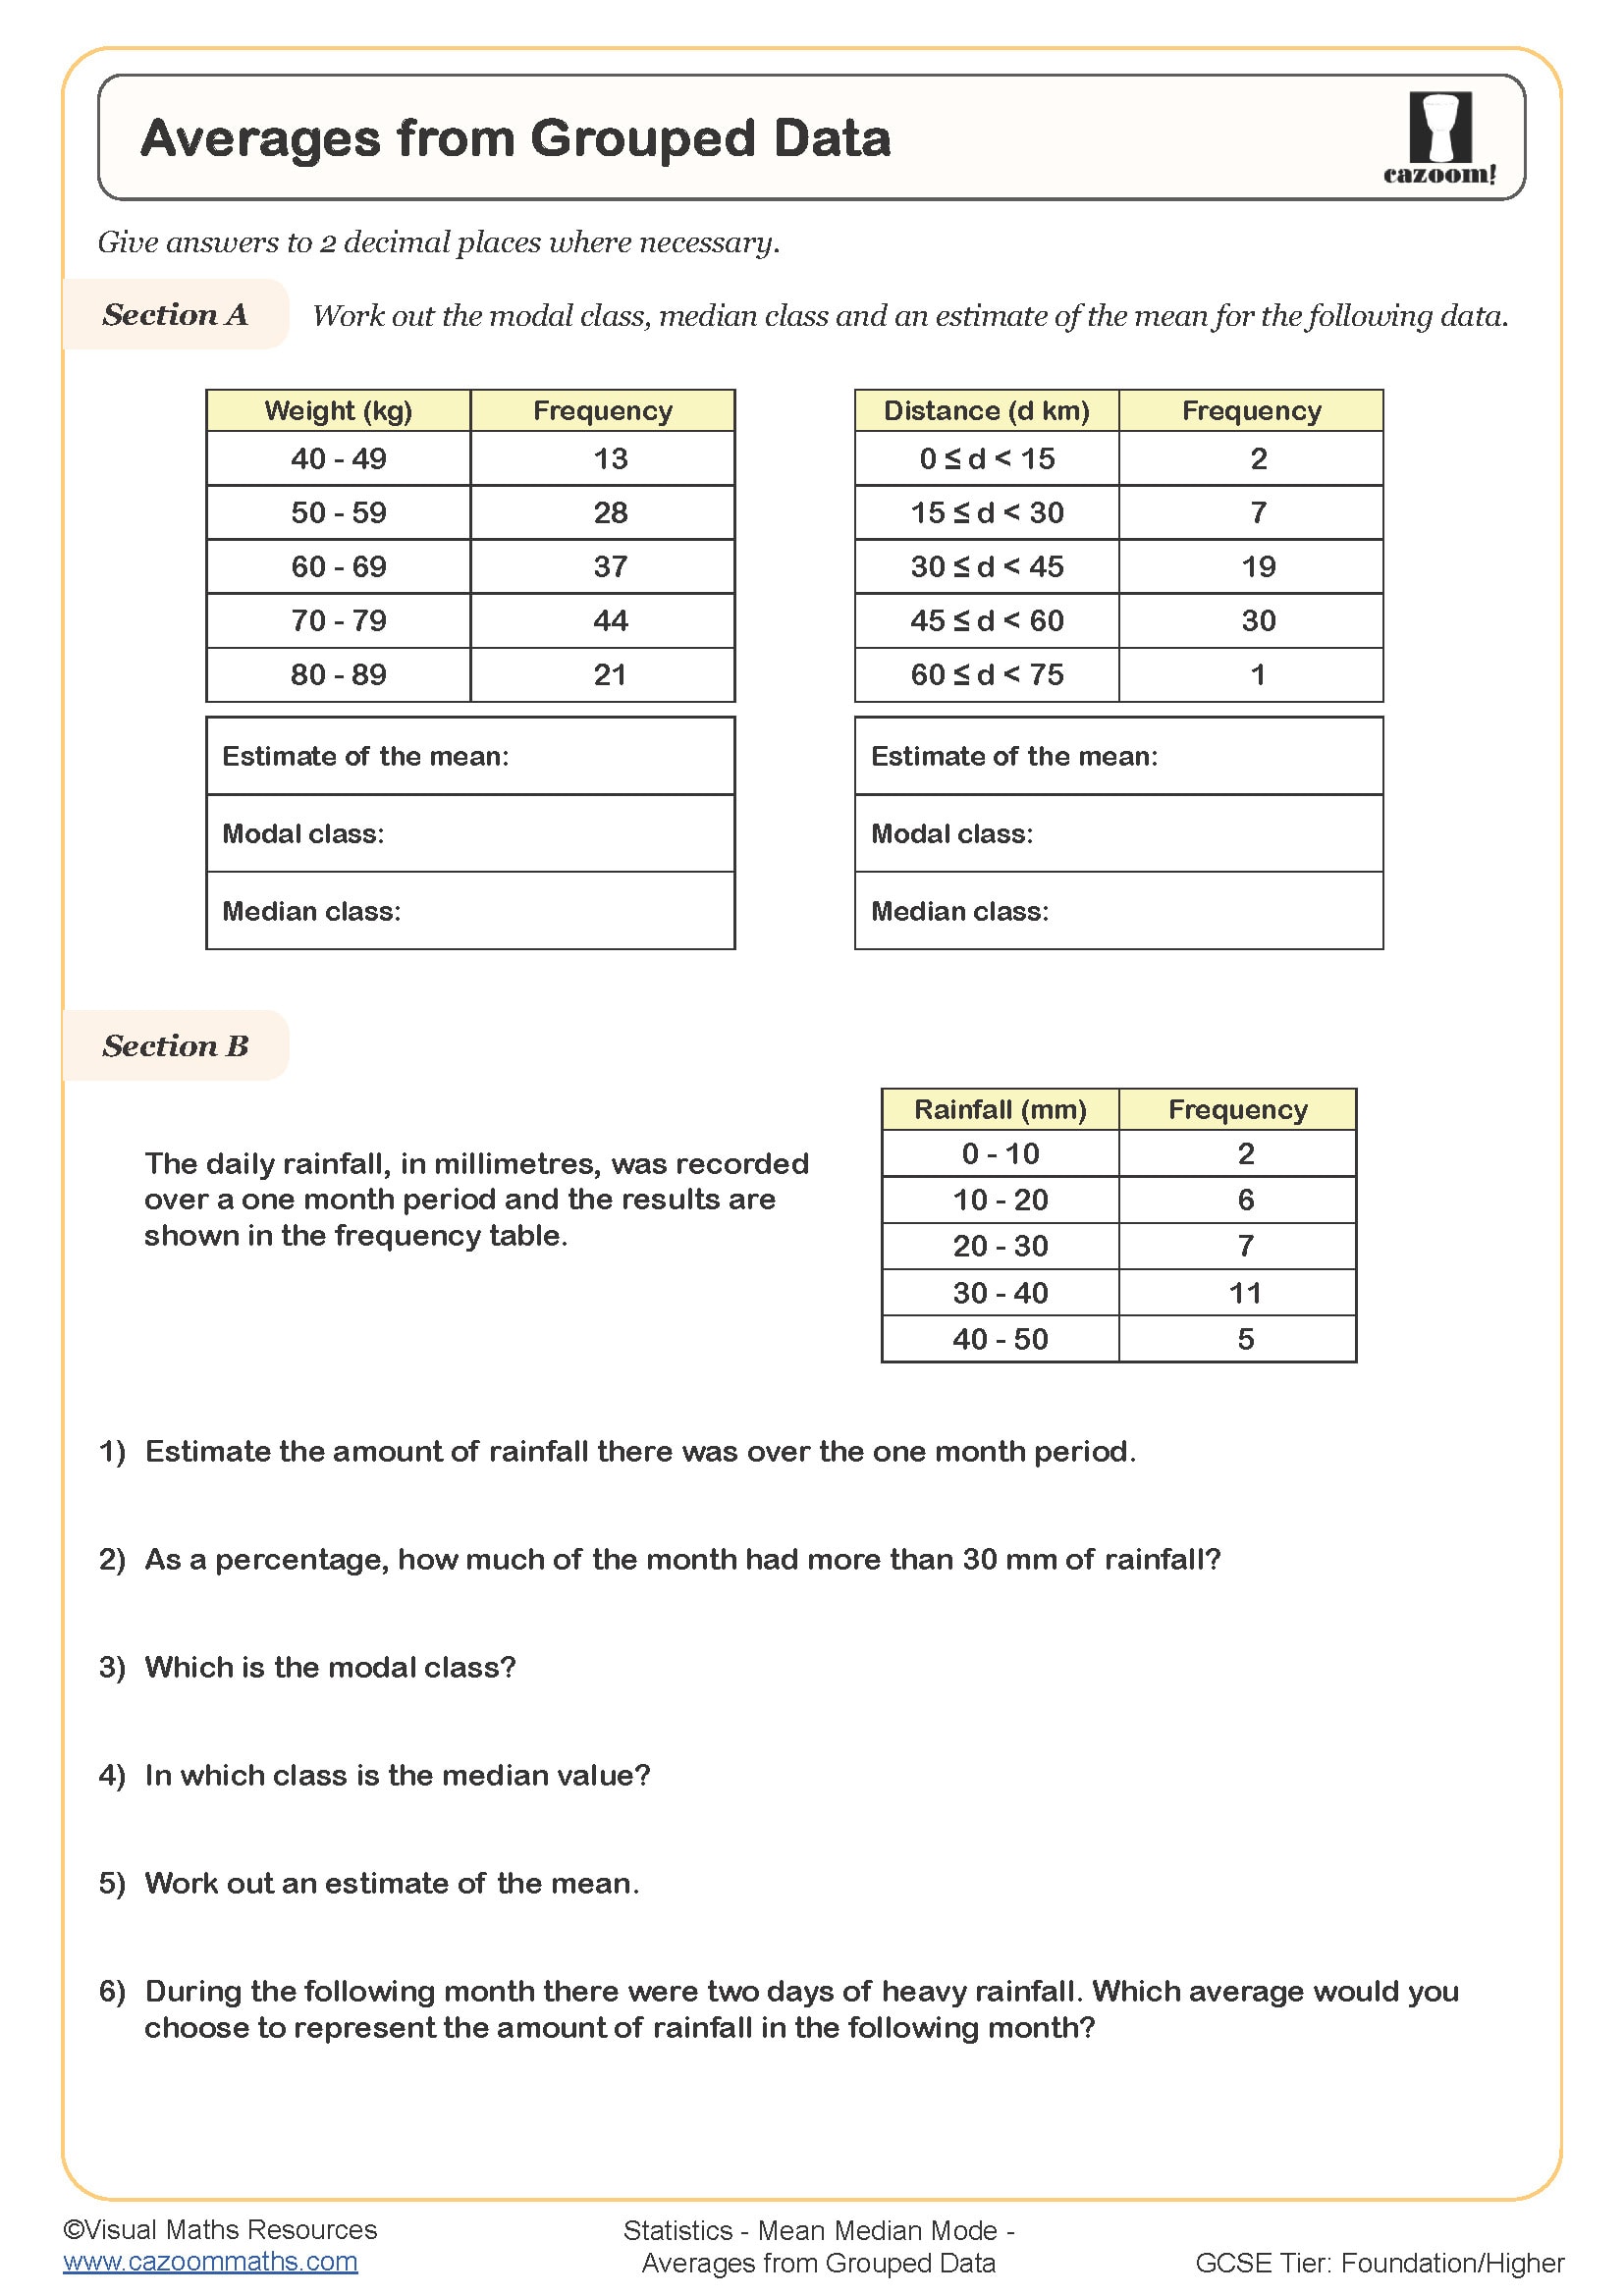
Averages from Grouped Data
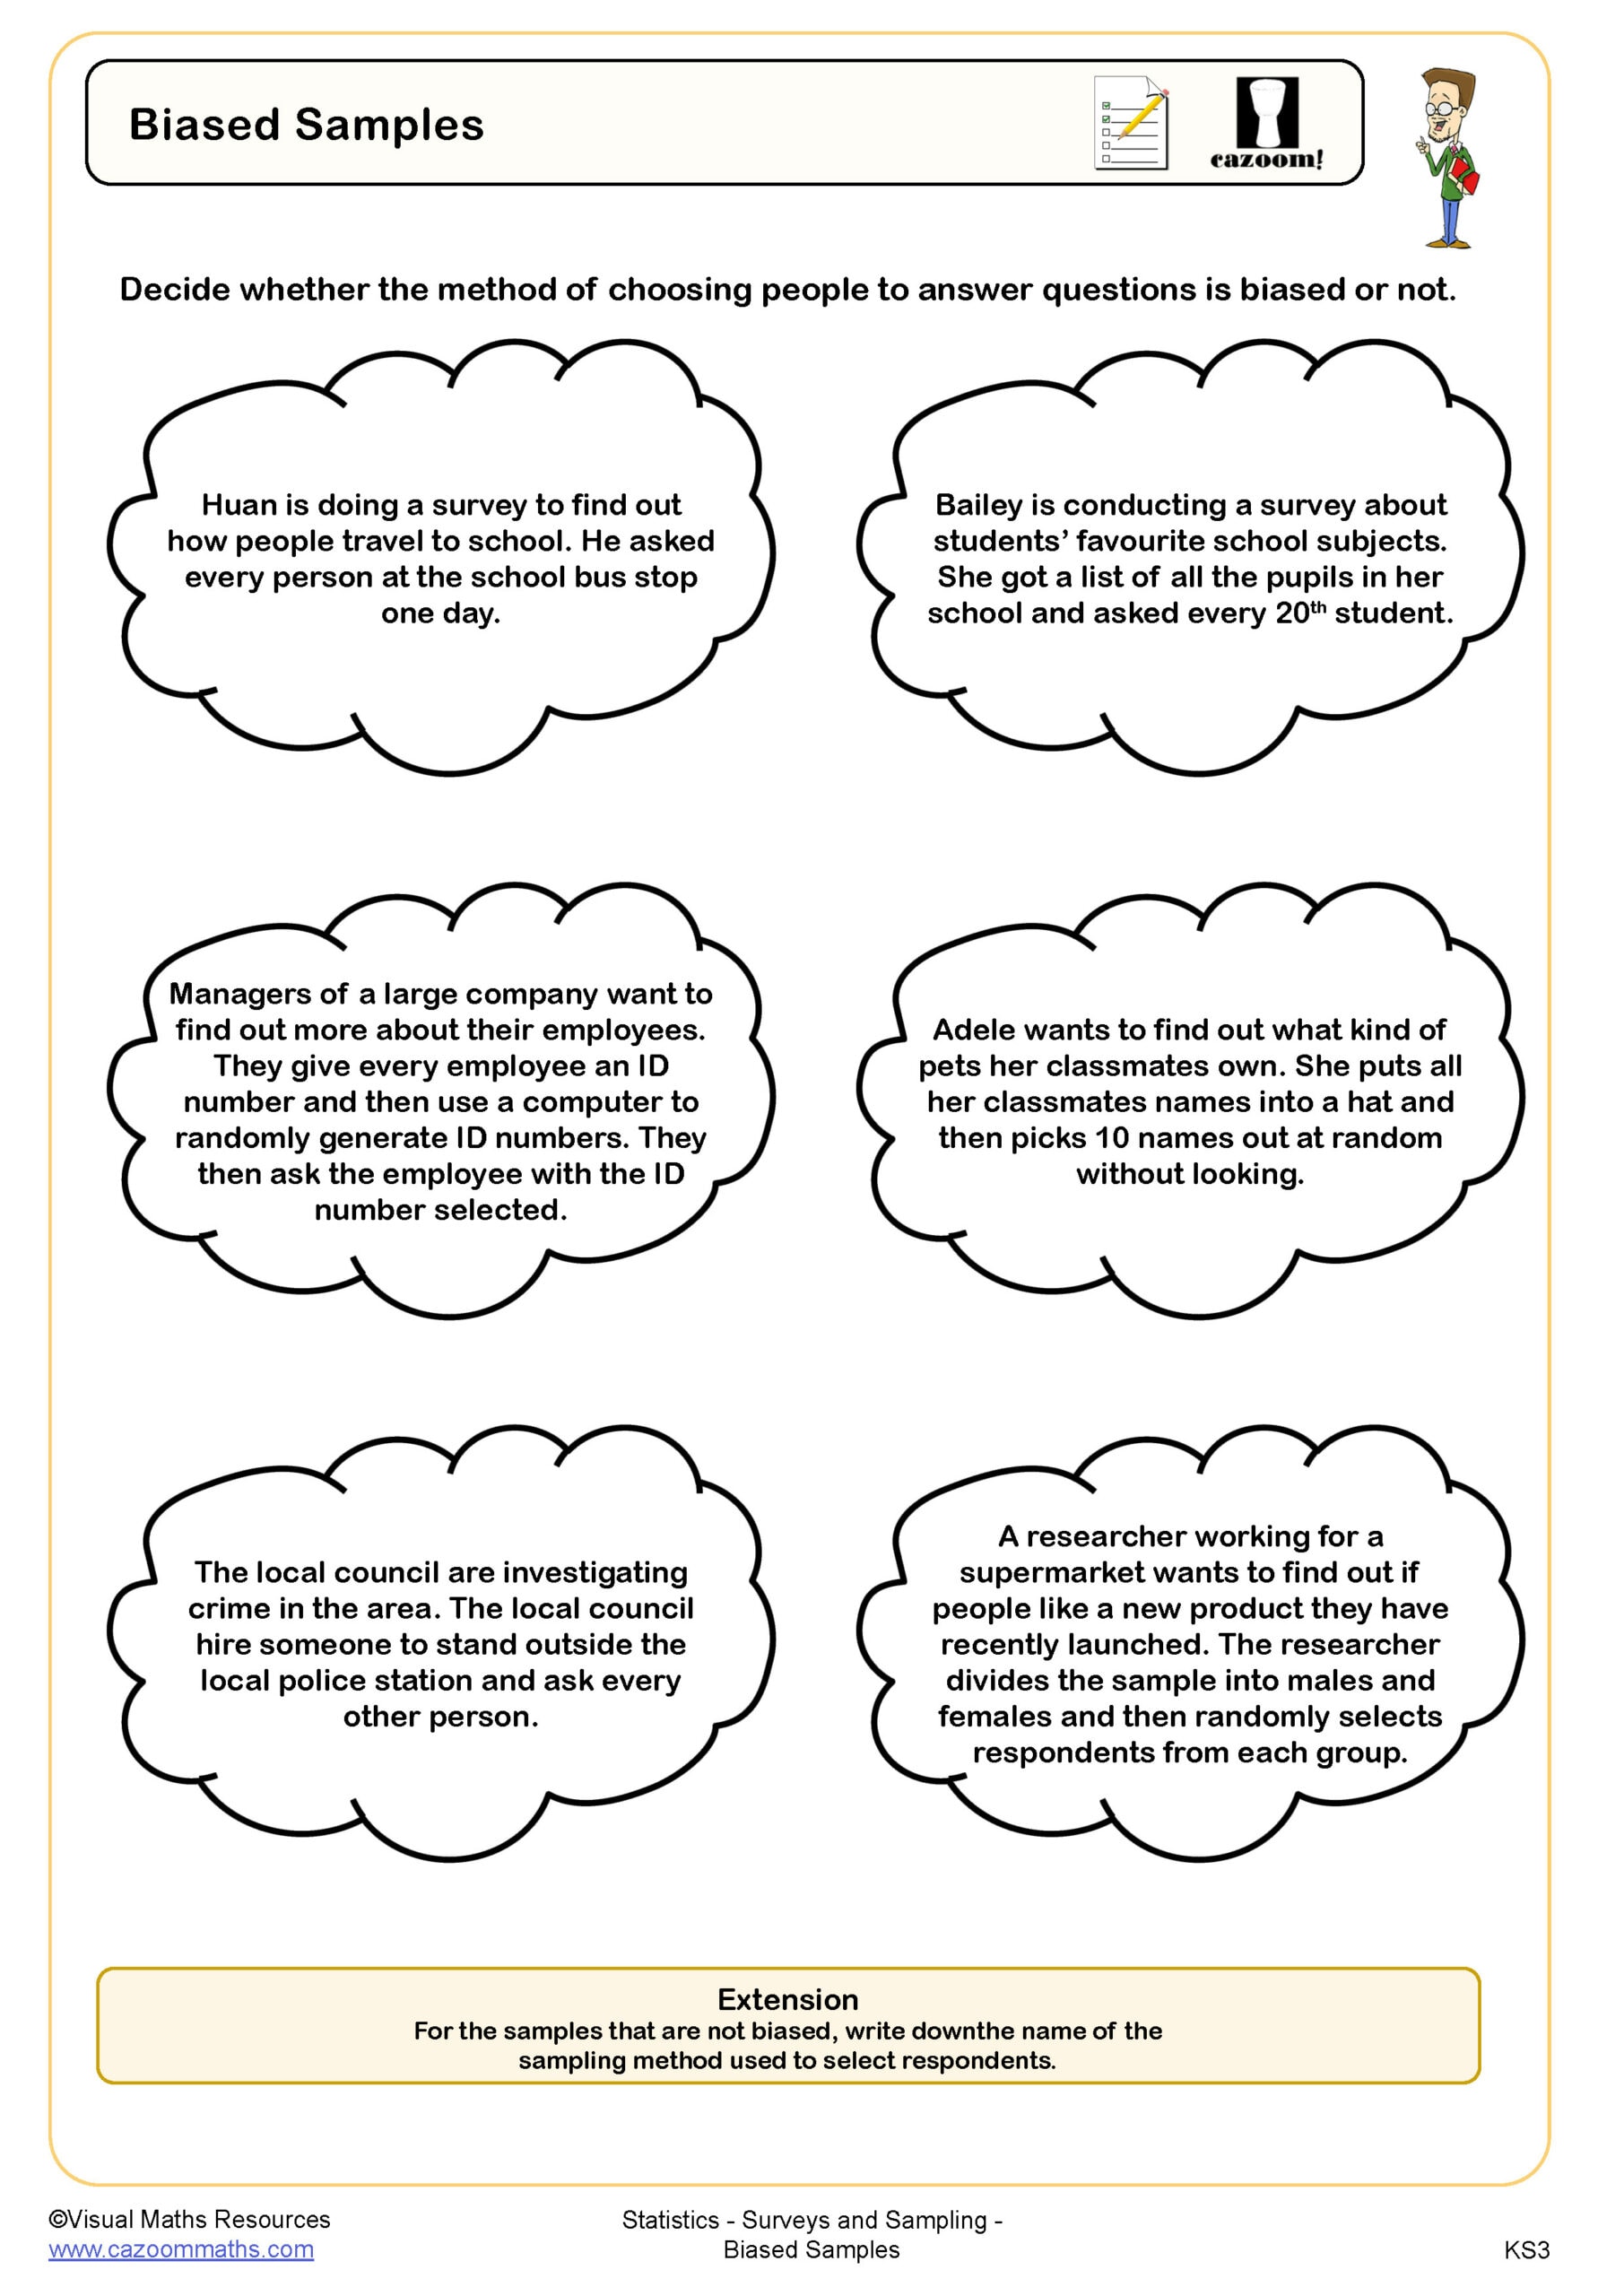
Biased Samples
Capture Recapture

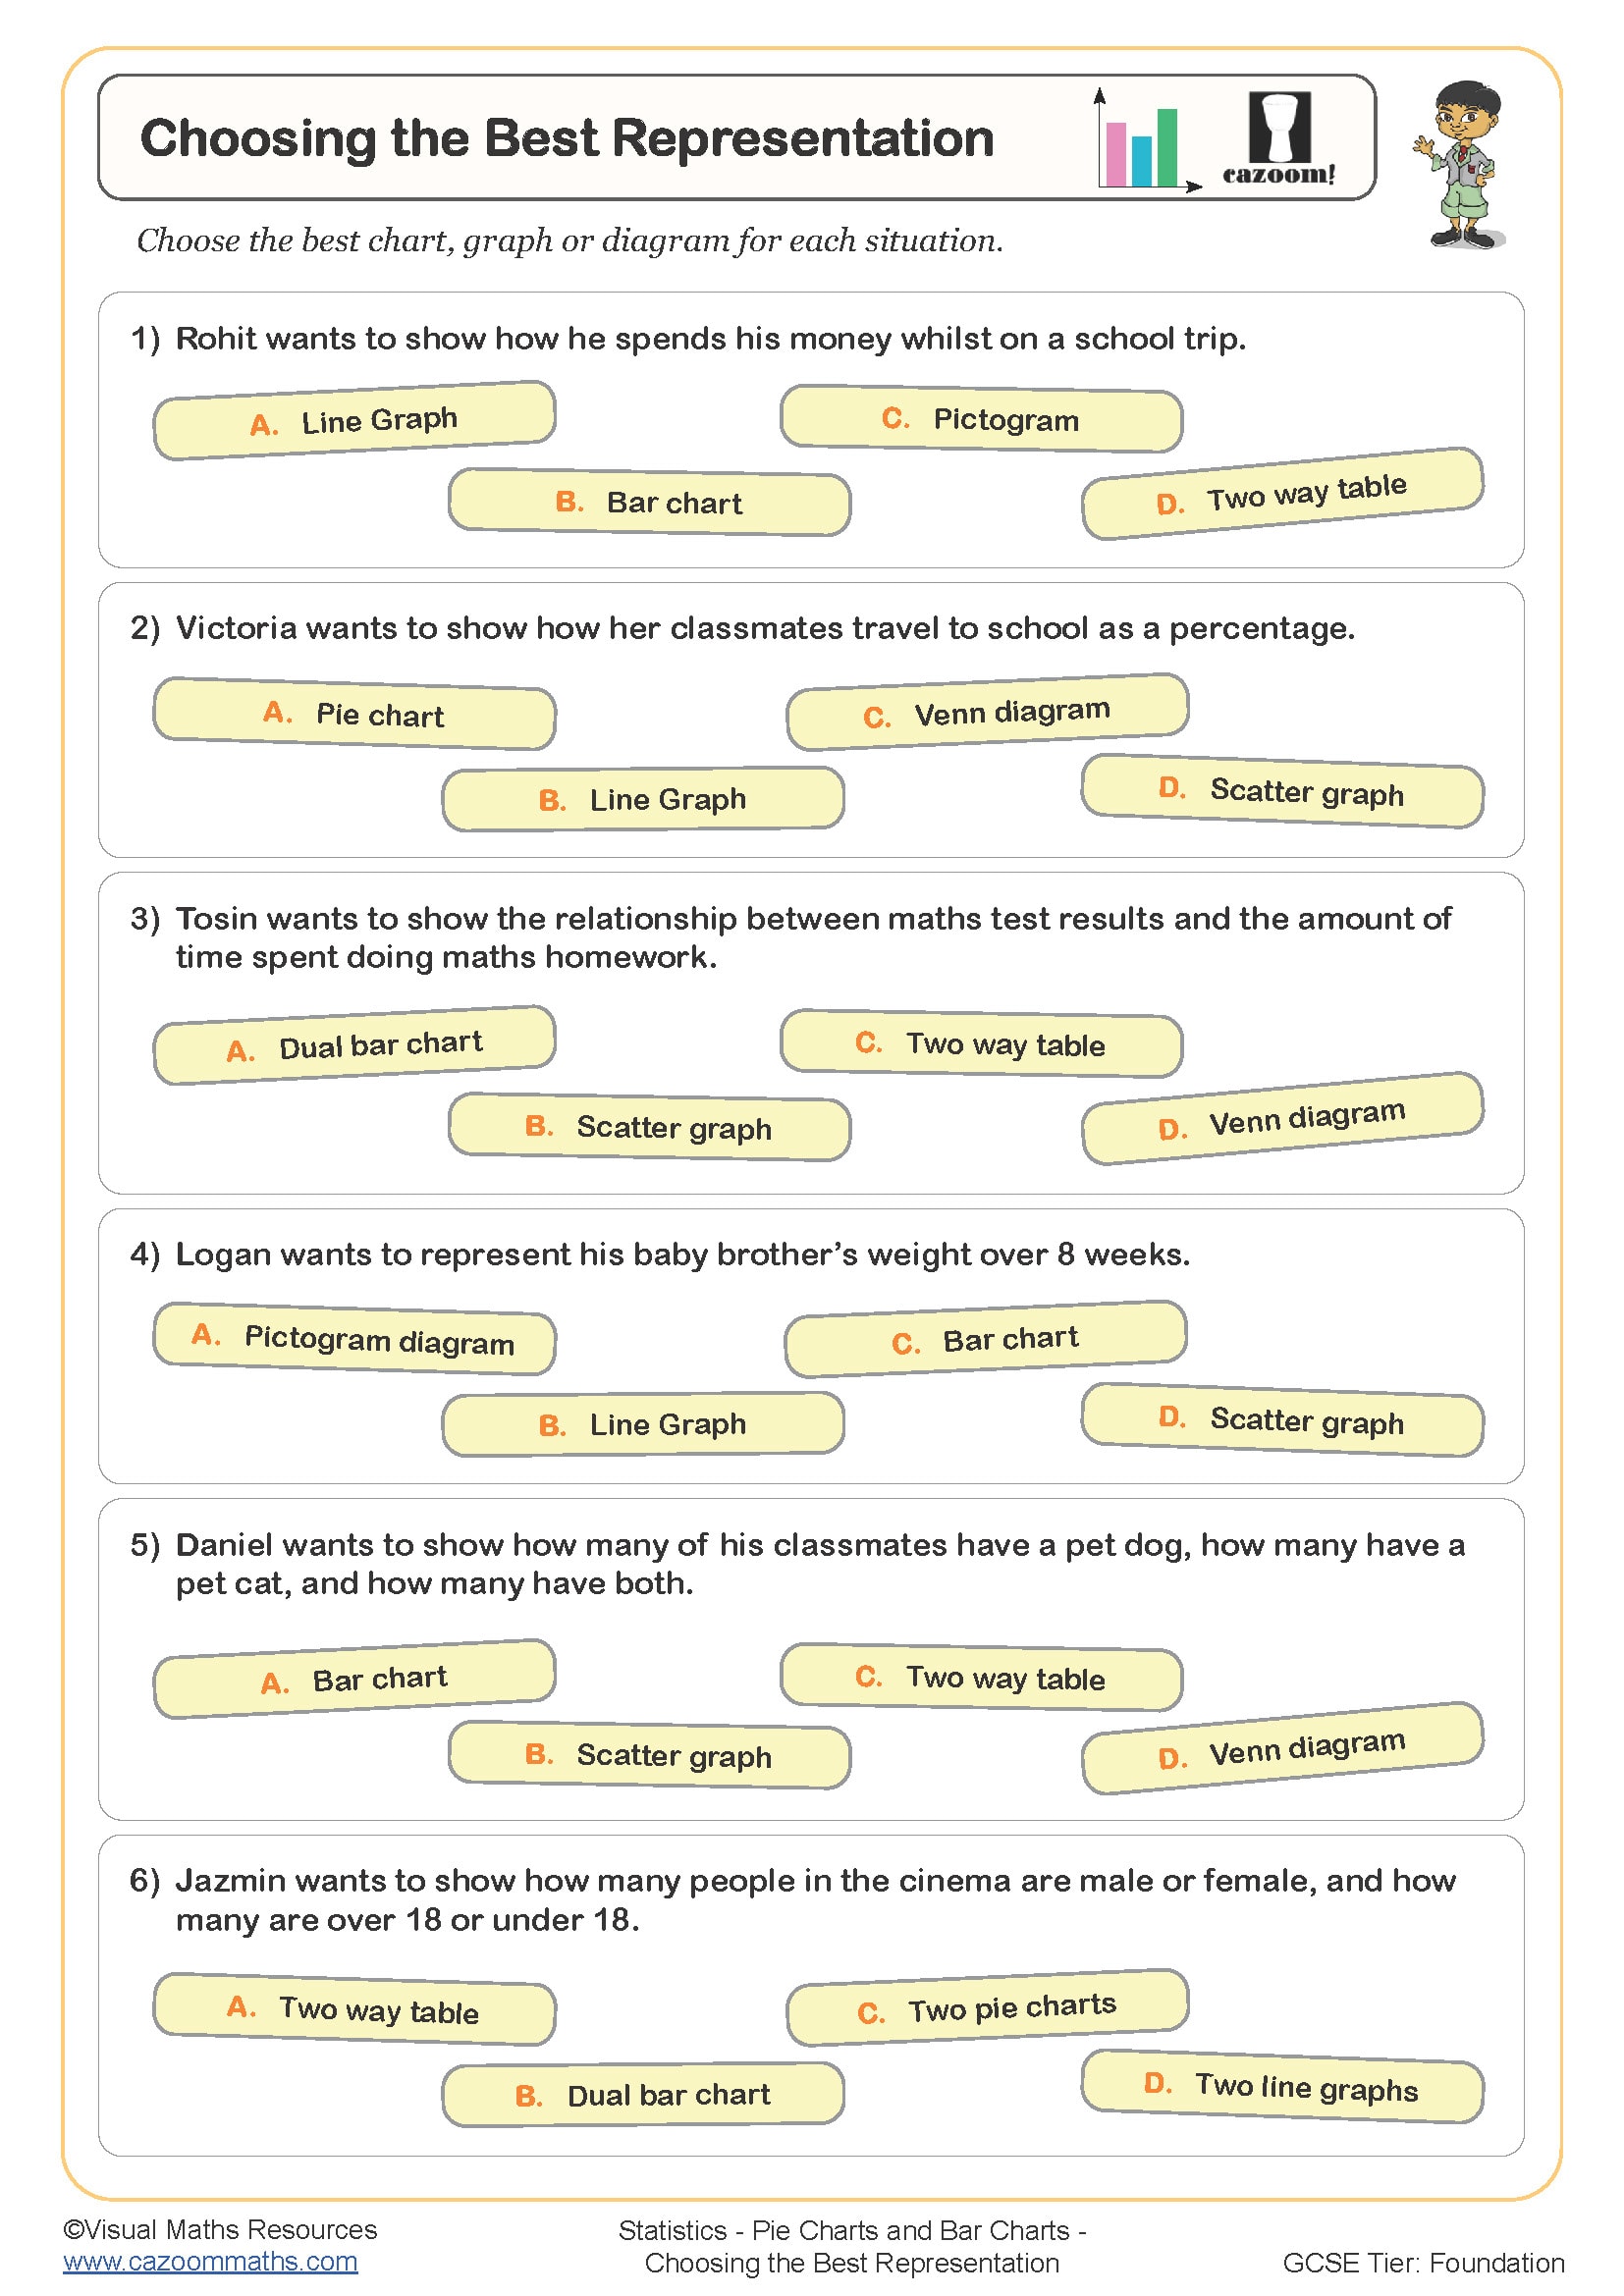
Choosing the Best Representation
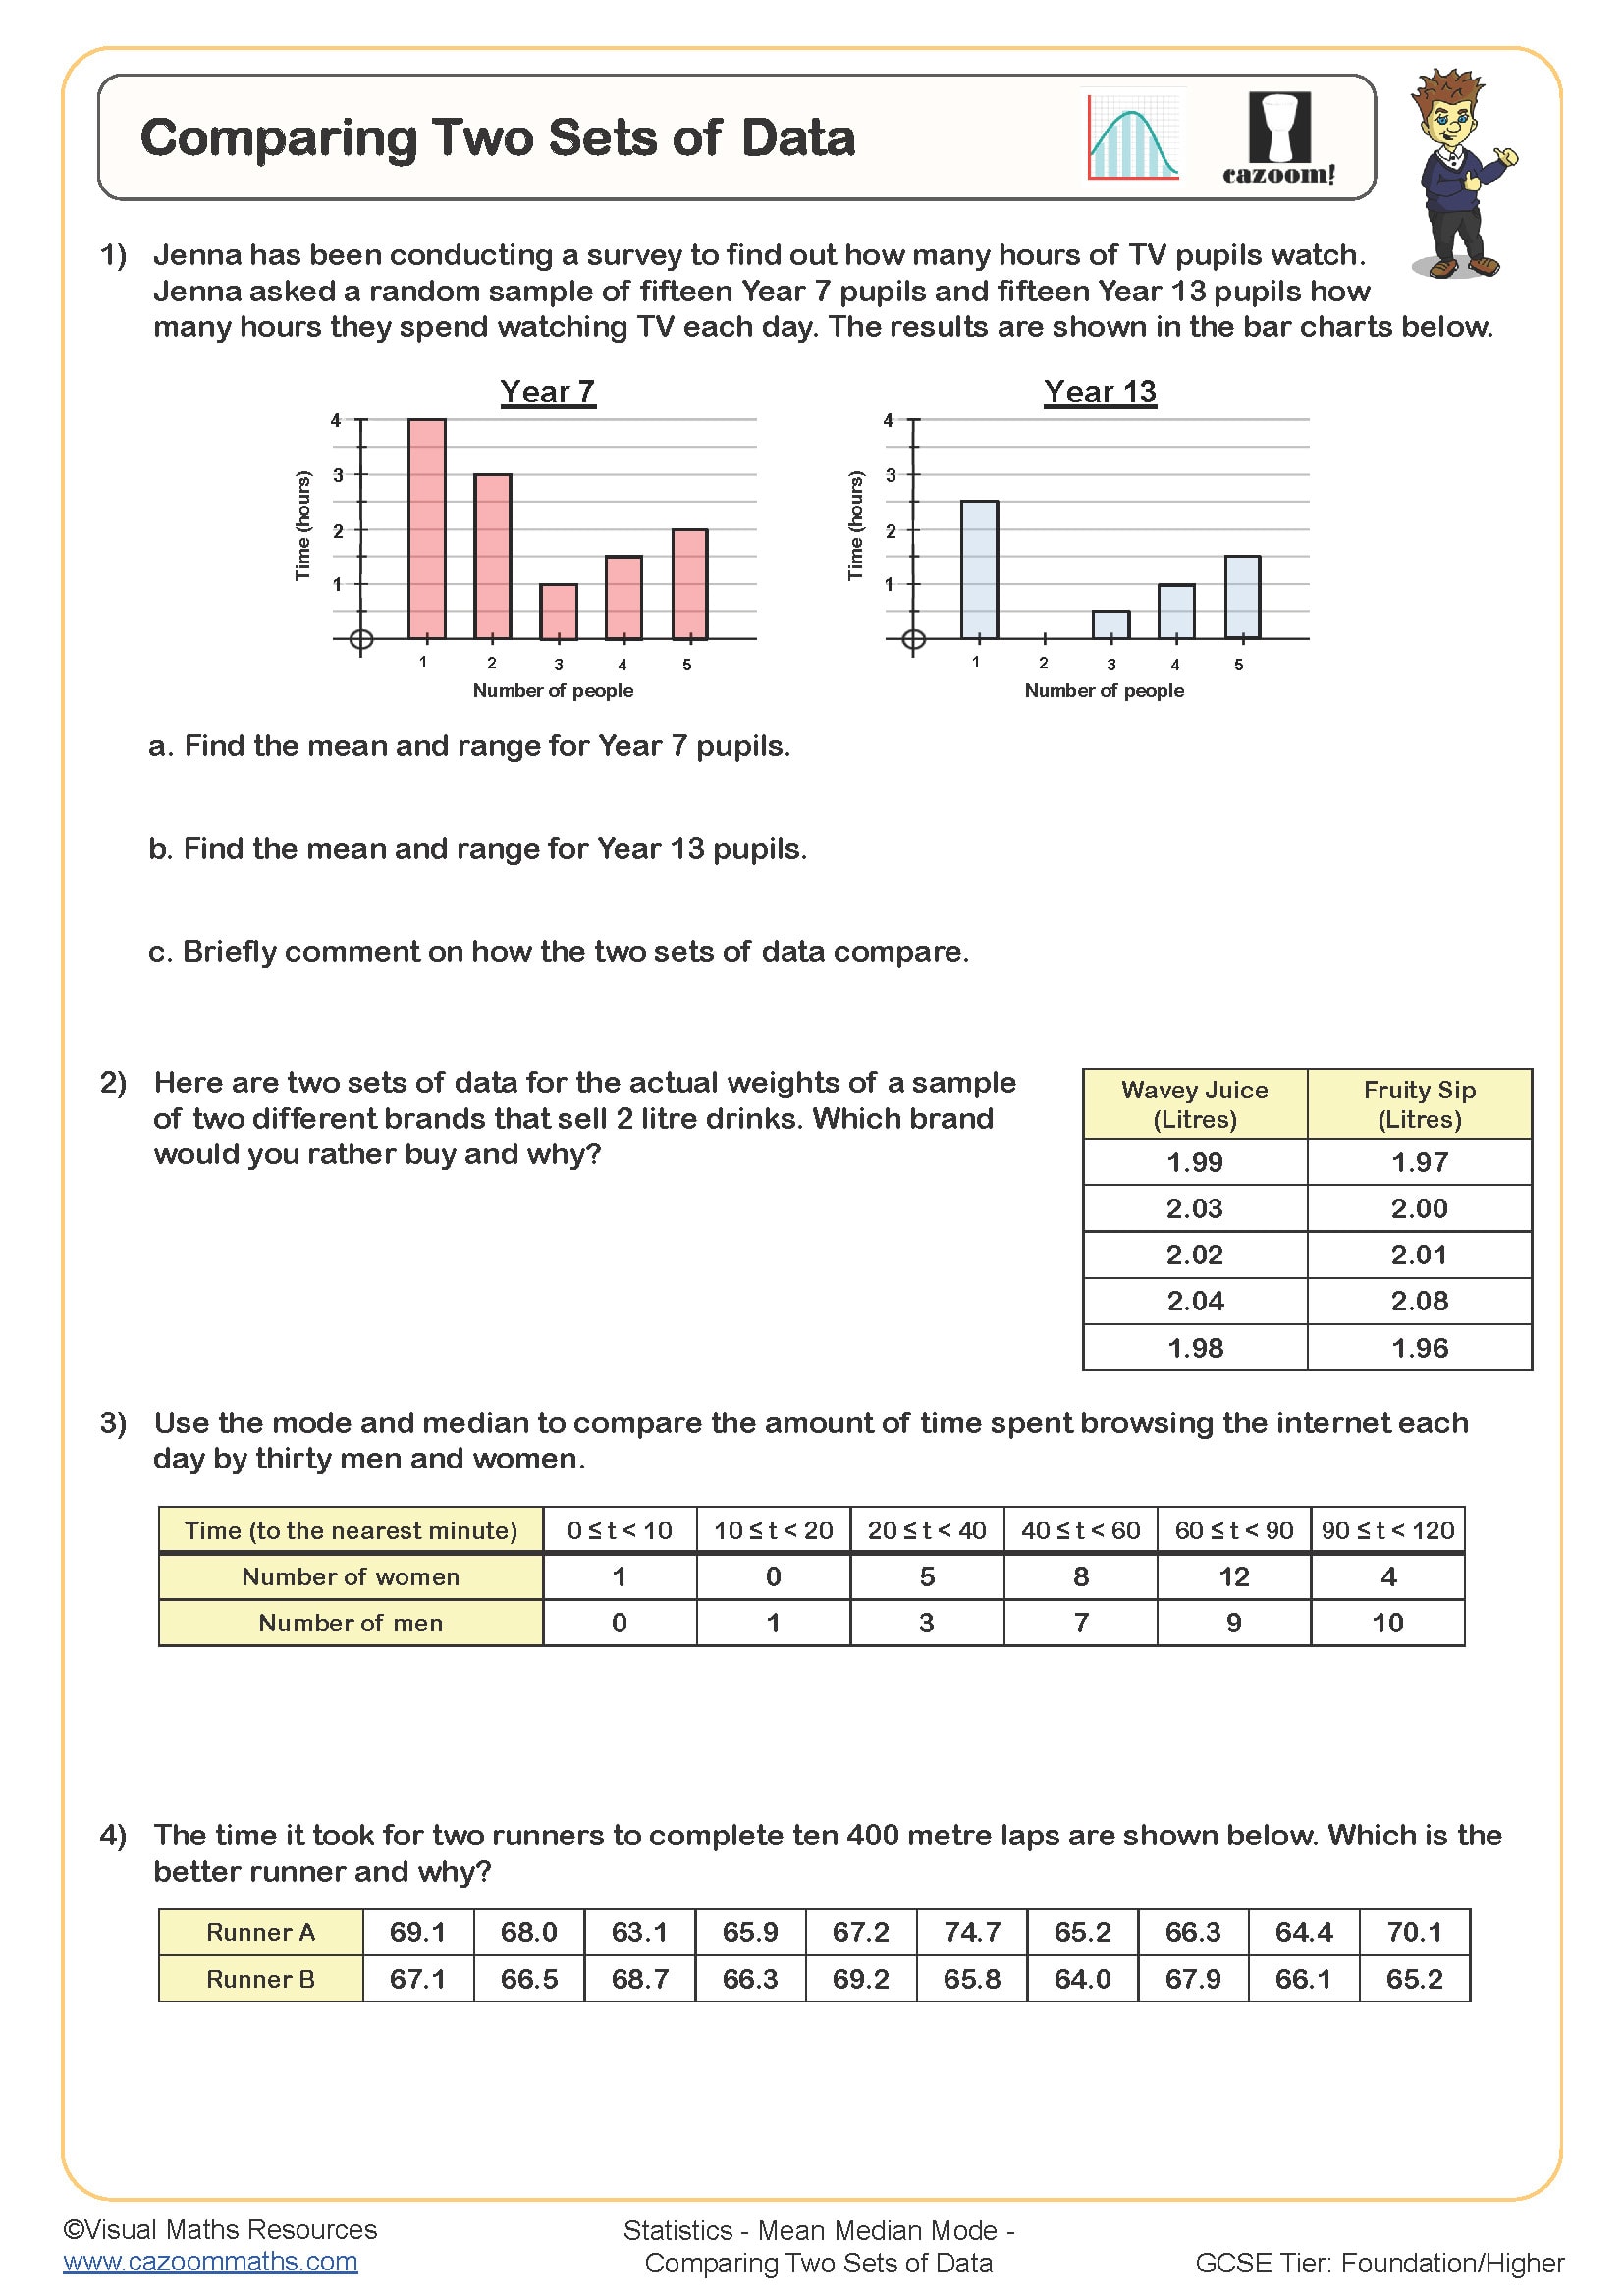
Comparing Two Sets of Data
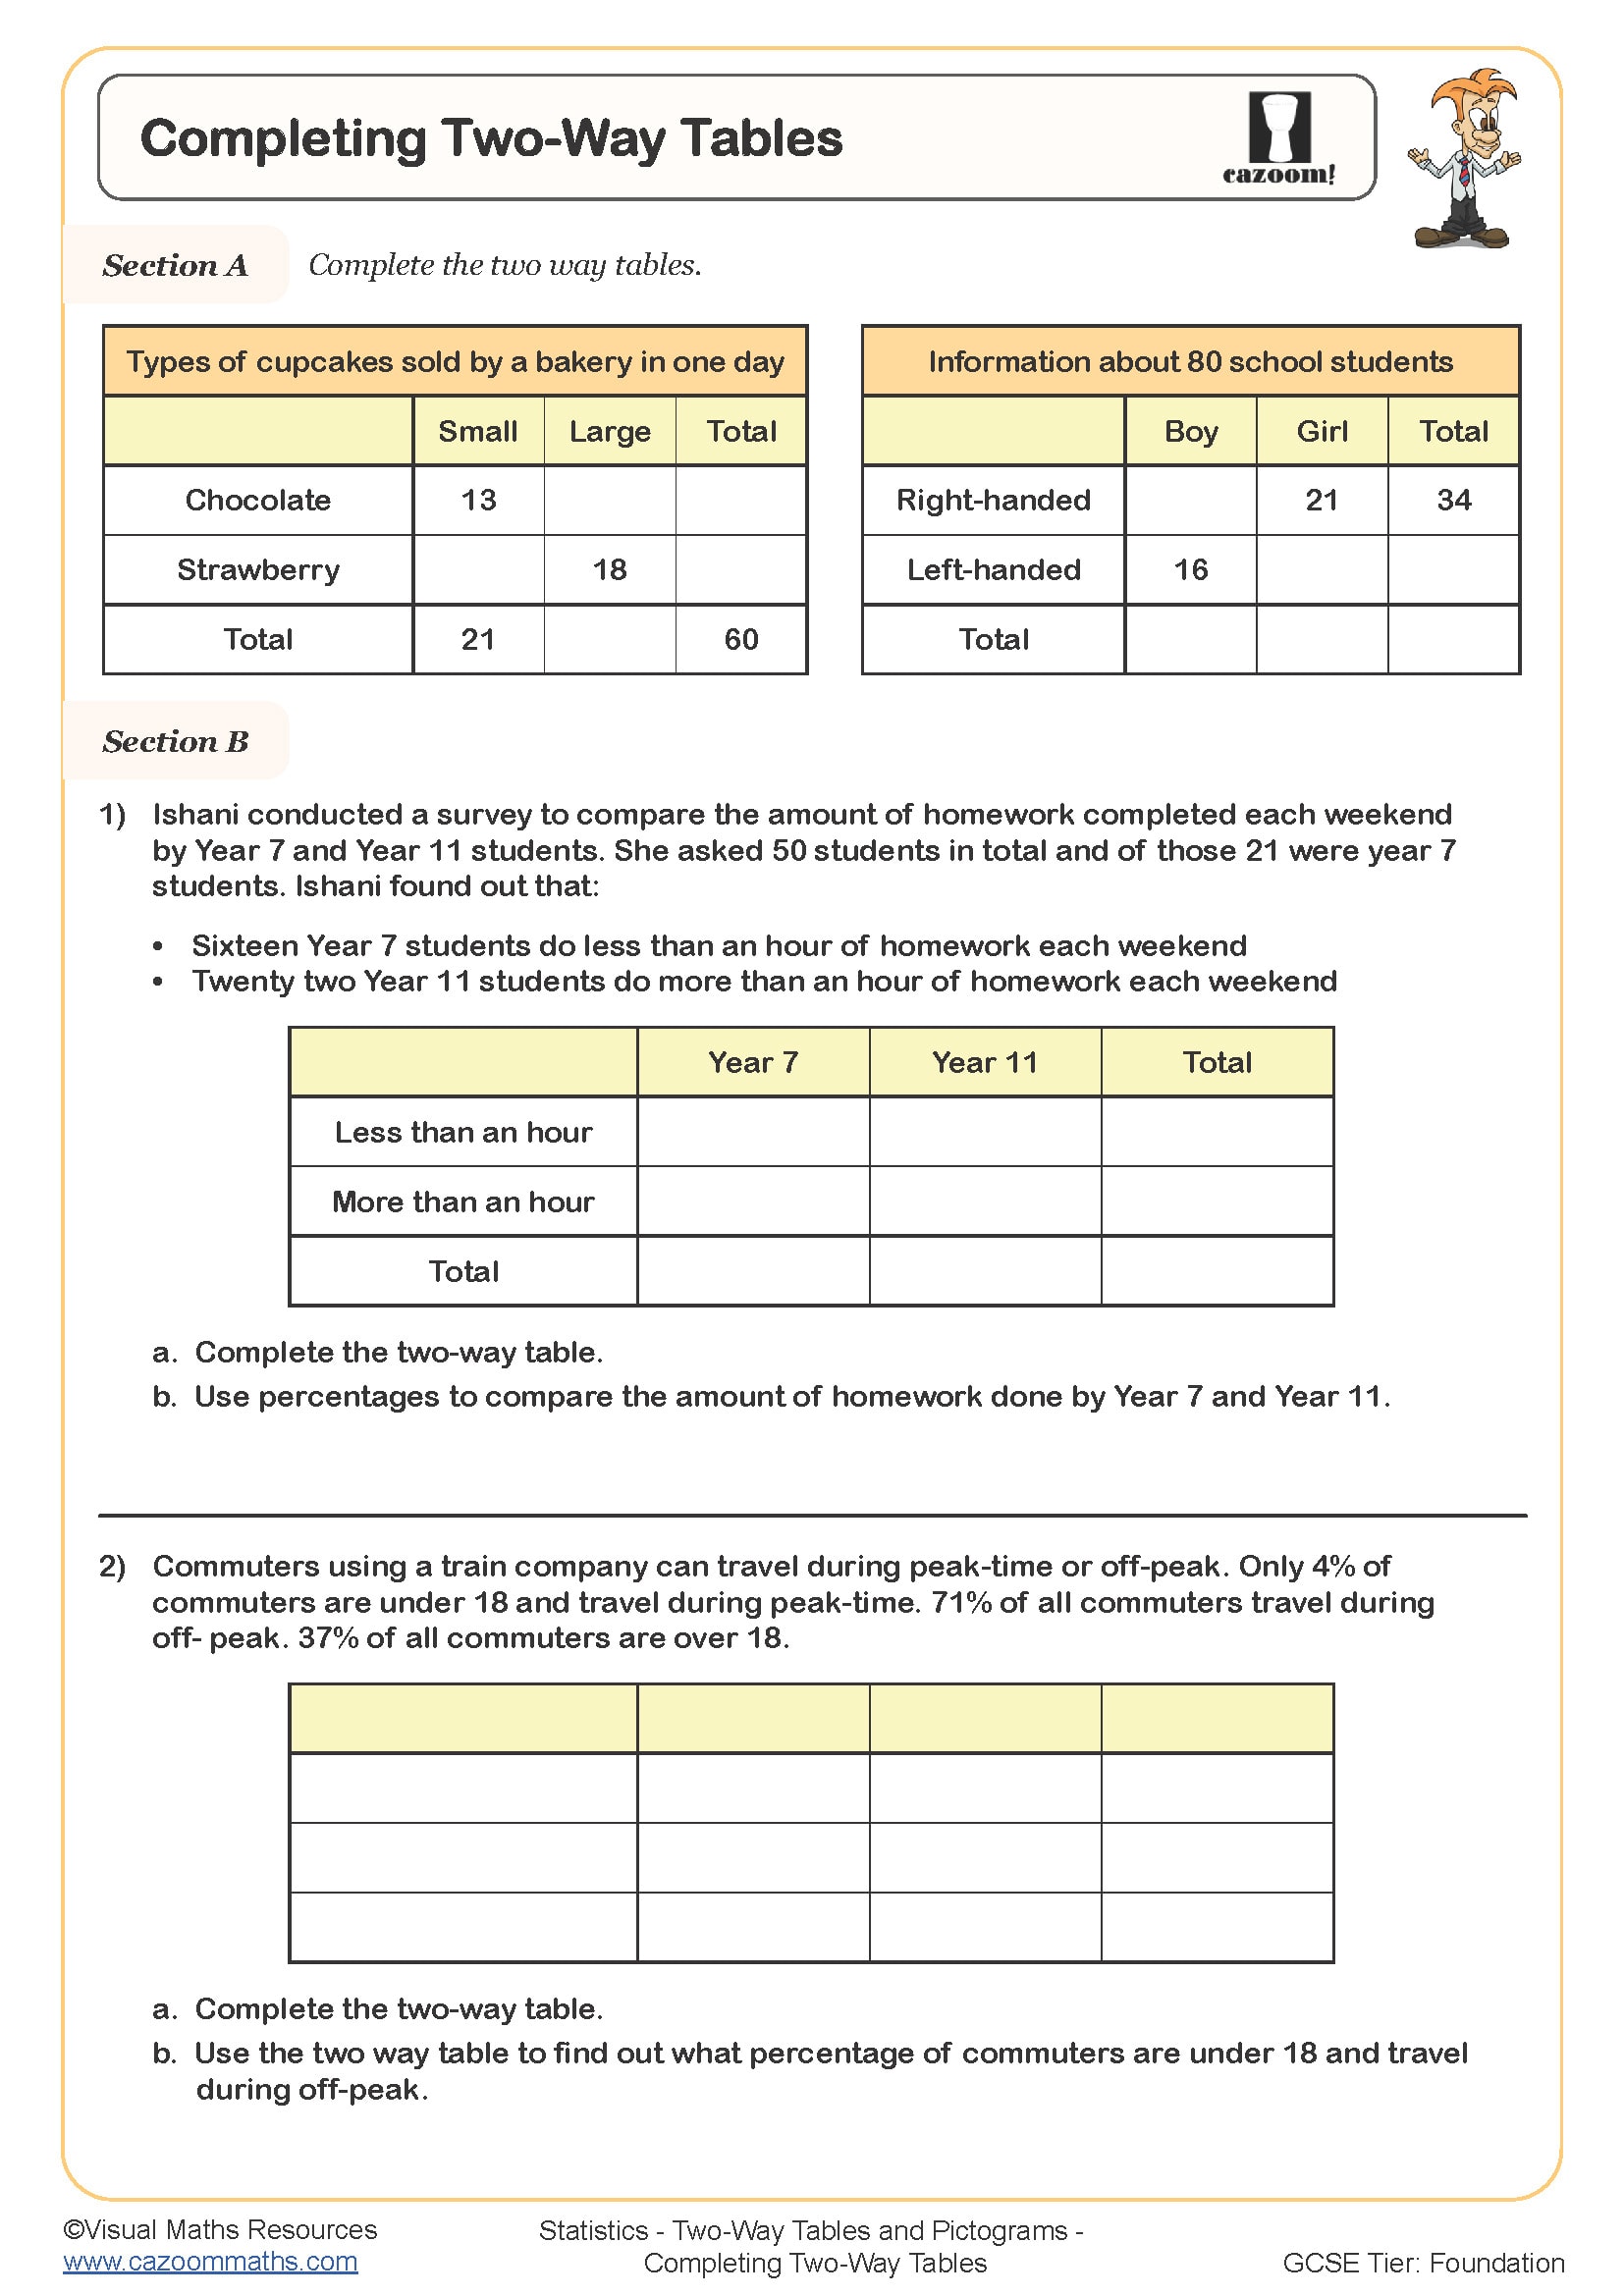
Completing Two-way Tables
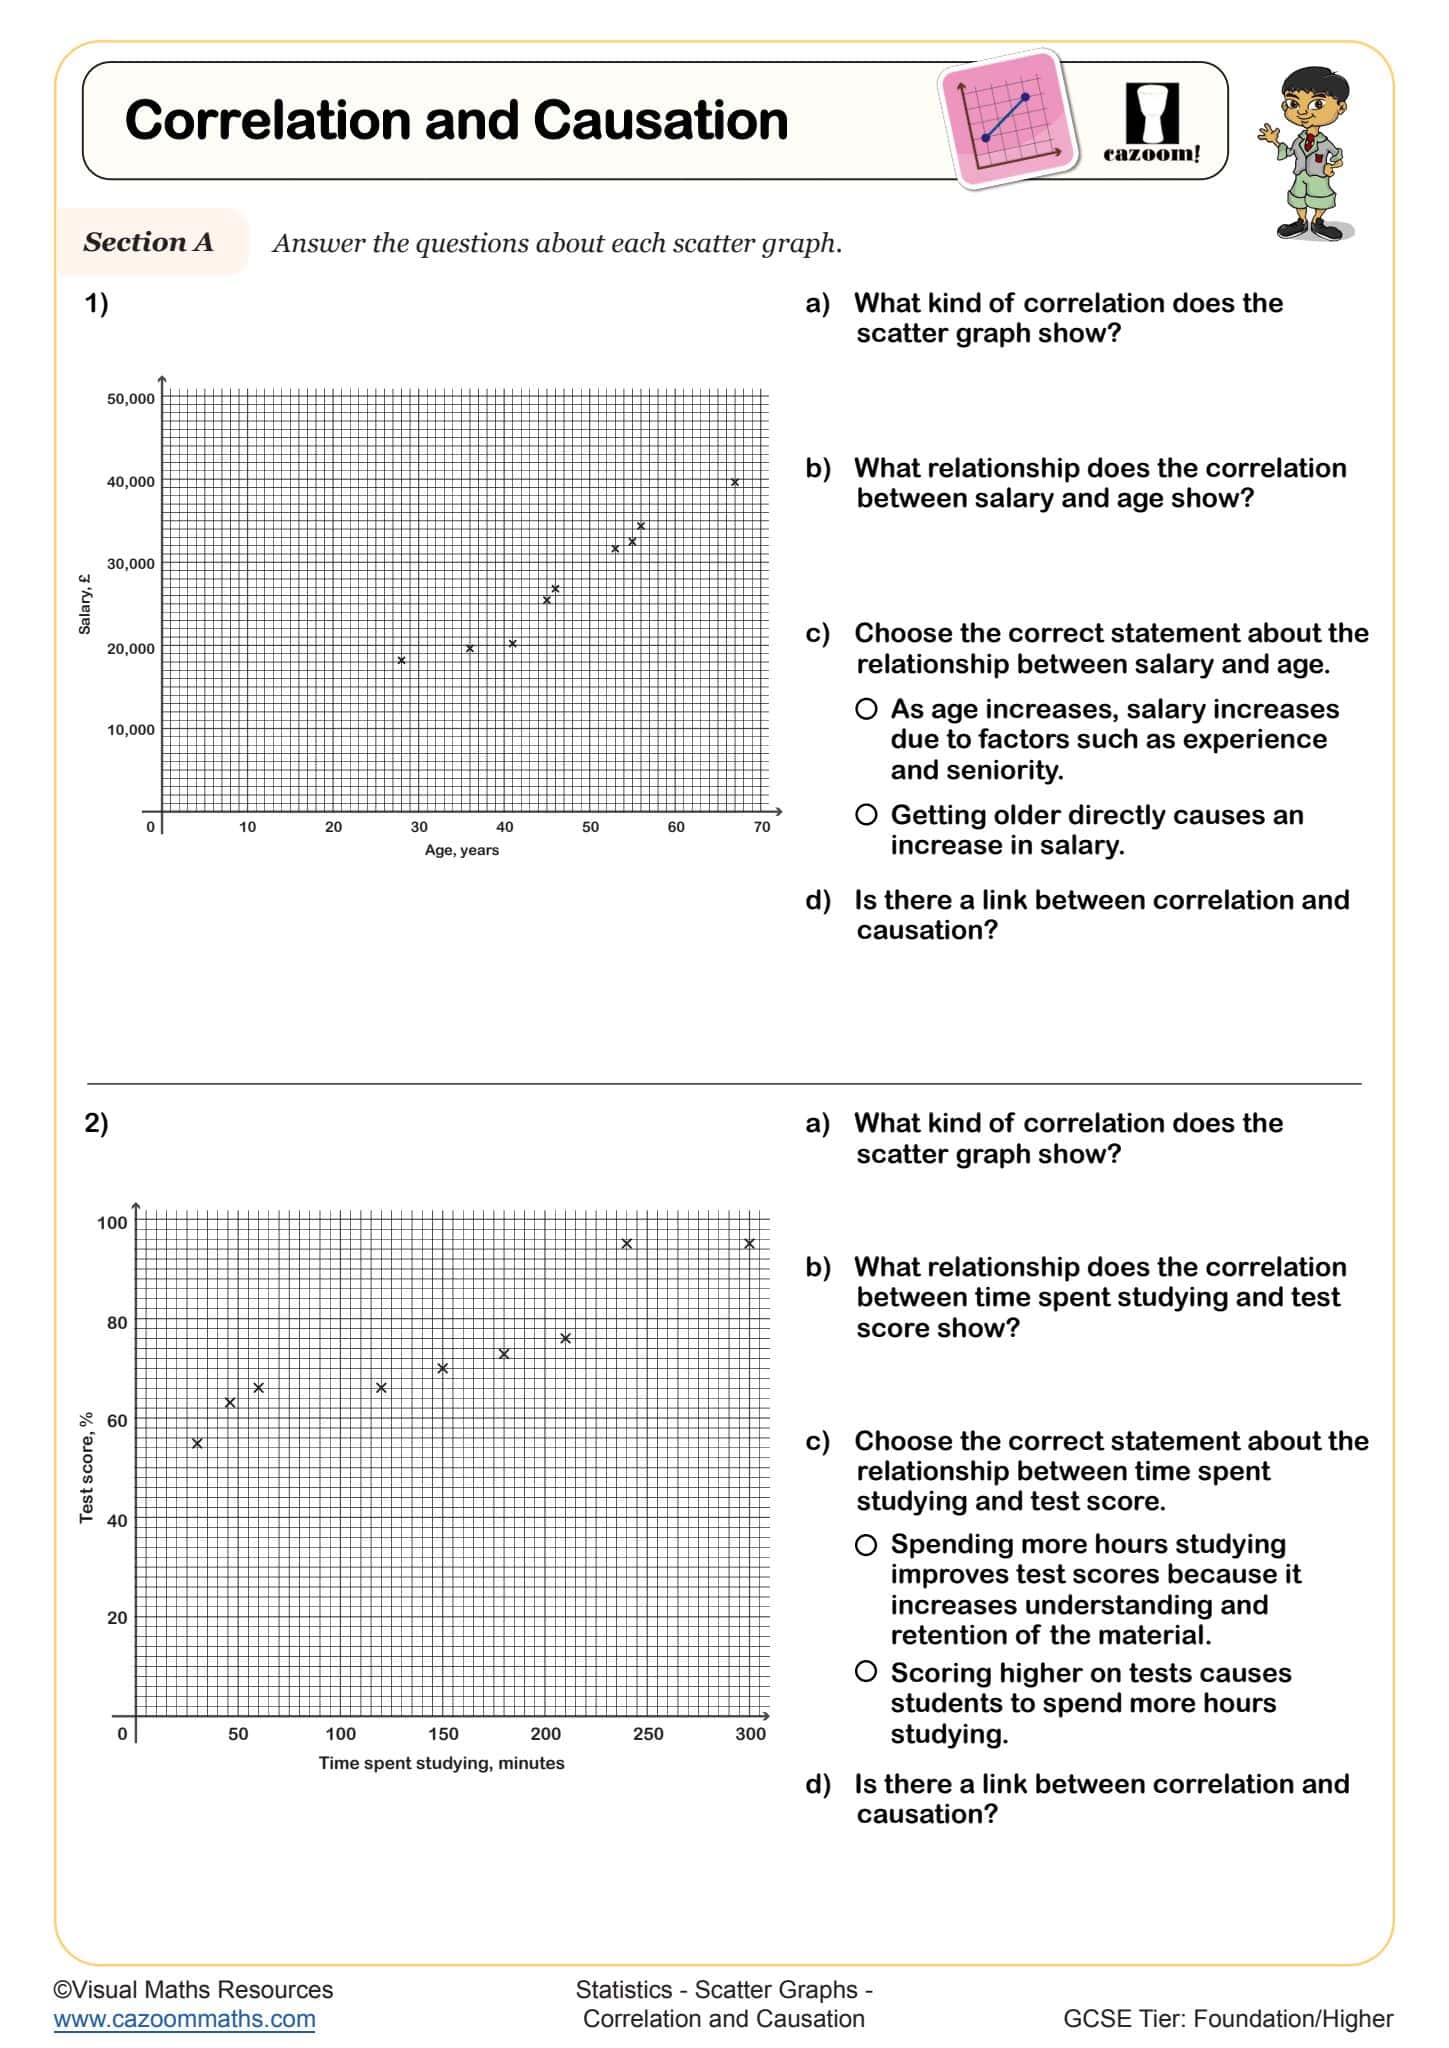
Correlation and Causation
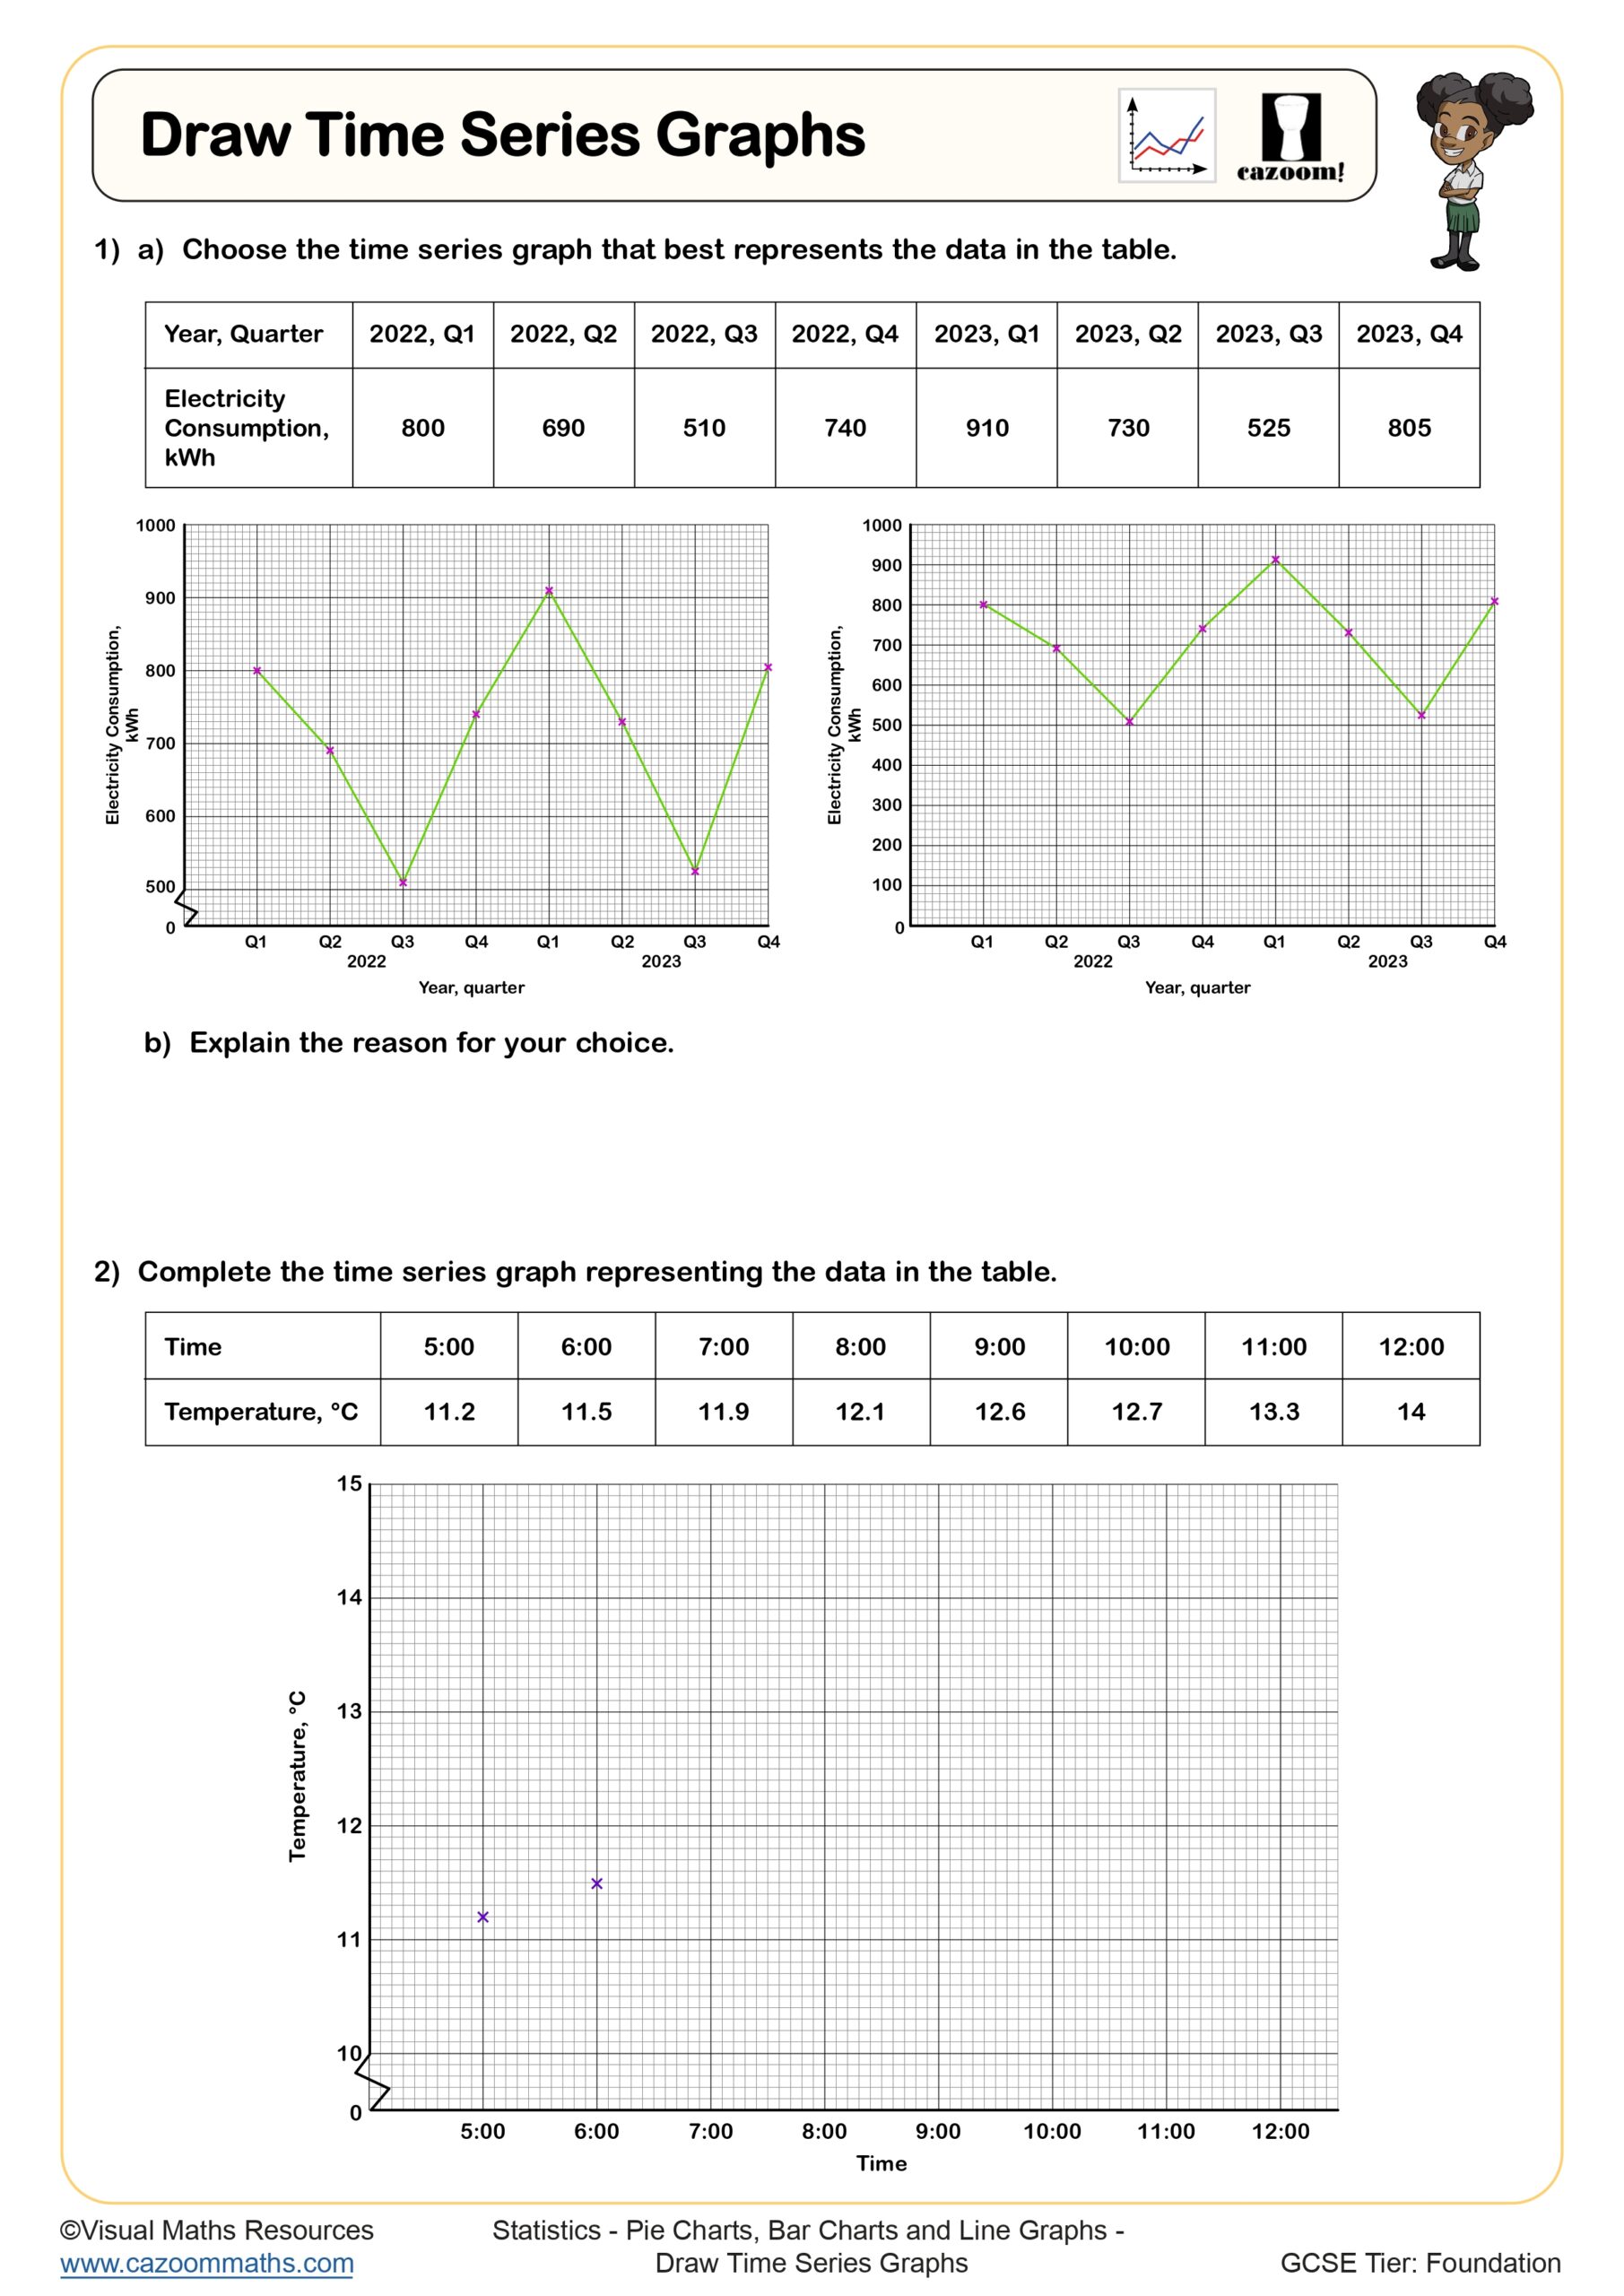
Draw Time Series Graphs
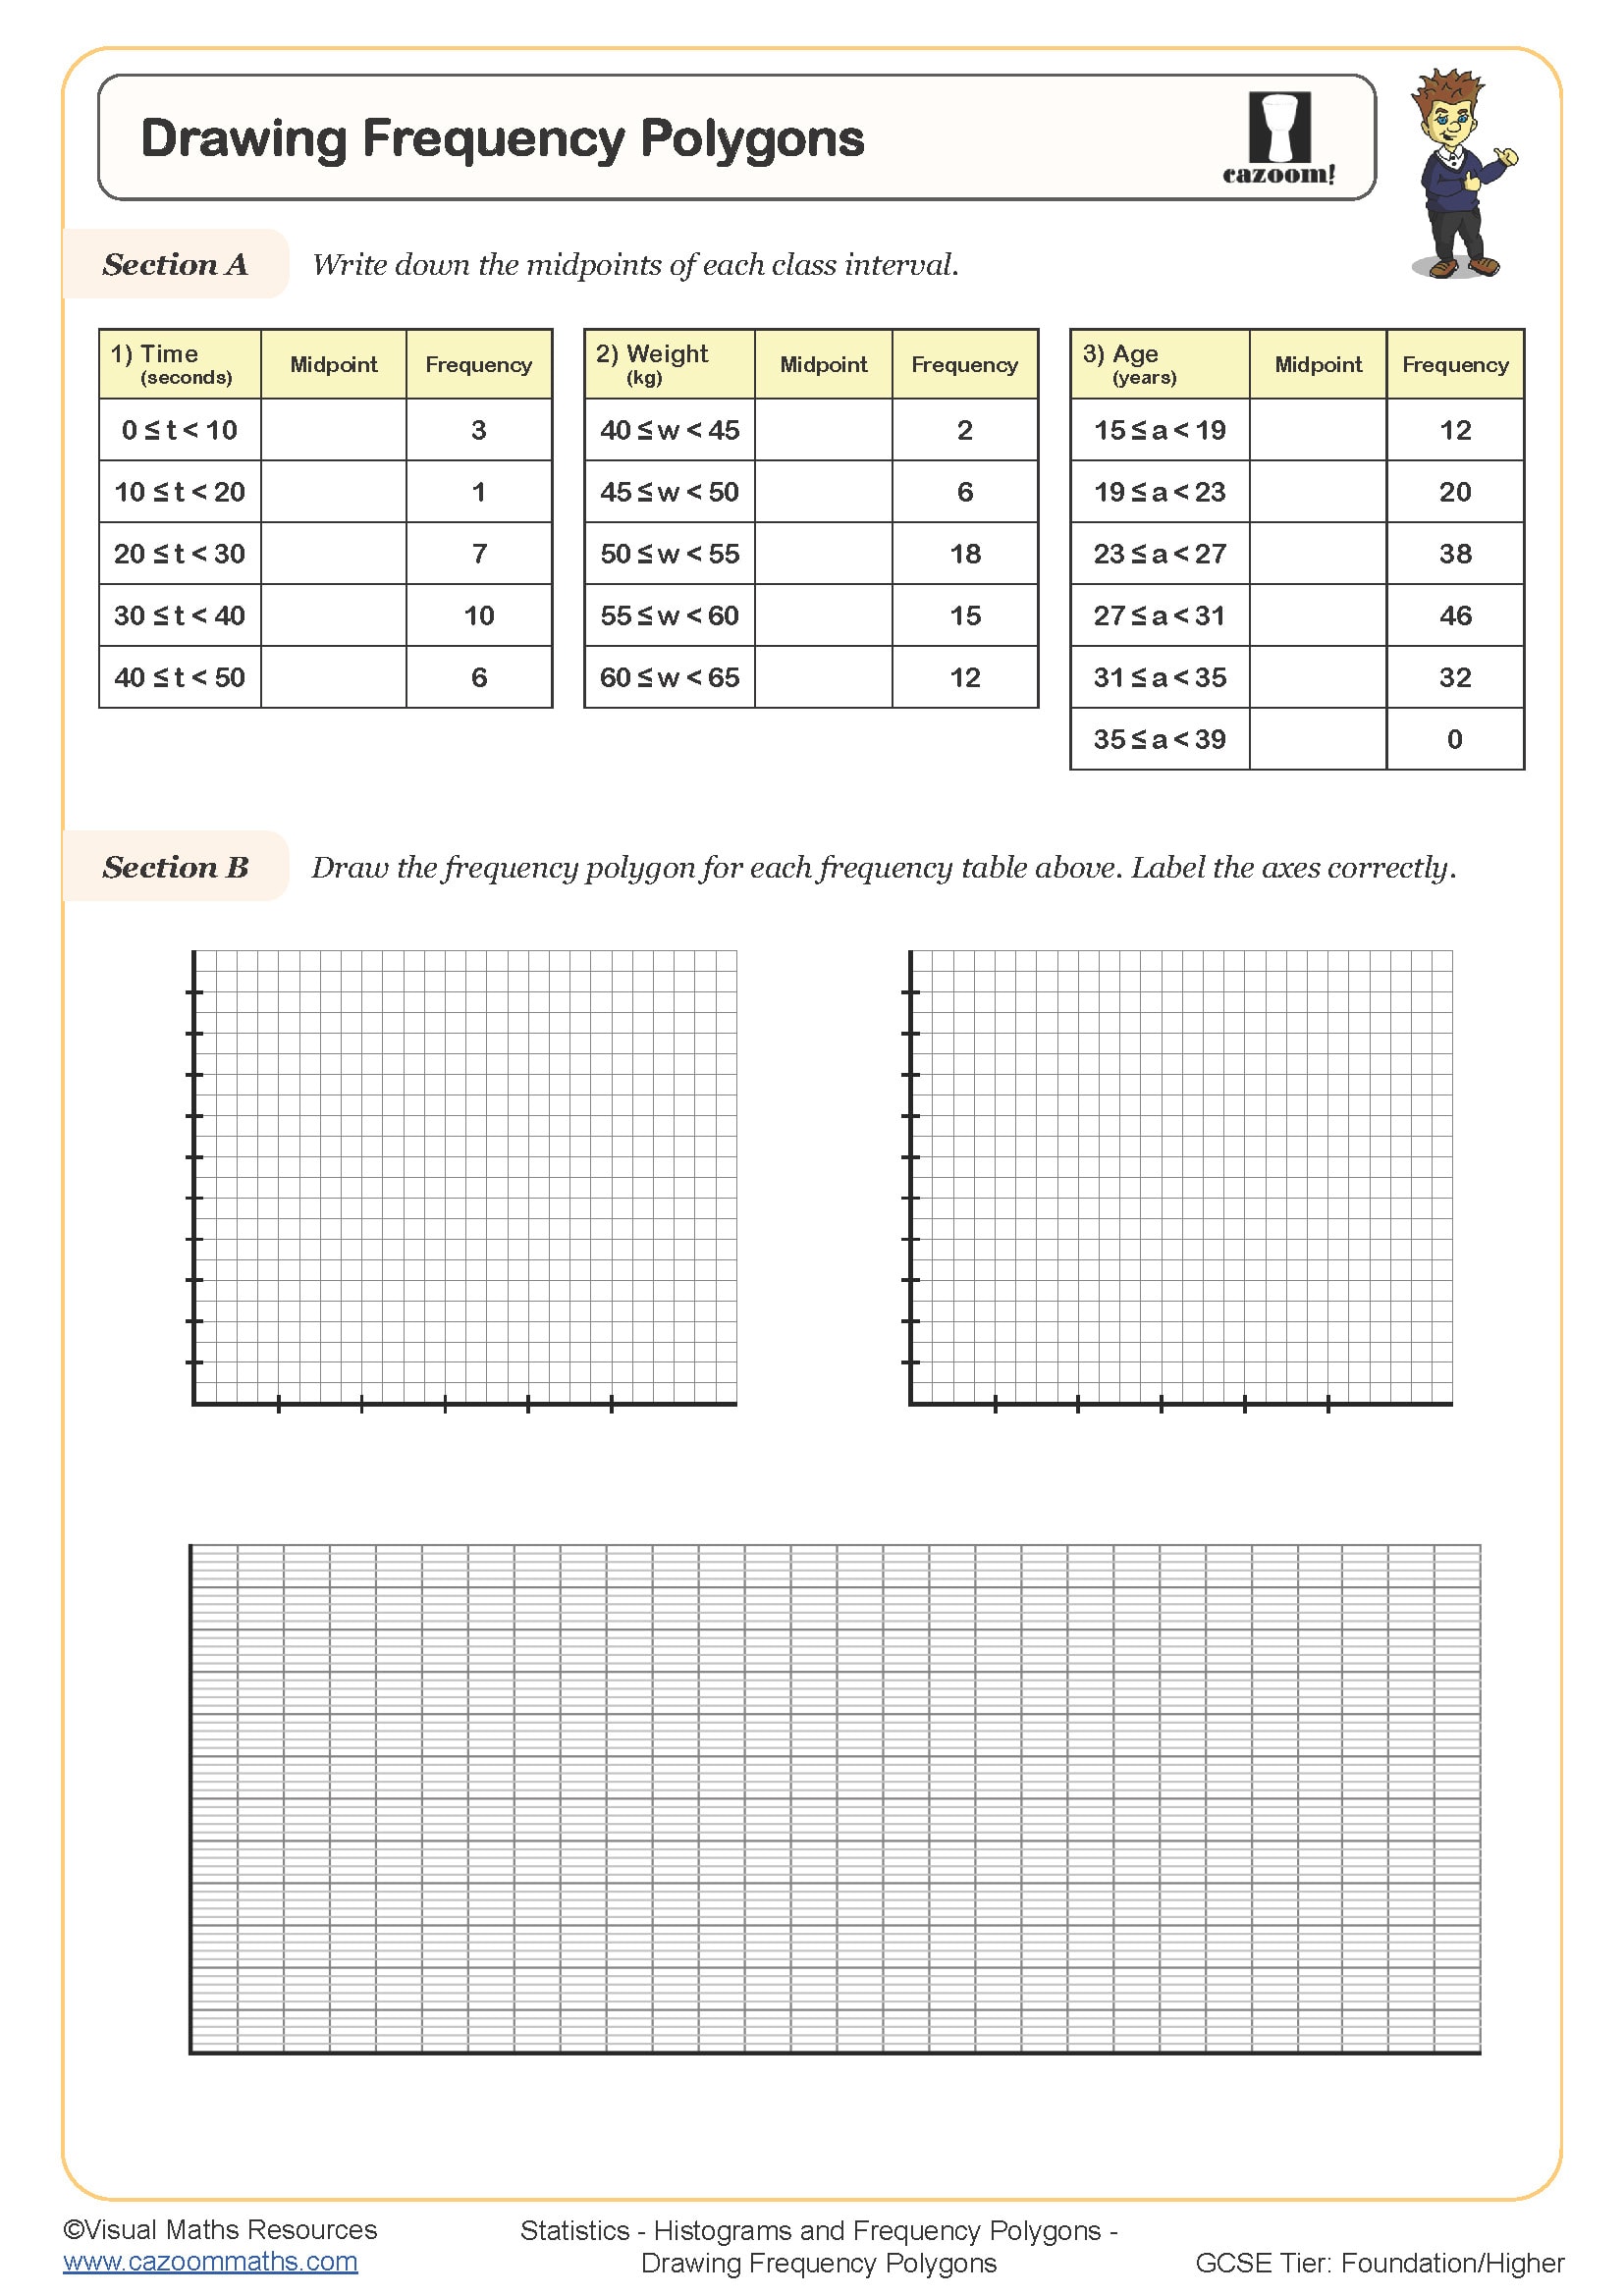
Drawing Frequency Polygons
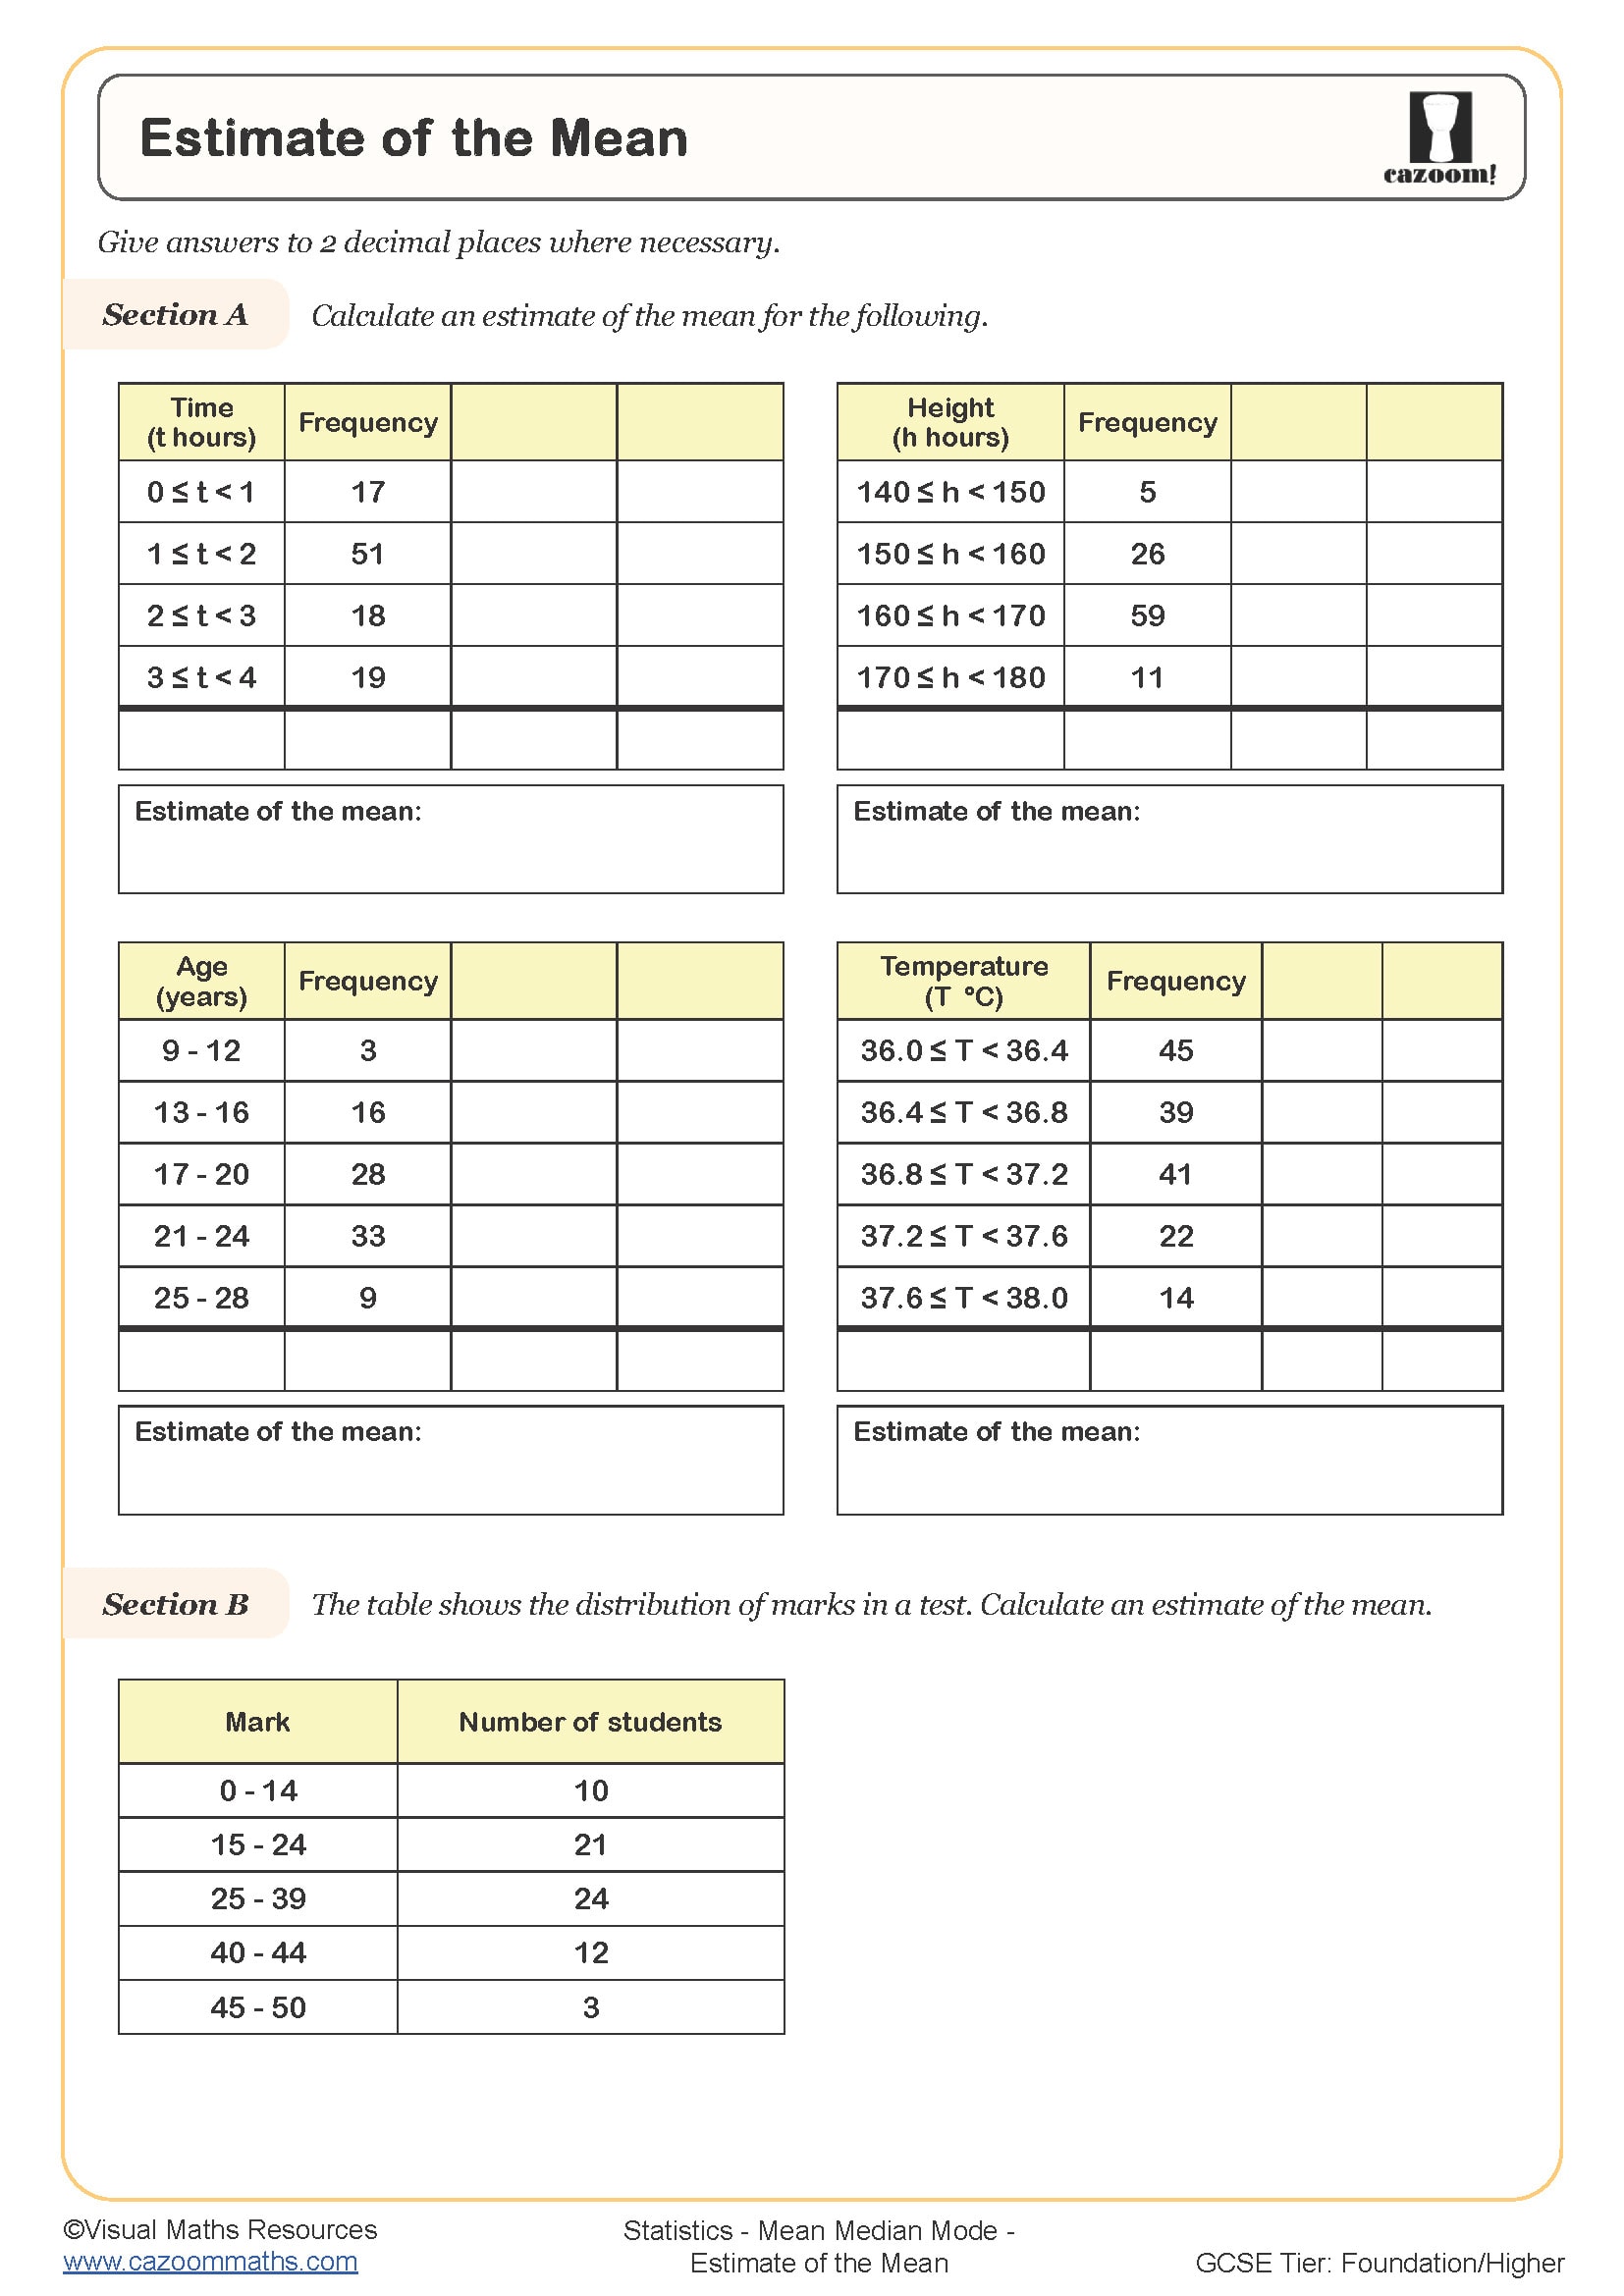
Estimate of the Mean
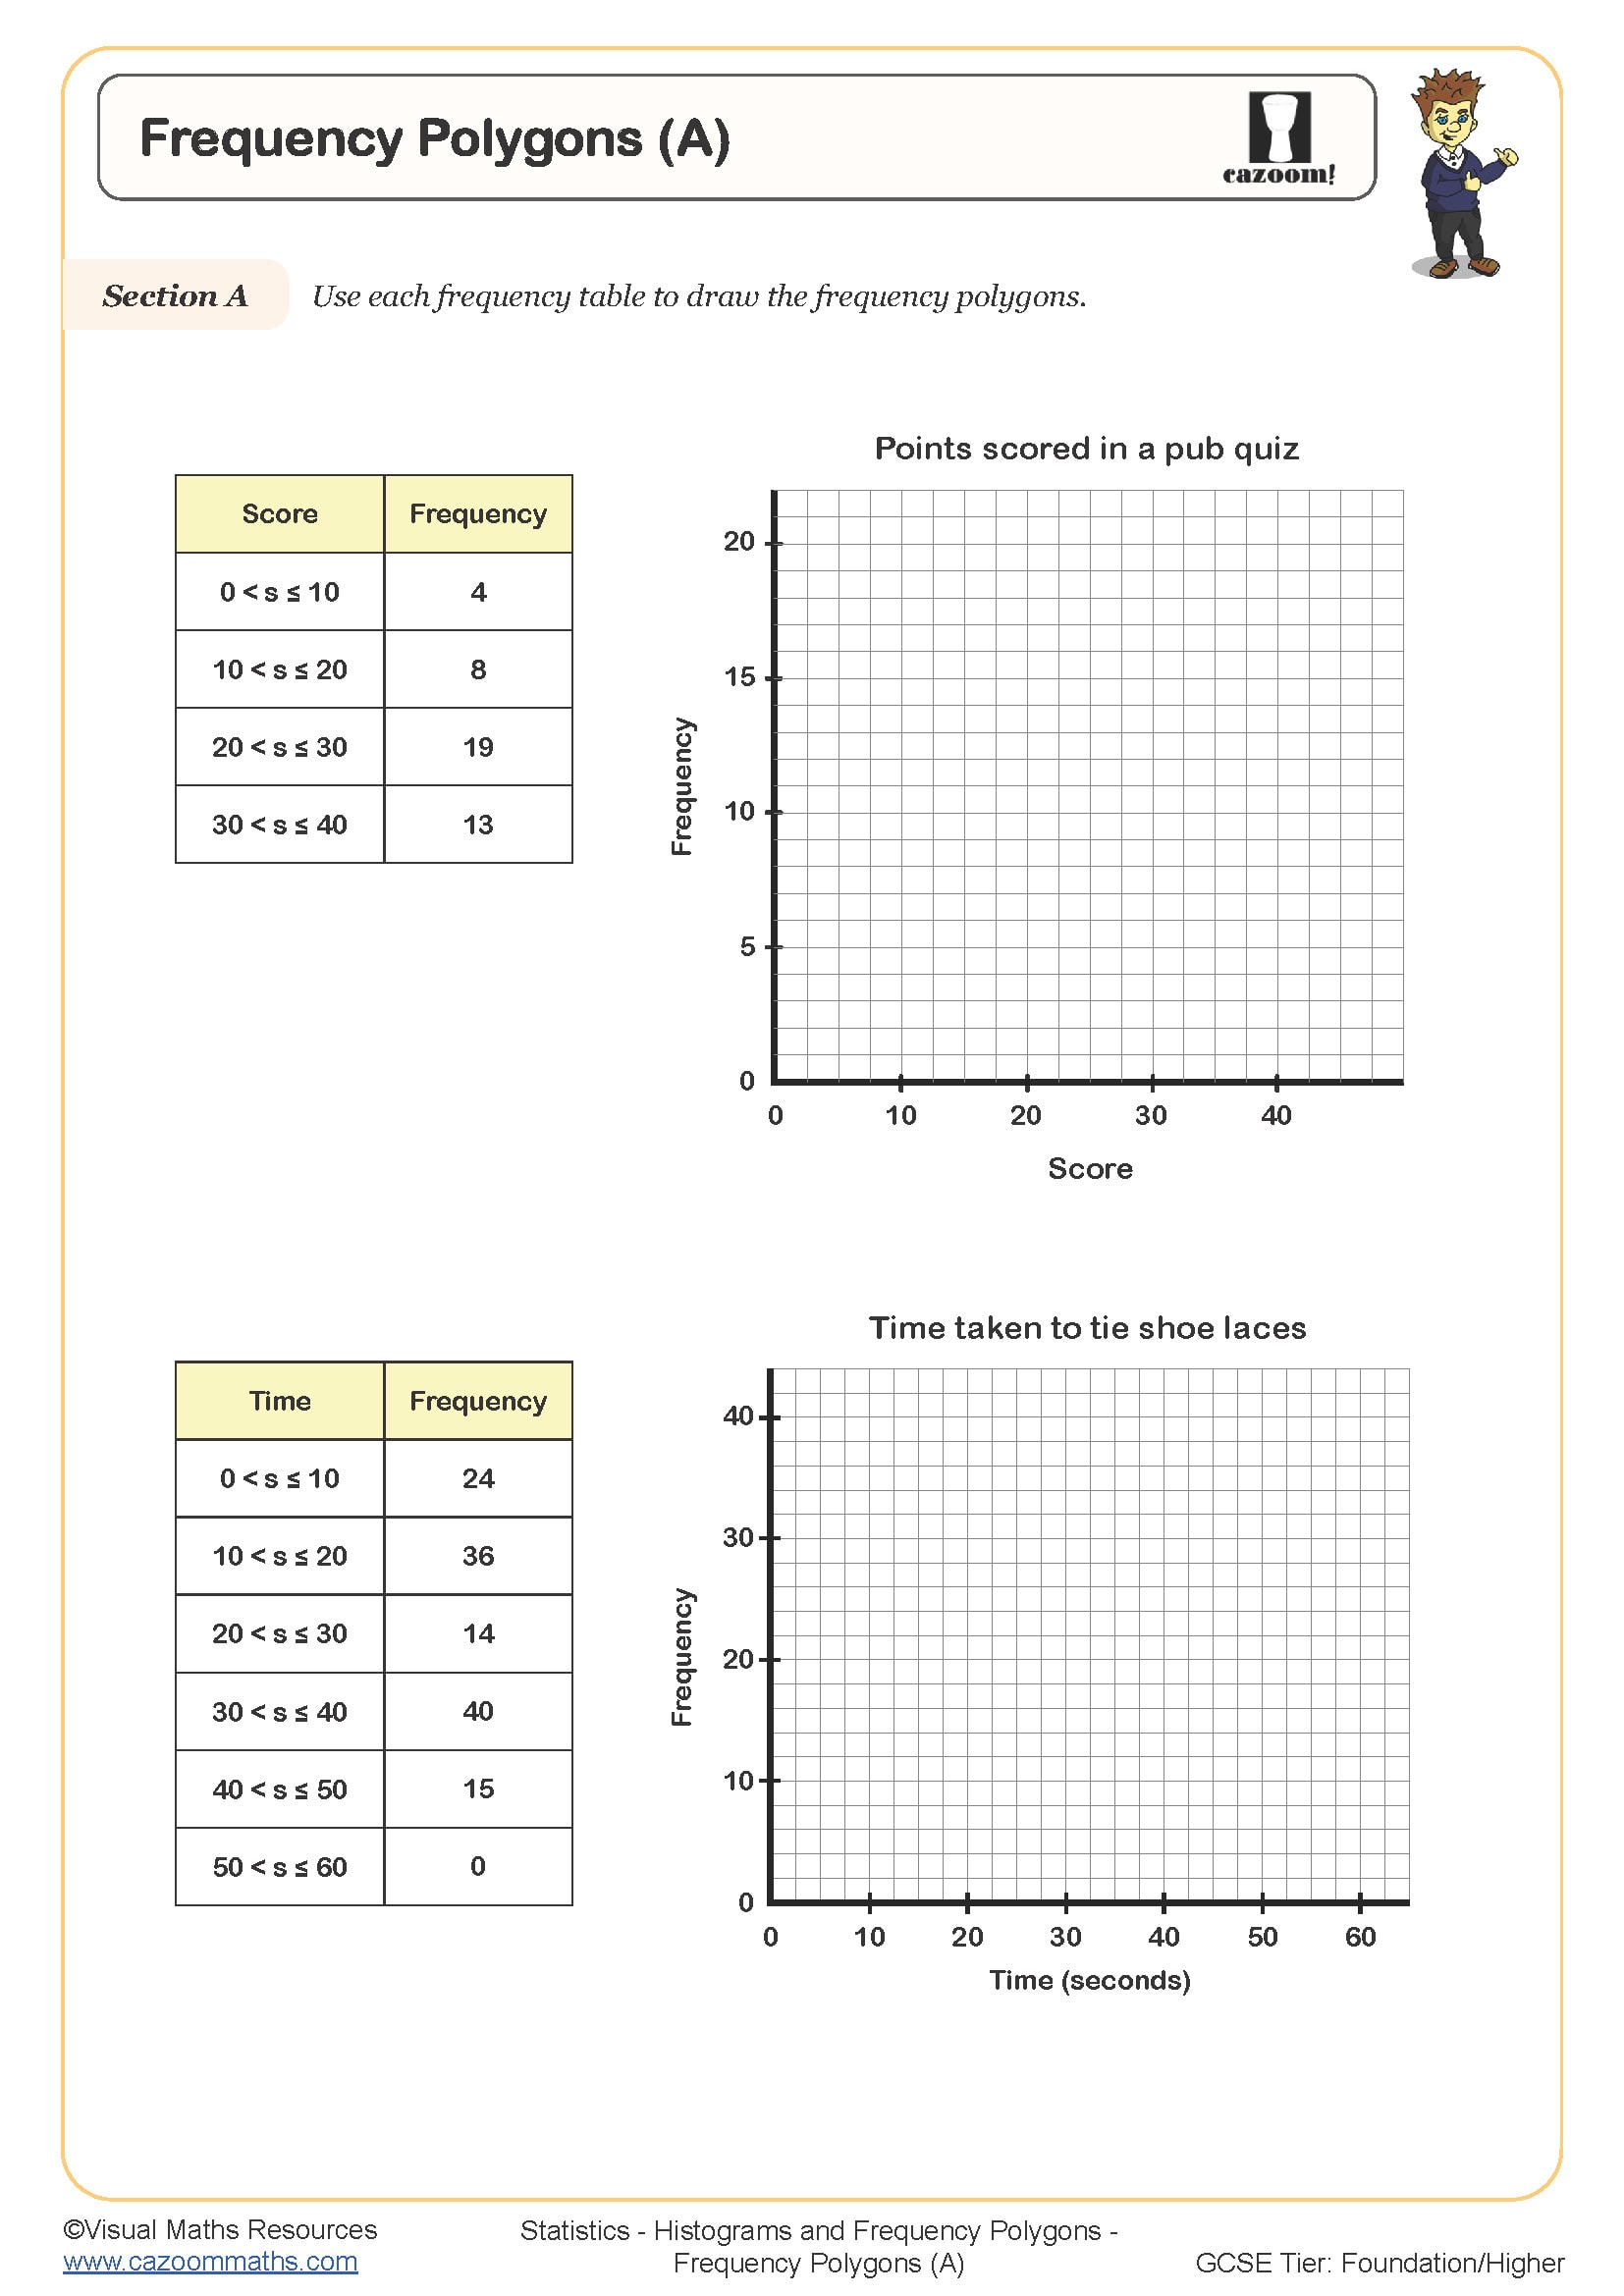
Frequency Polygons (A)
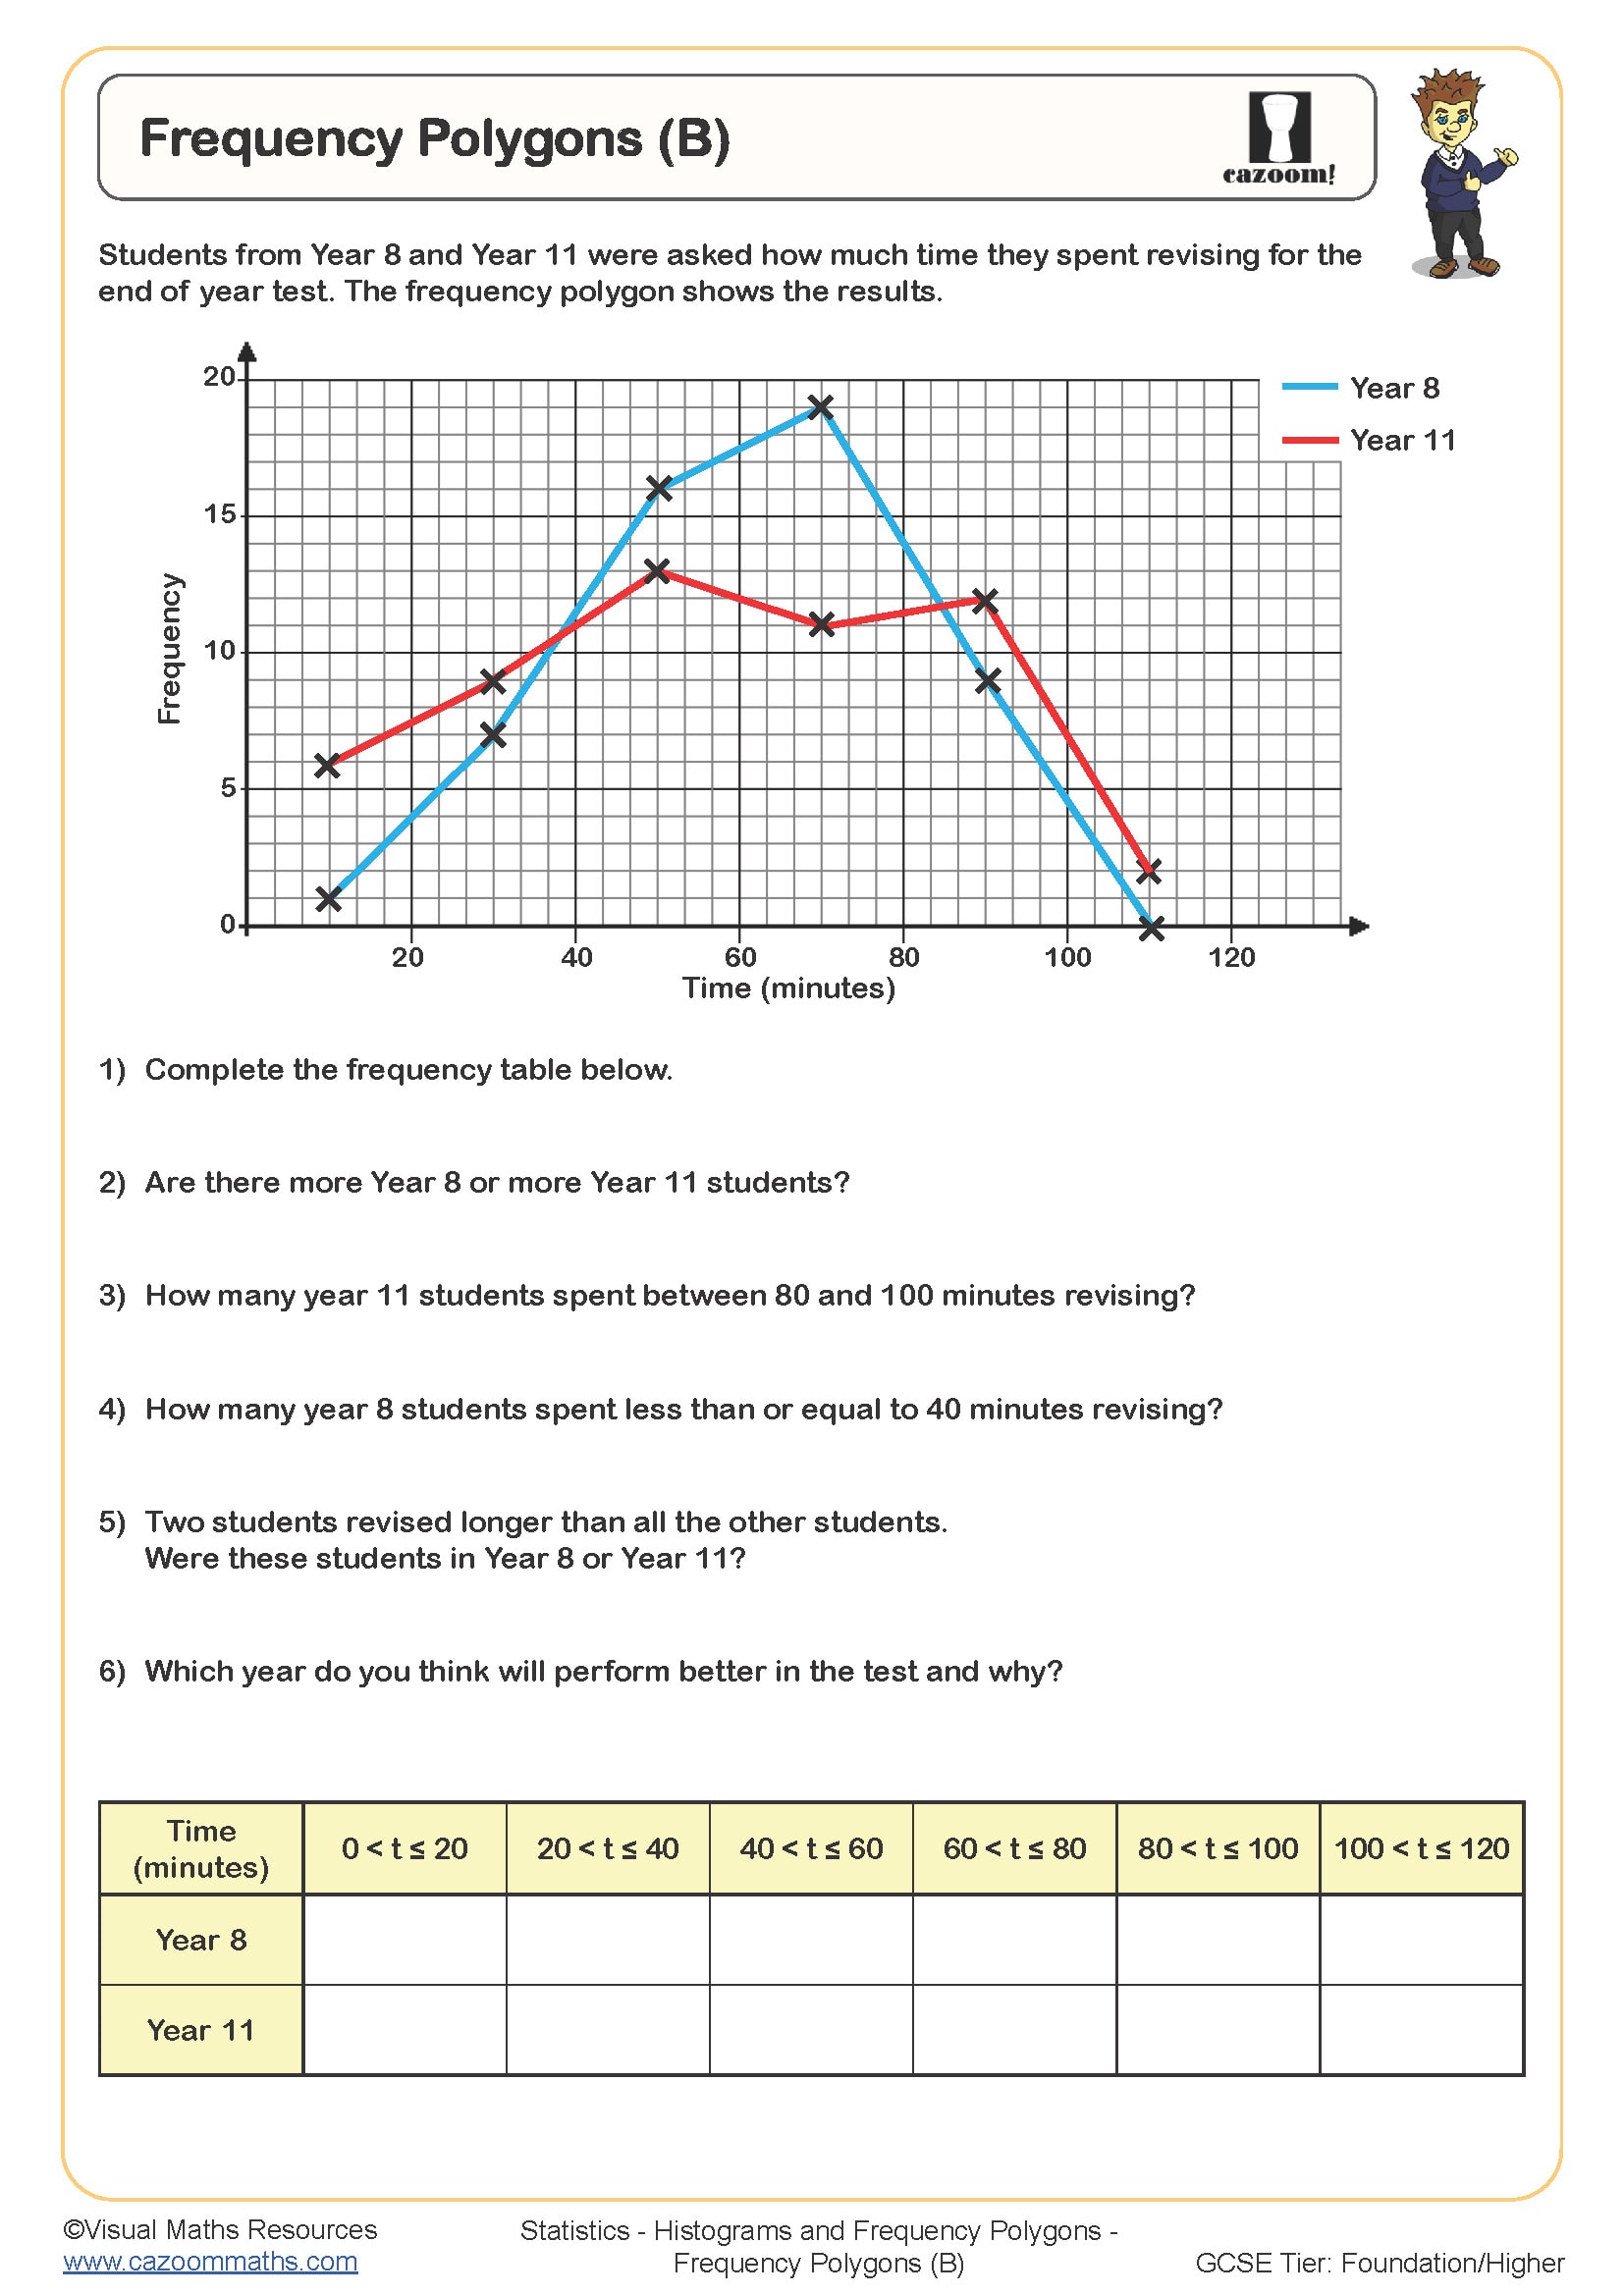
Frequency Polygons (B)
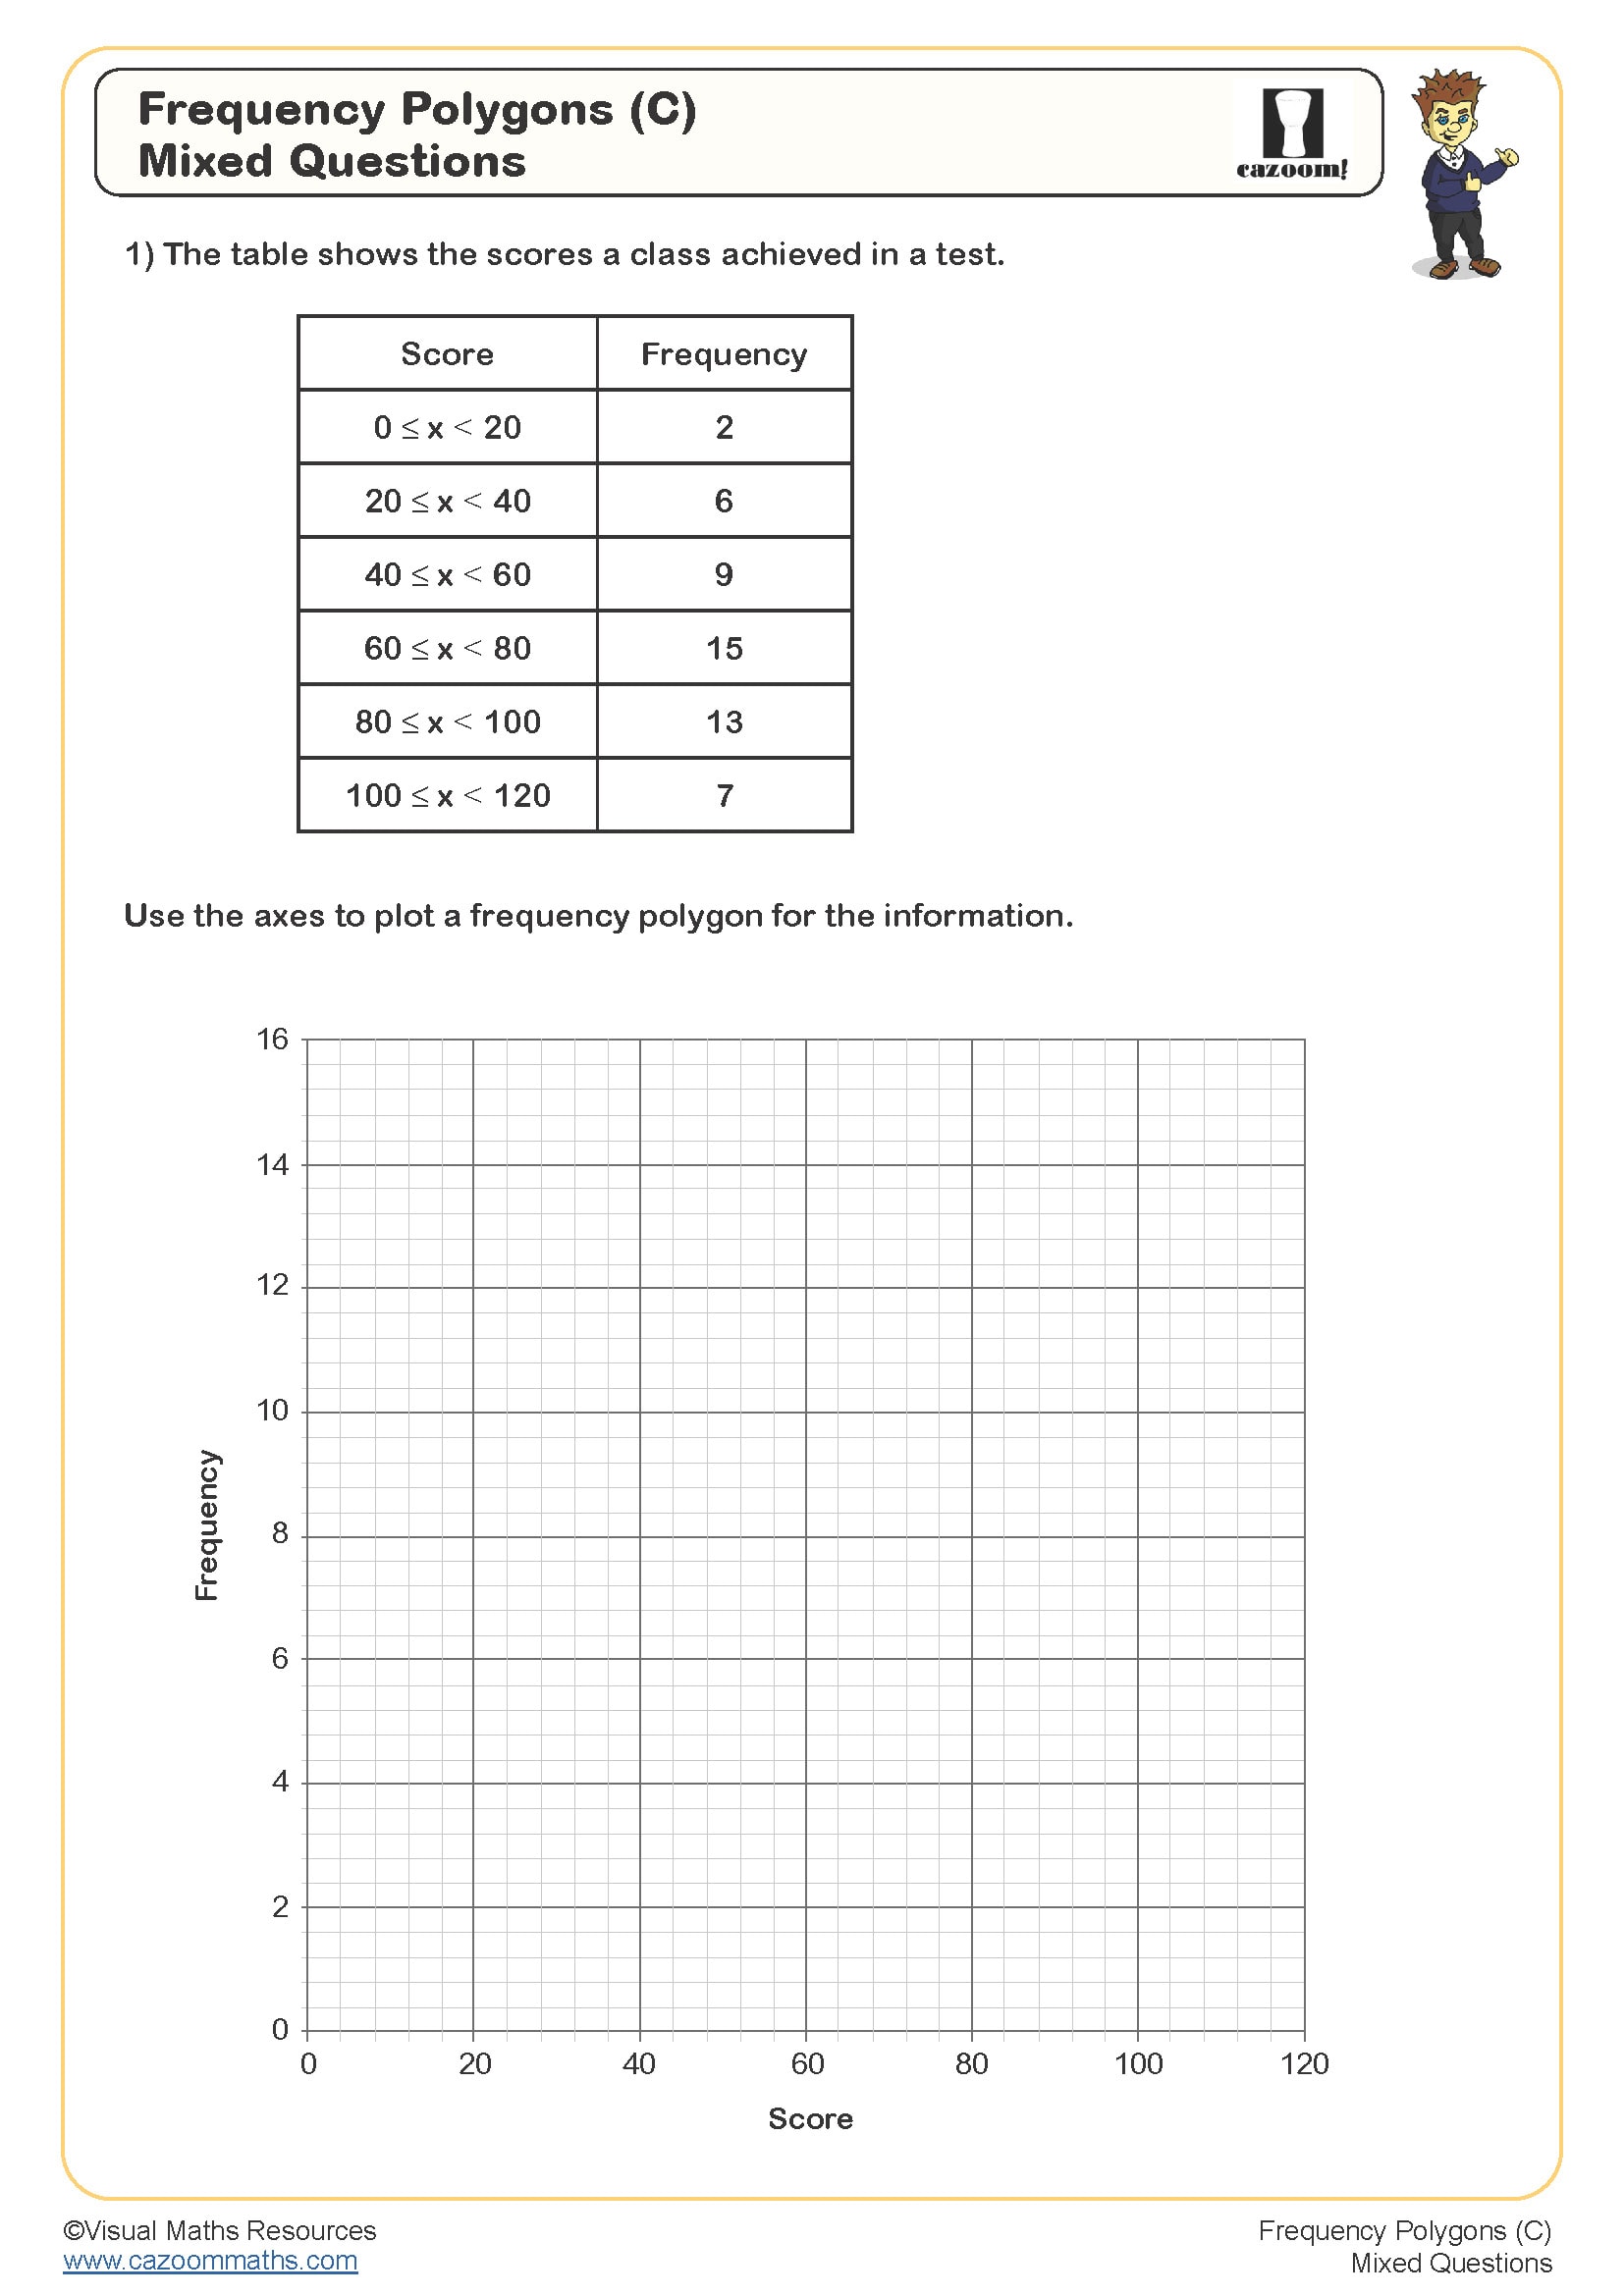
Frequency Polygons (C)
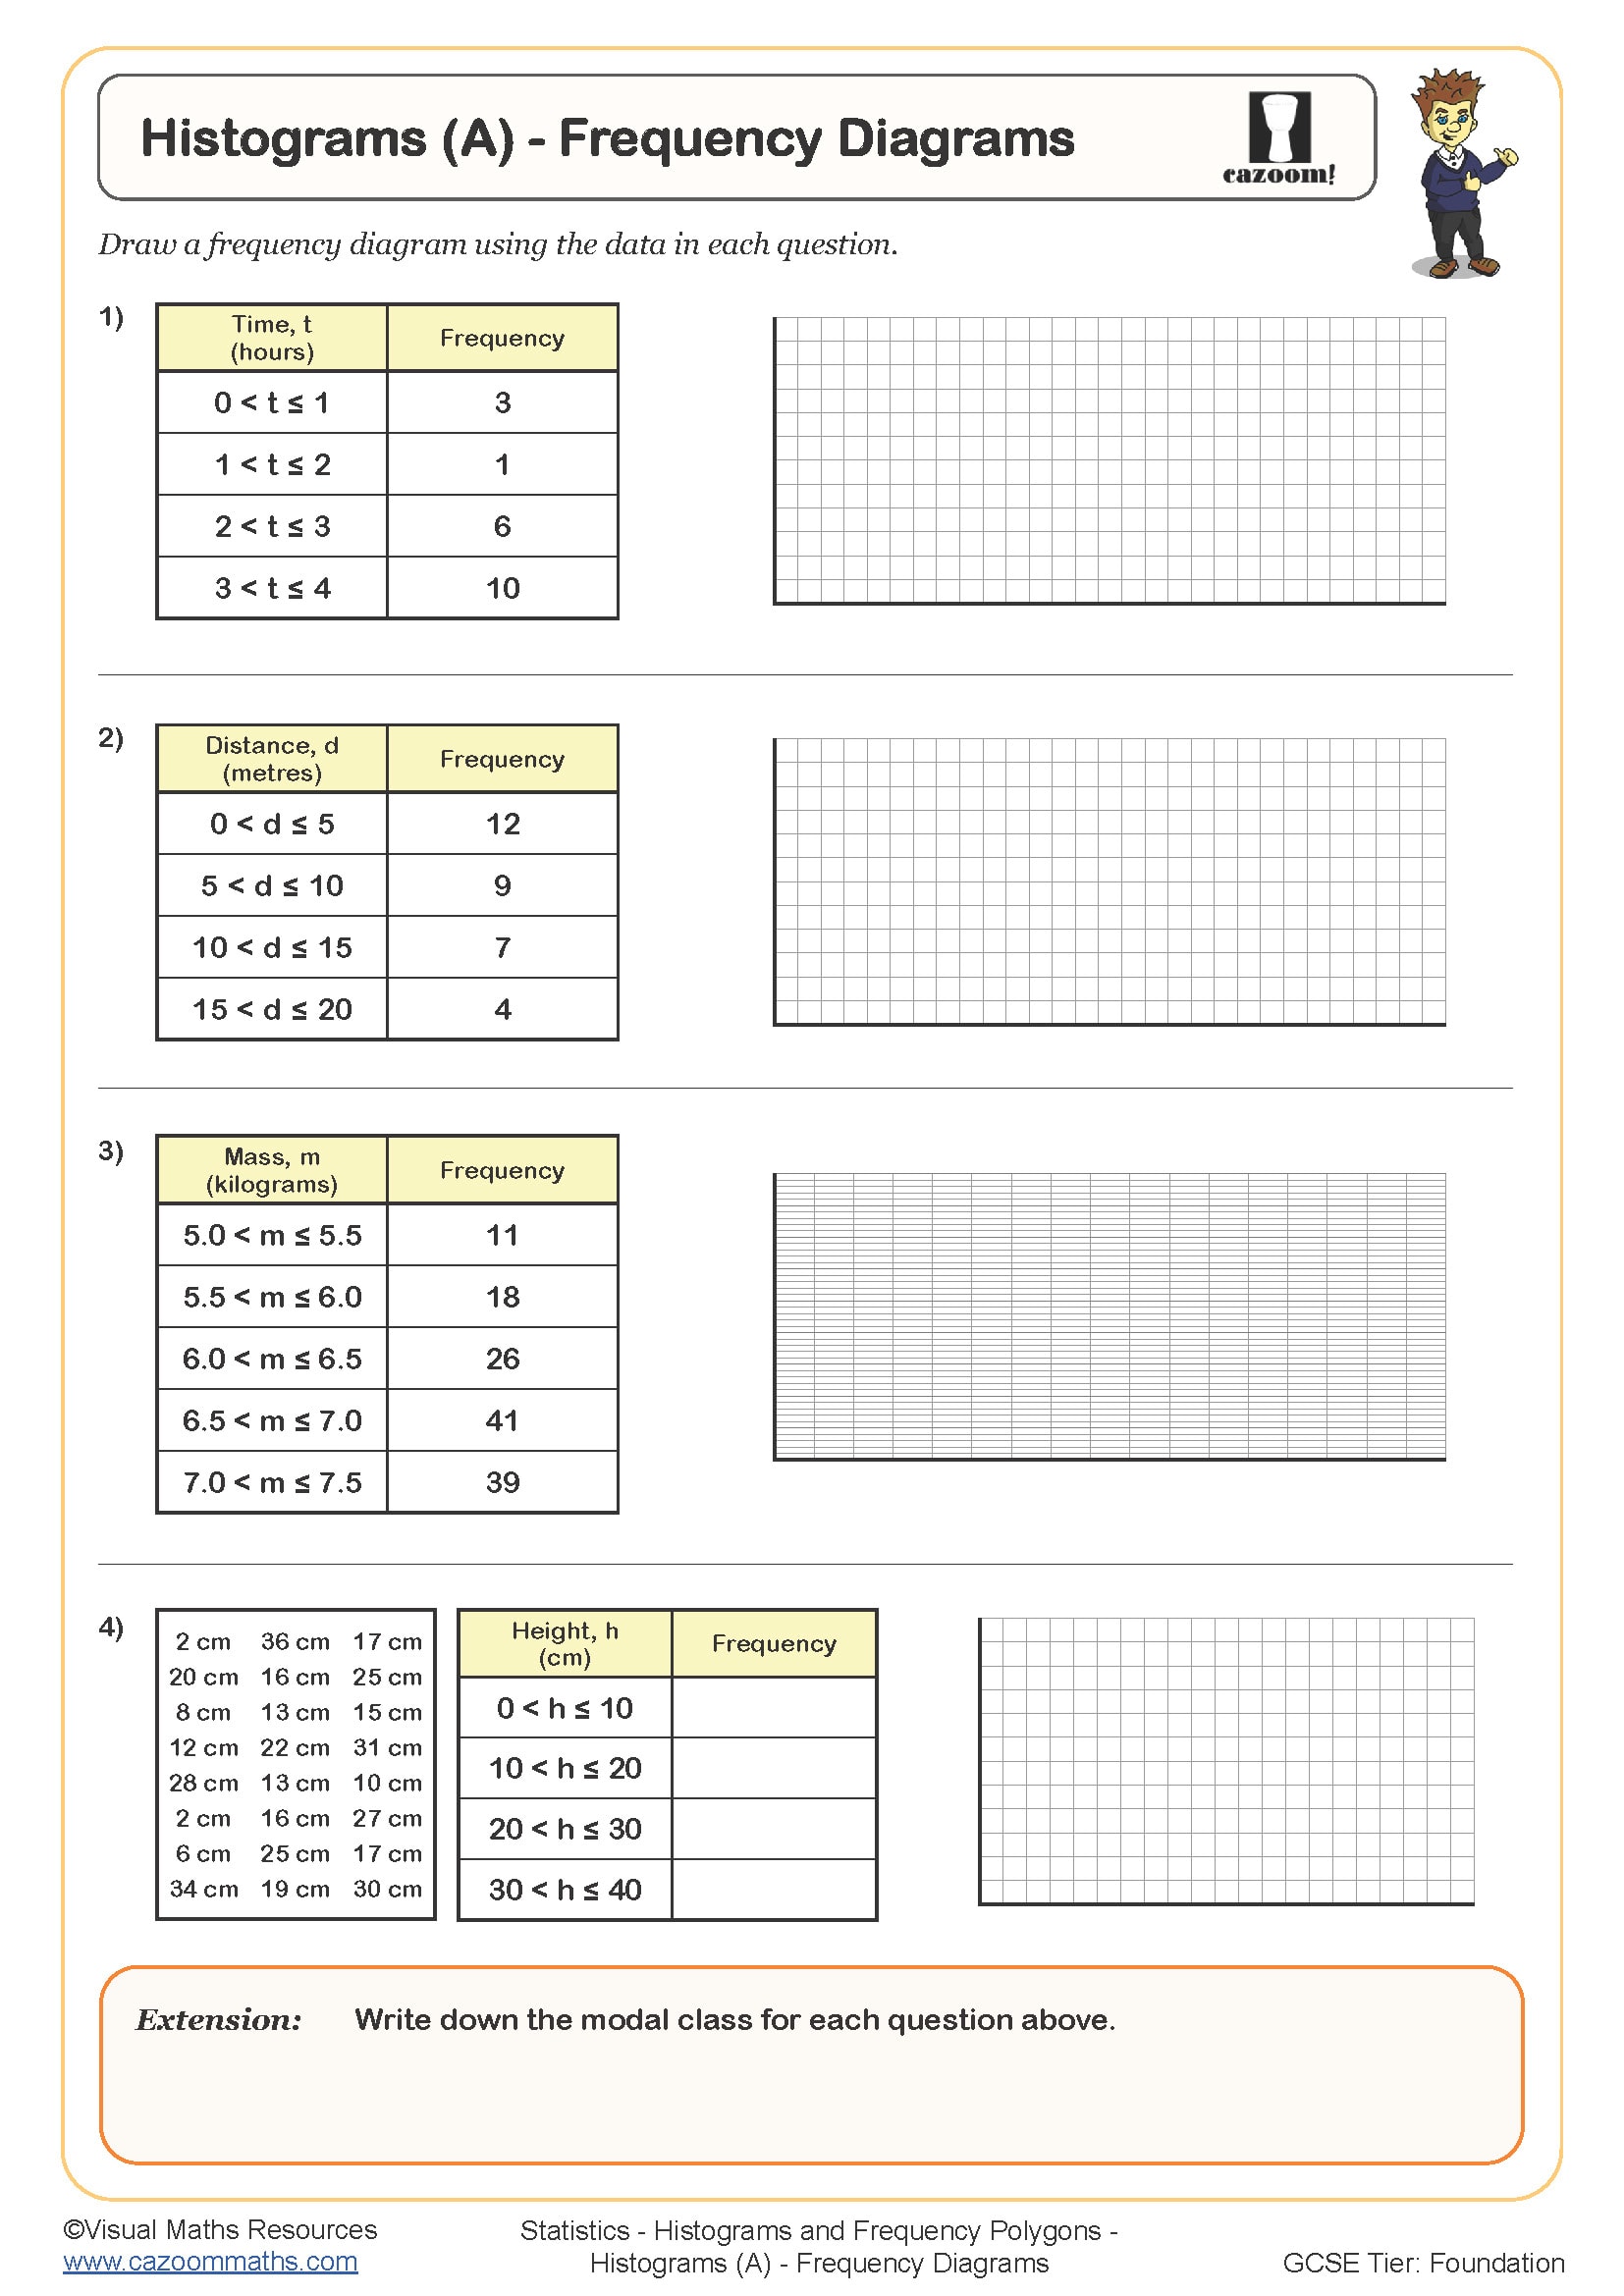
Histograms (A) - Frequency Diagrams
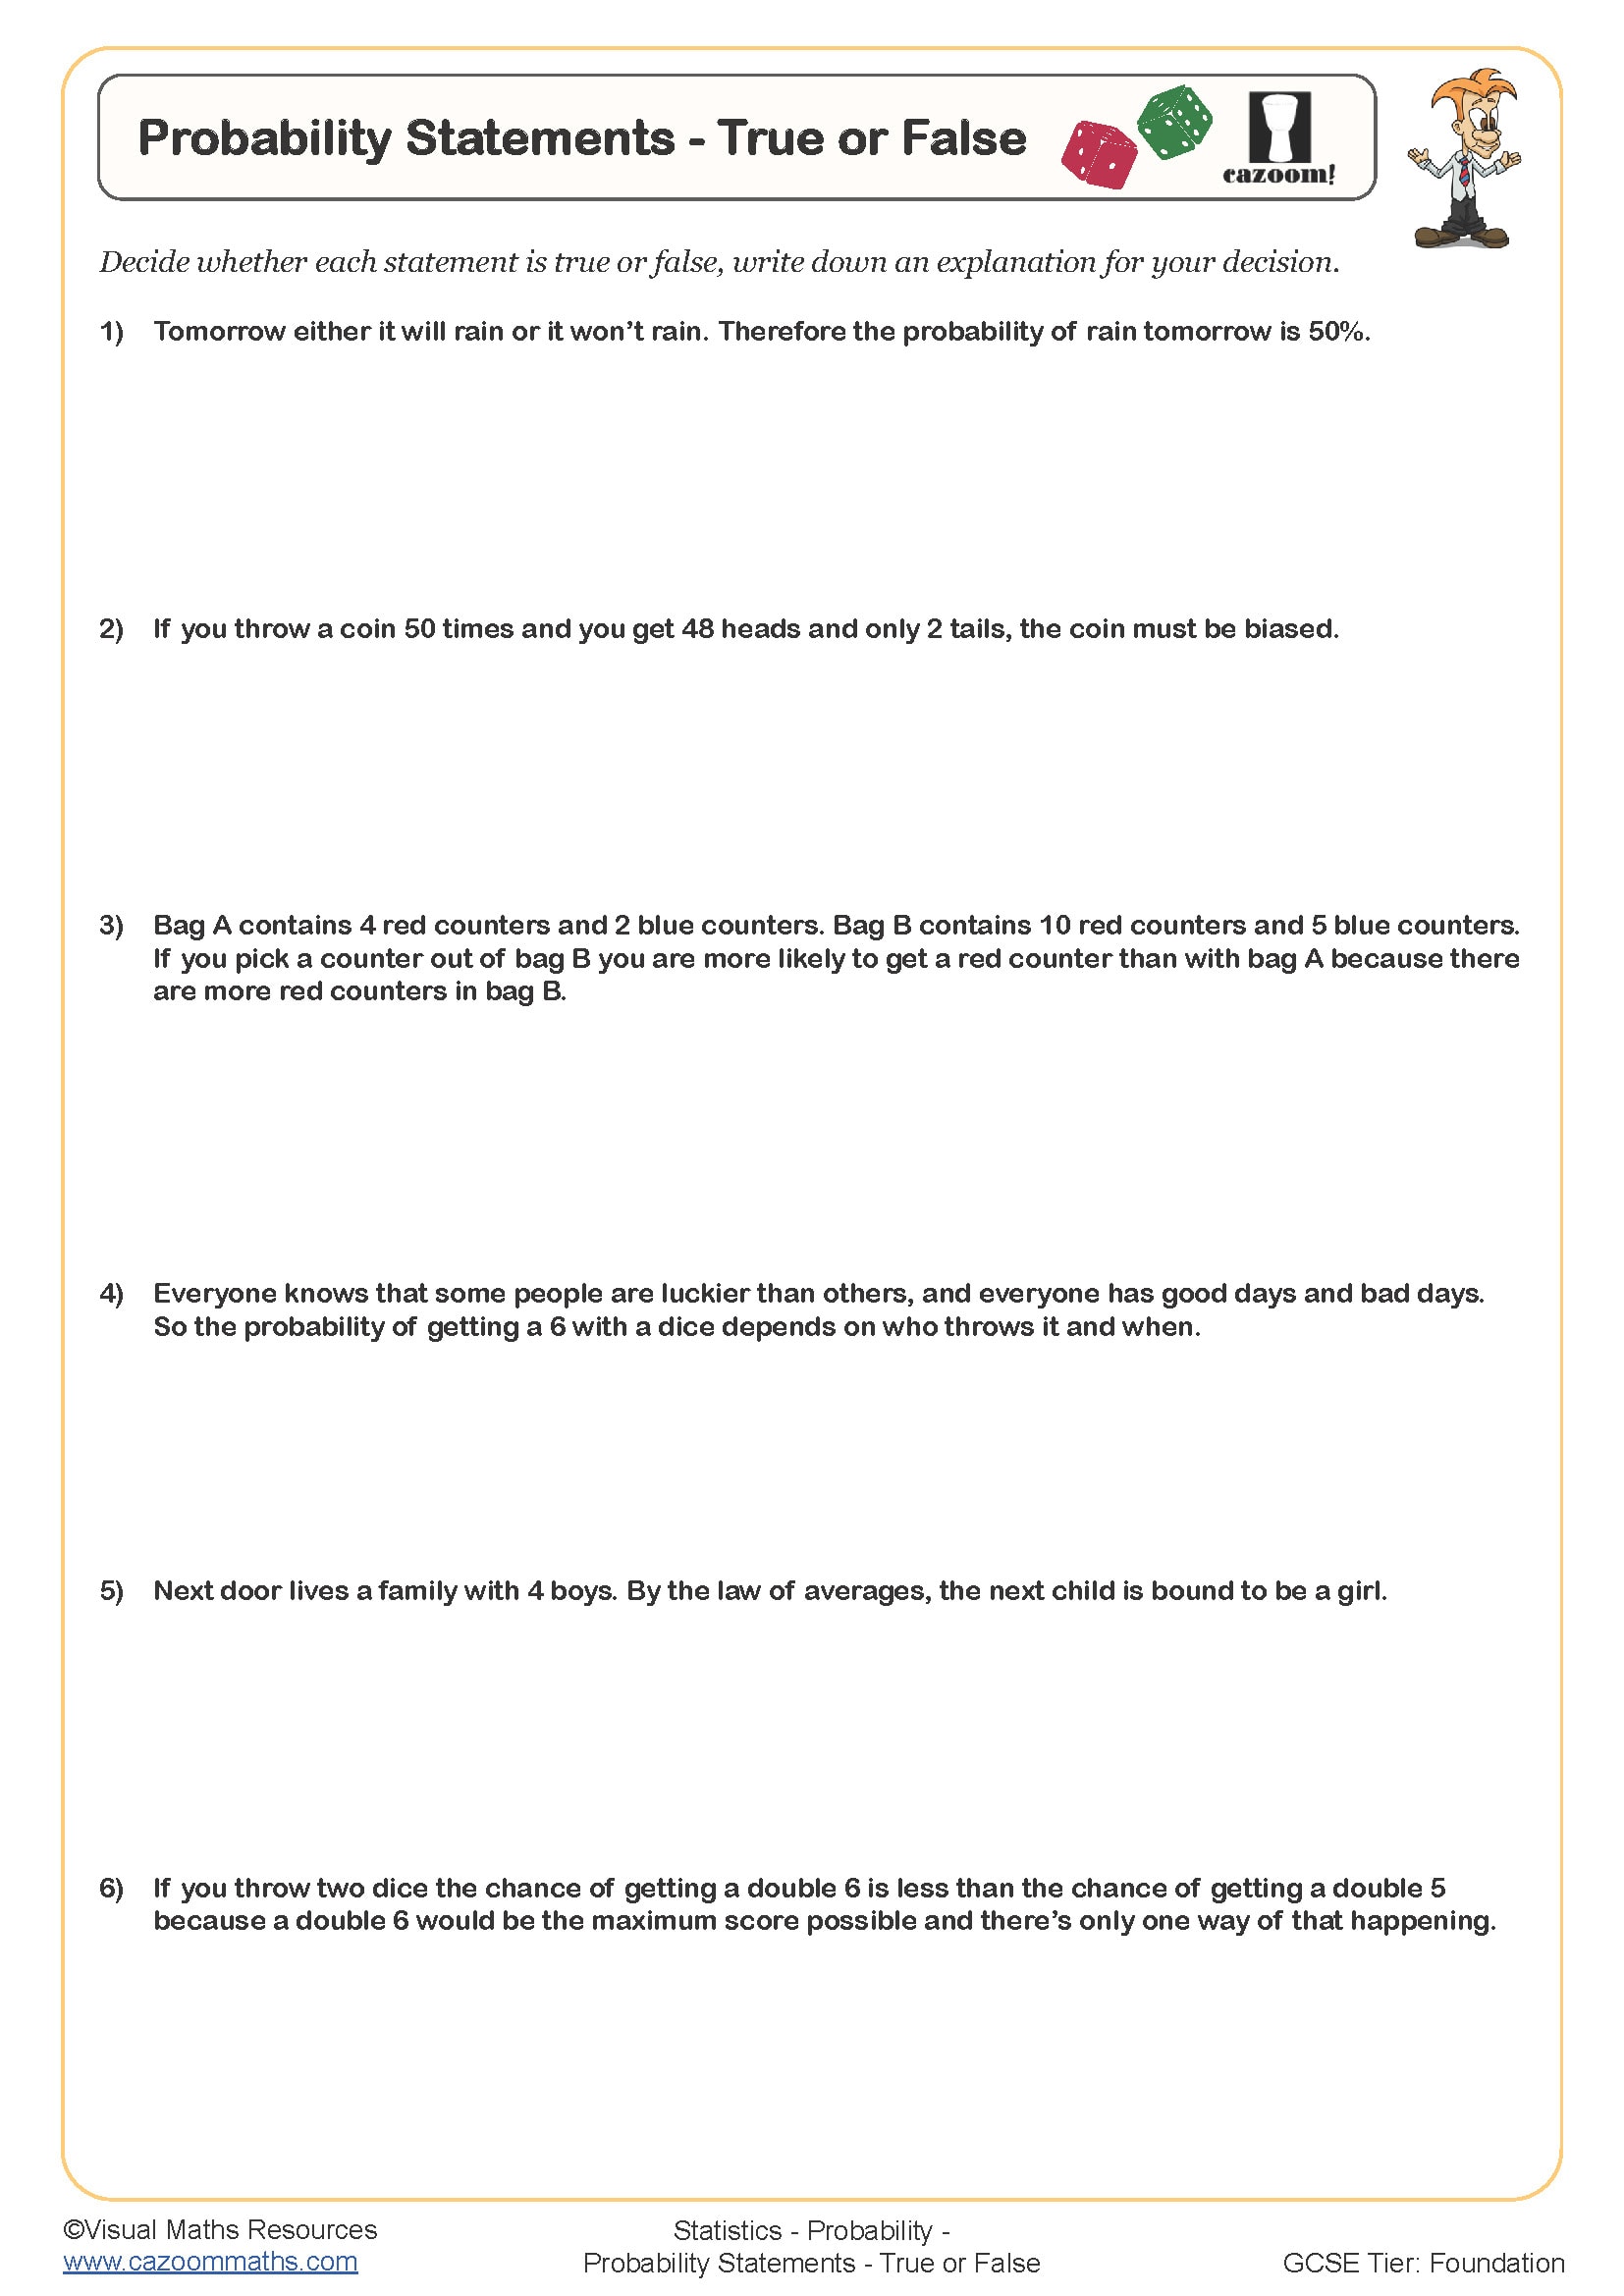
Probability Statements - True or False
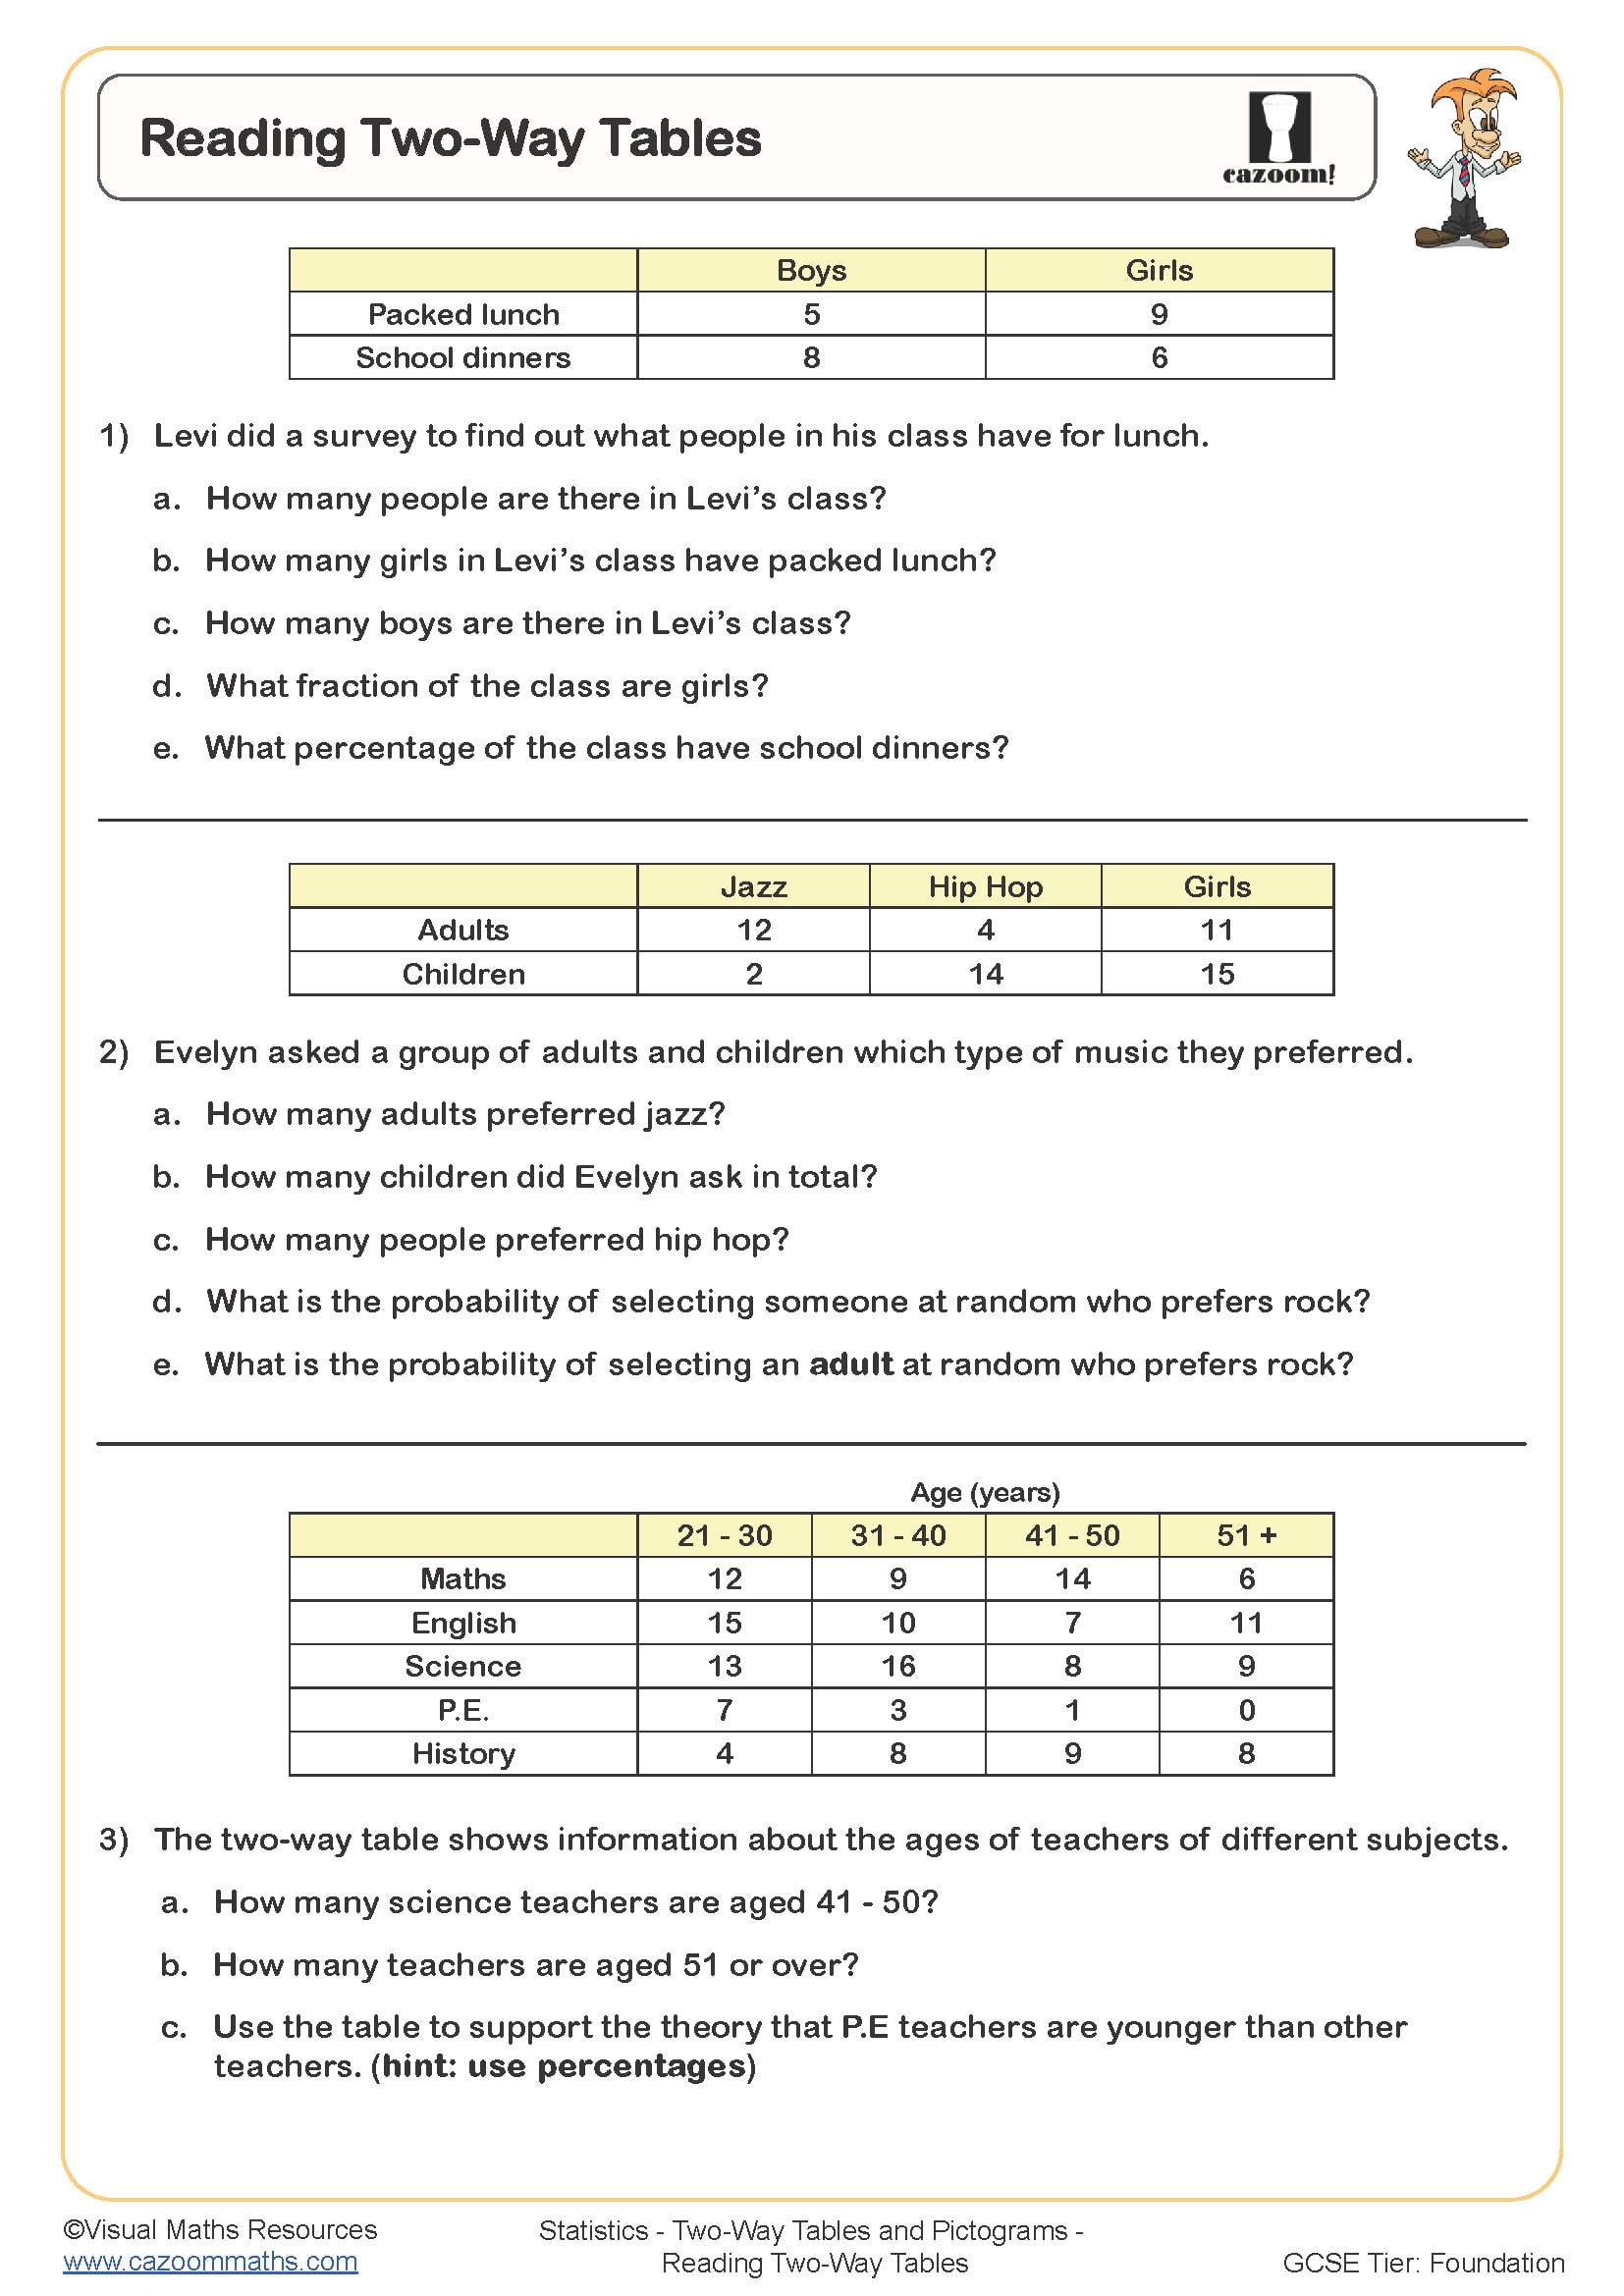
Reading Two-way Tables
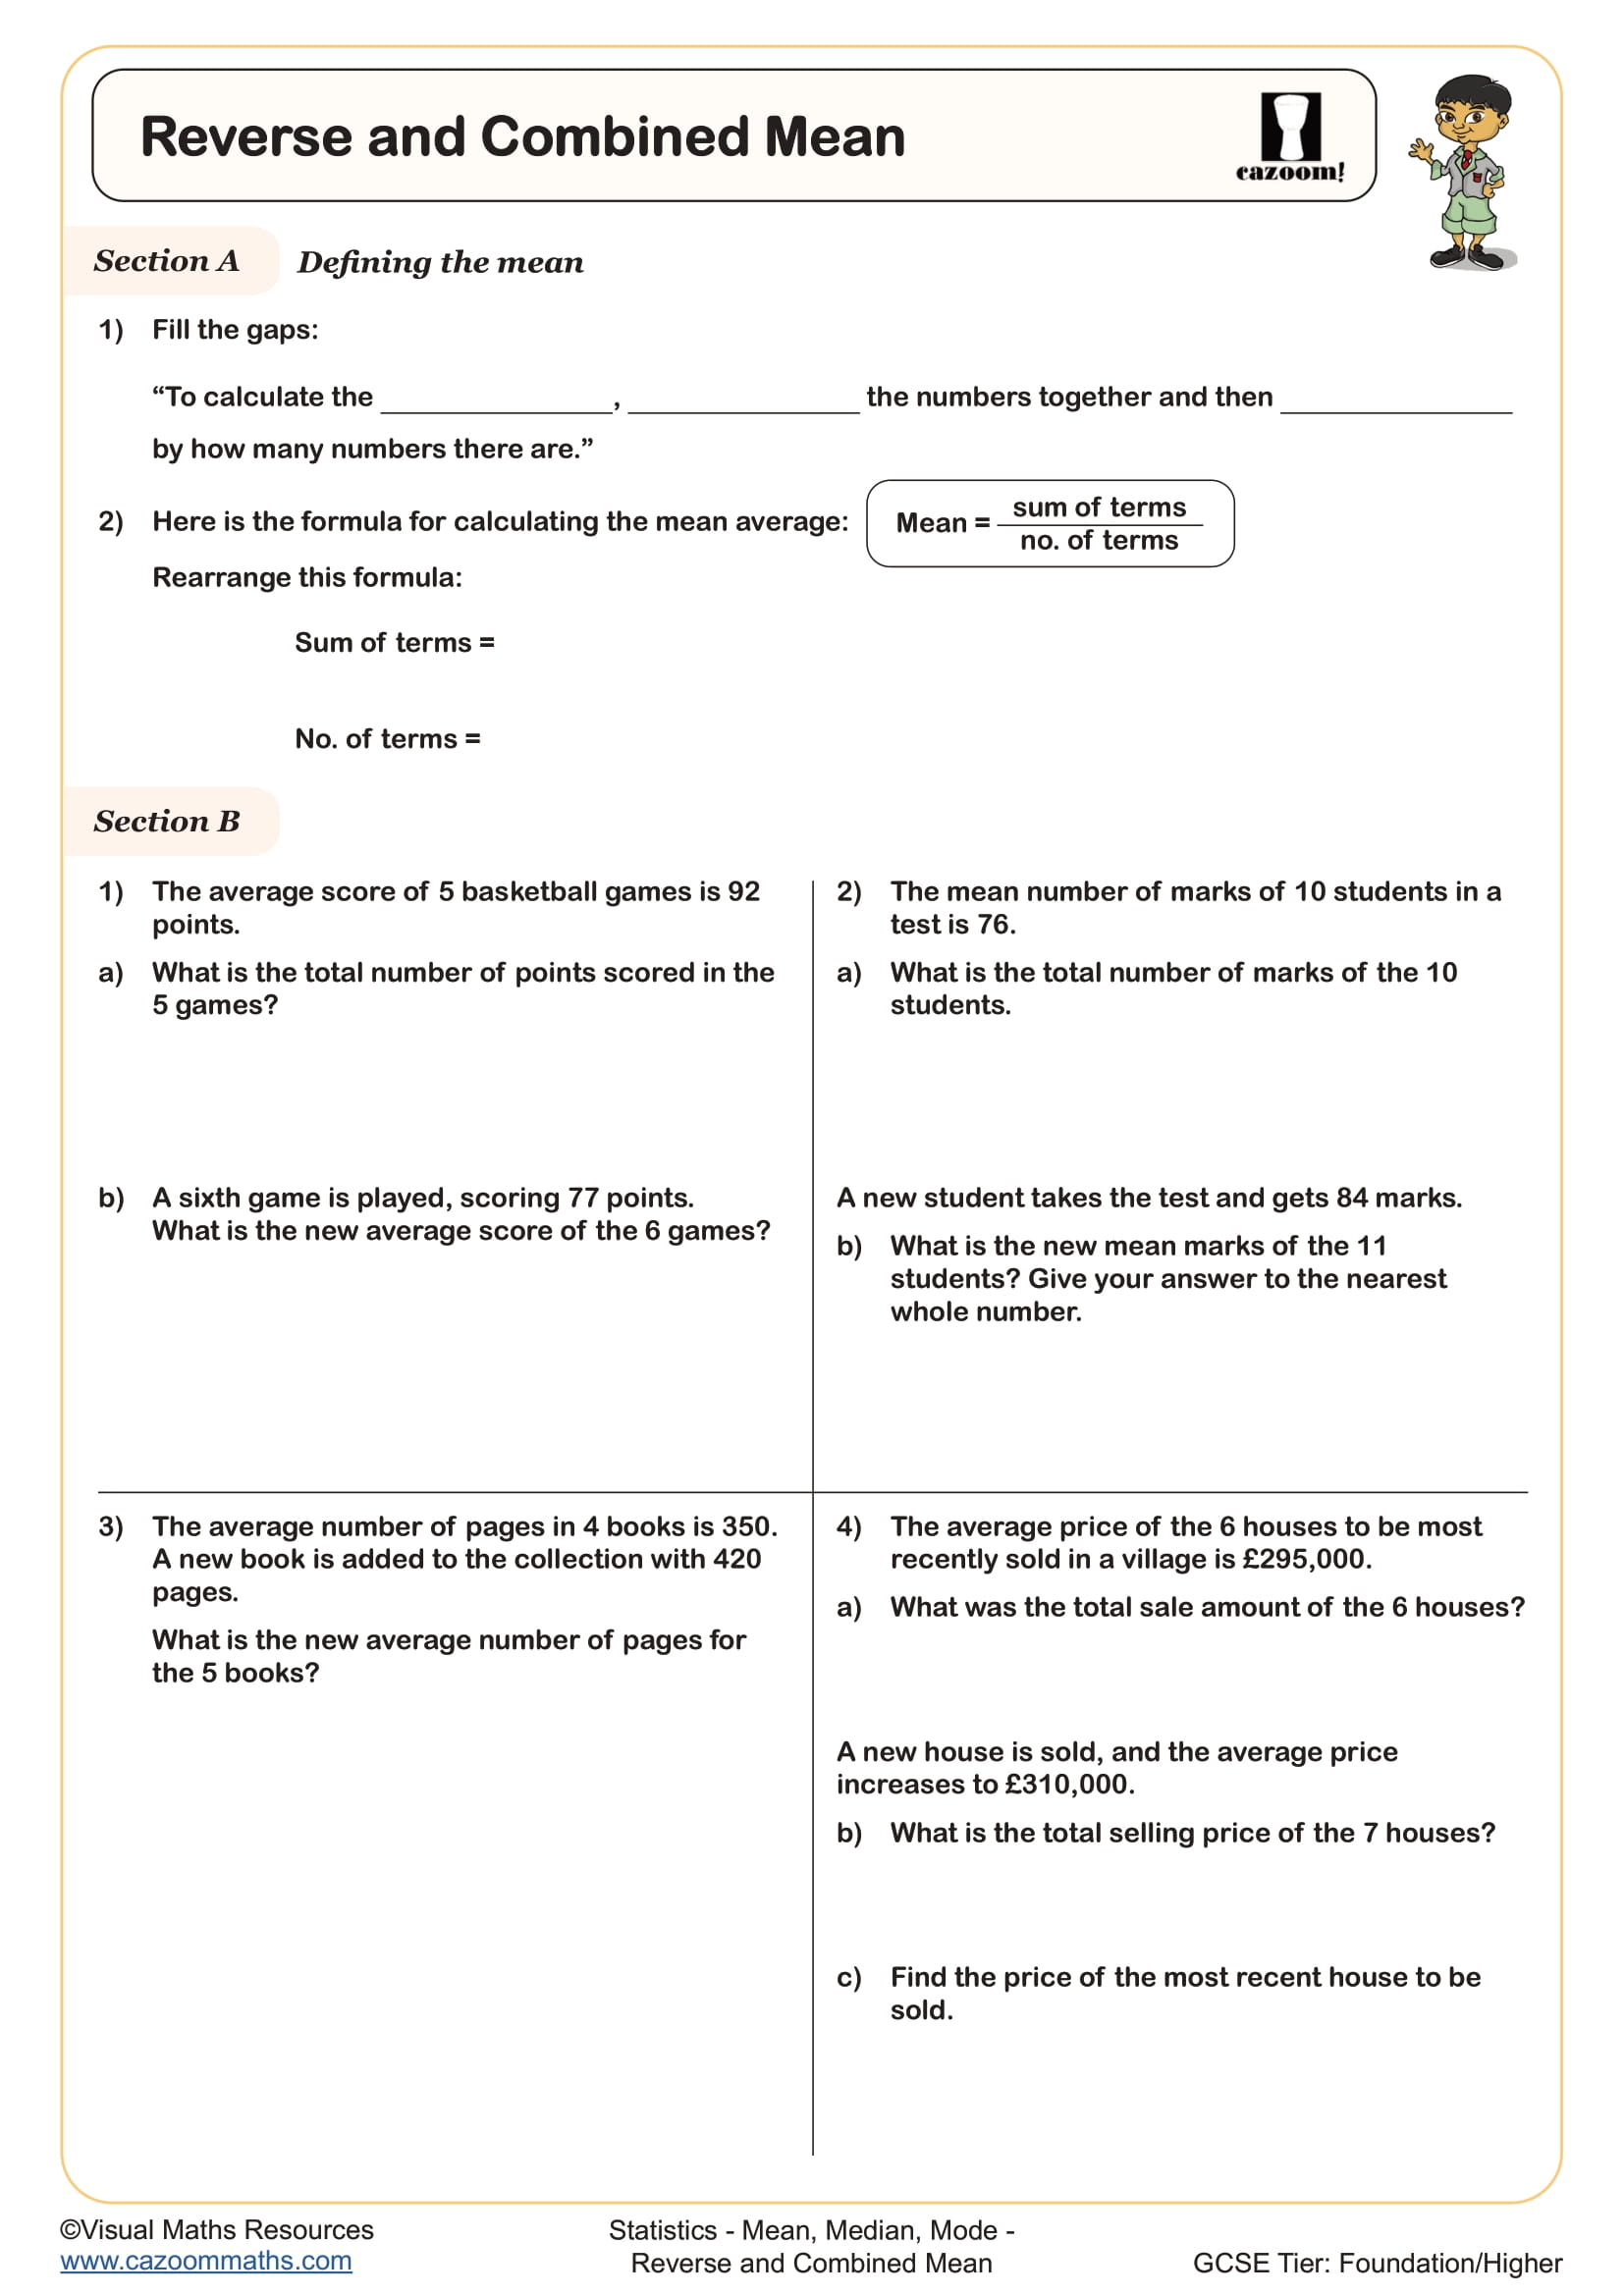
Reverse and Combined Mean
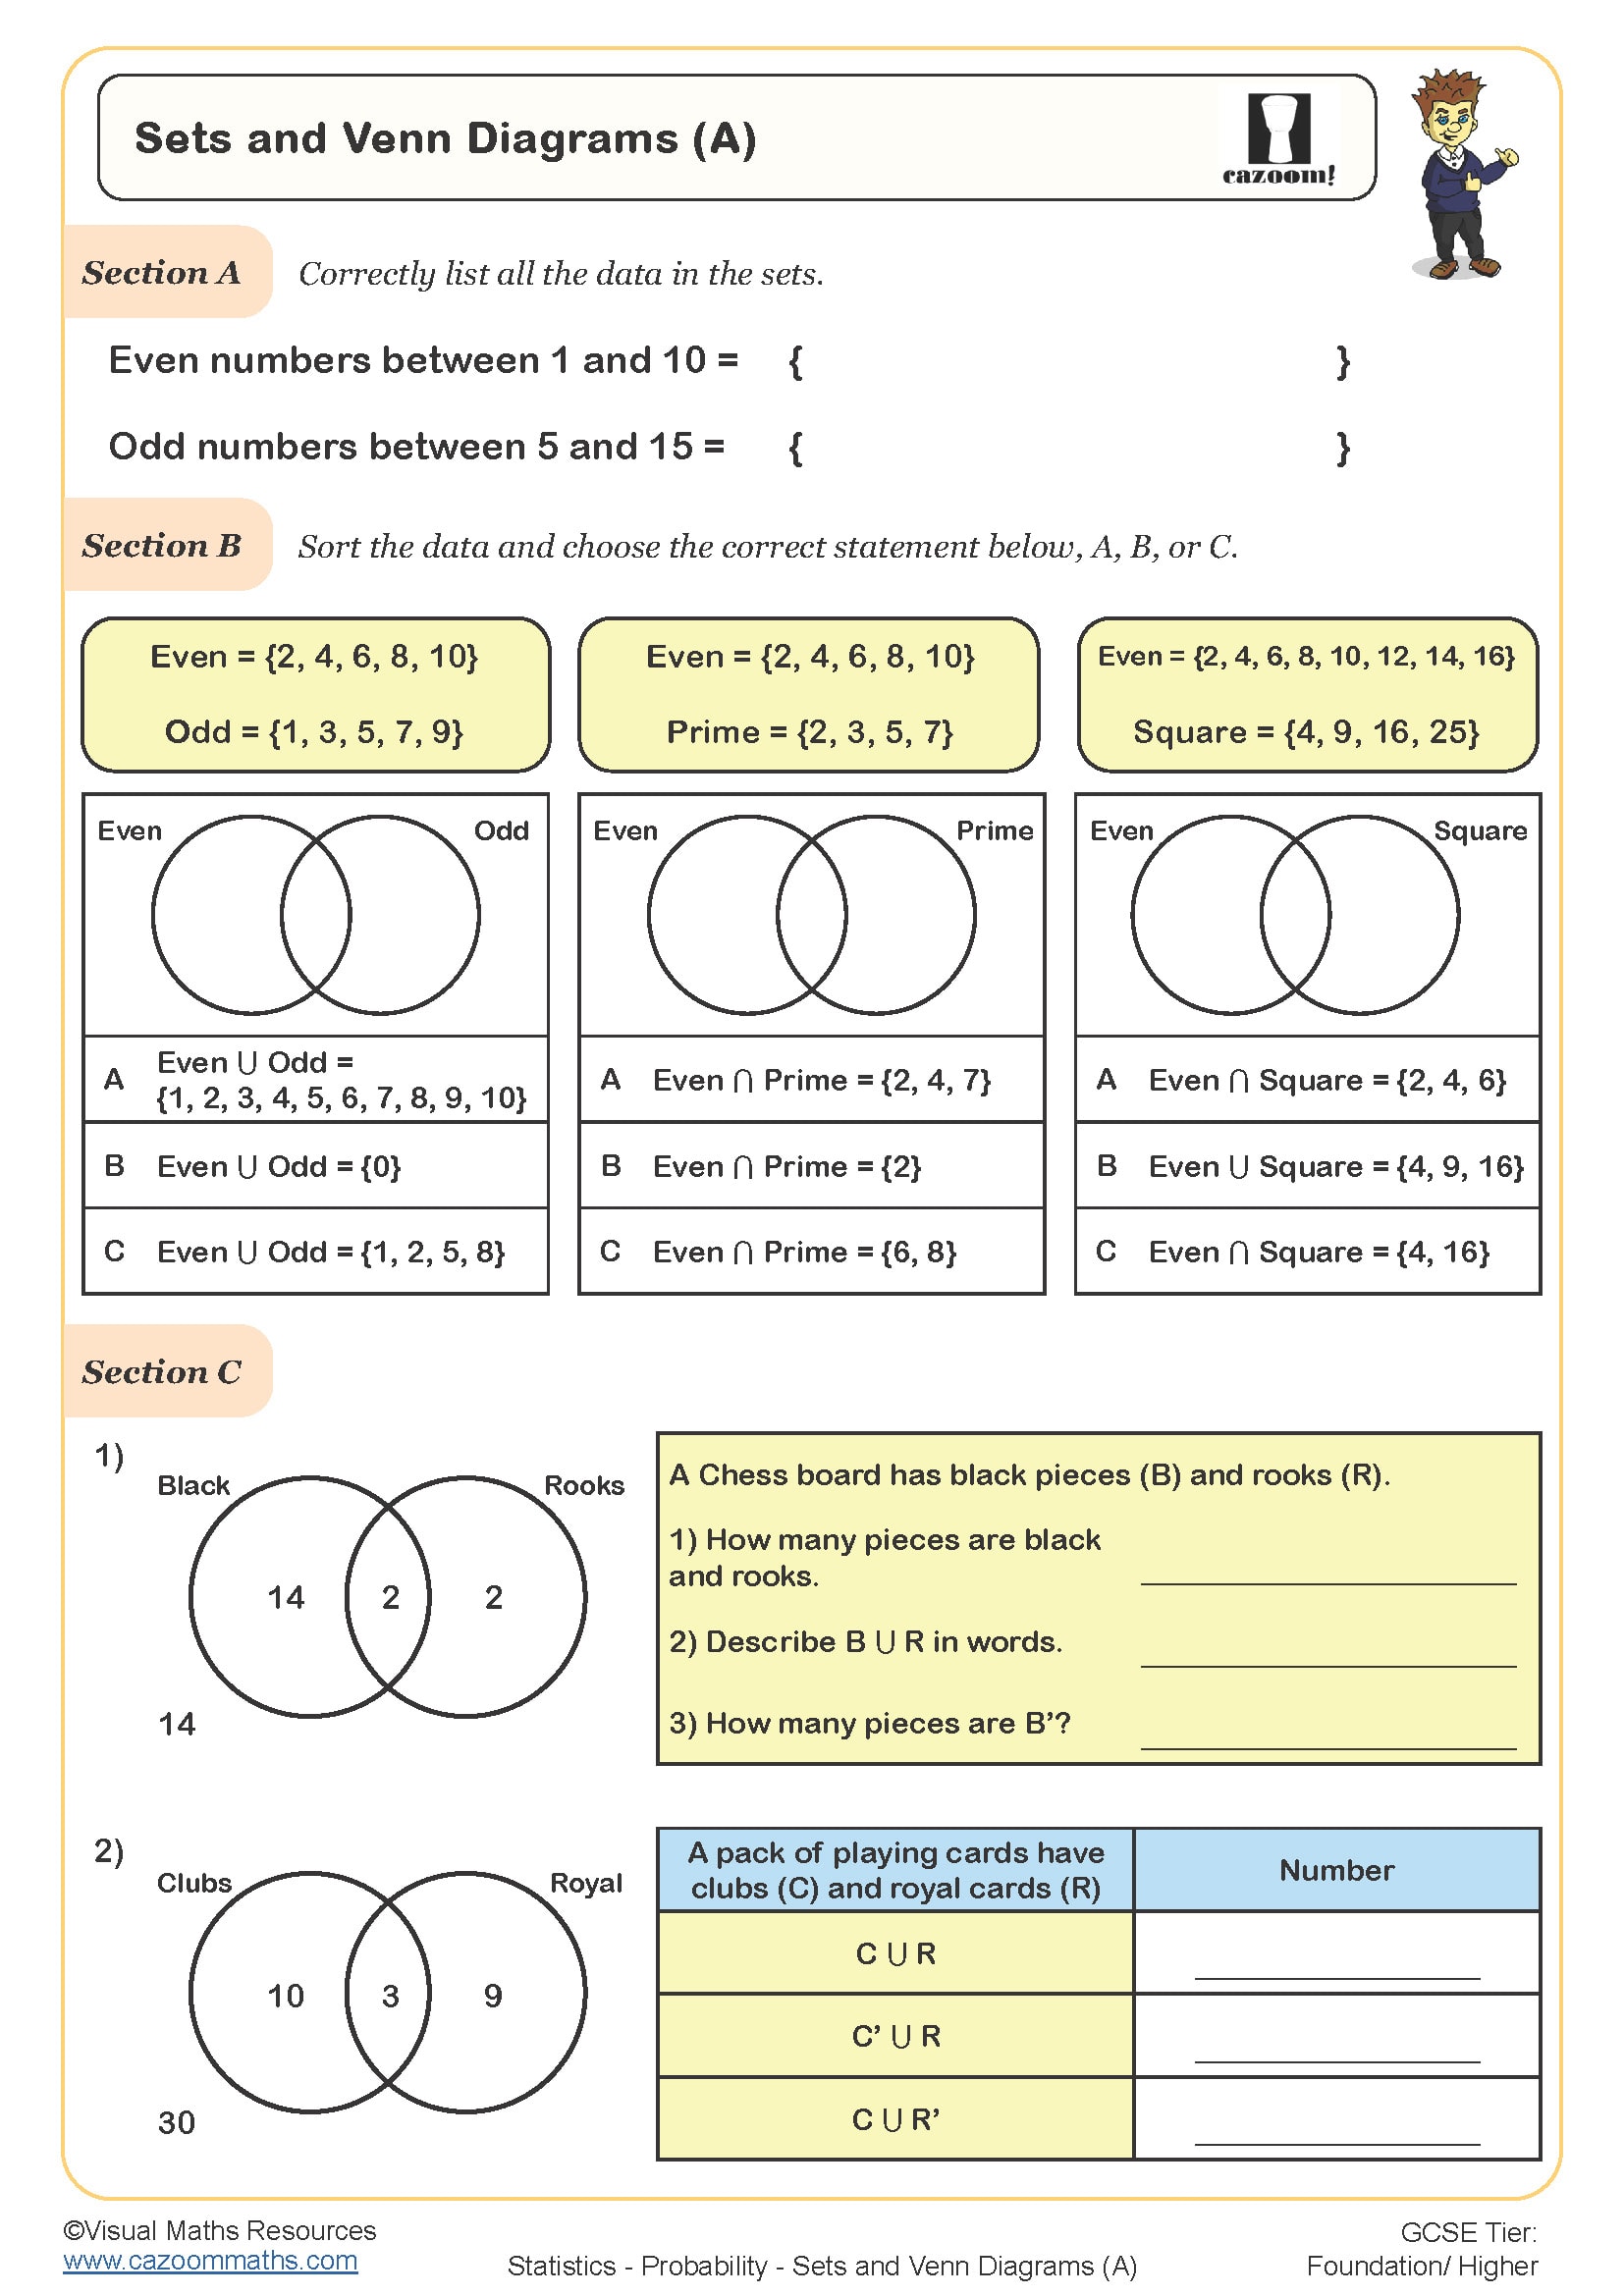
Sets and Venn Diagrams (A)
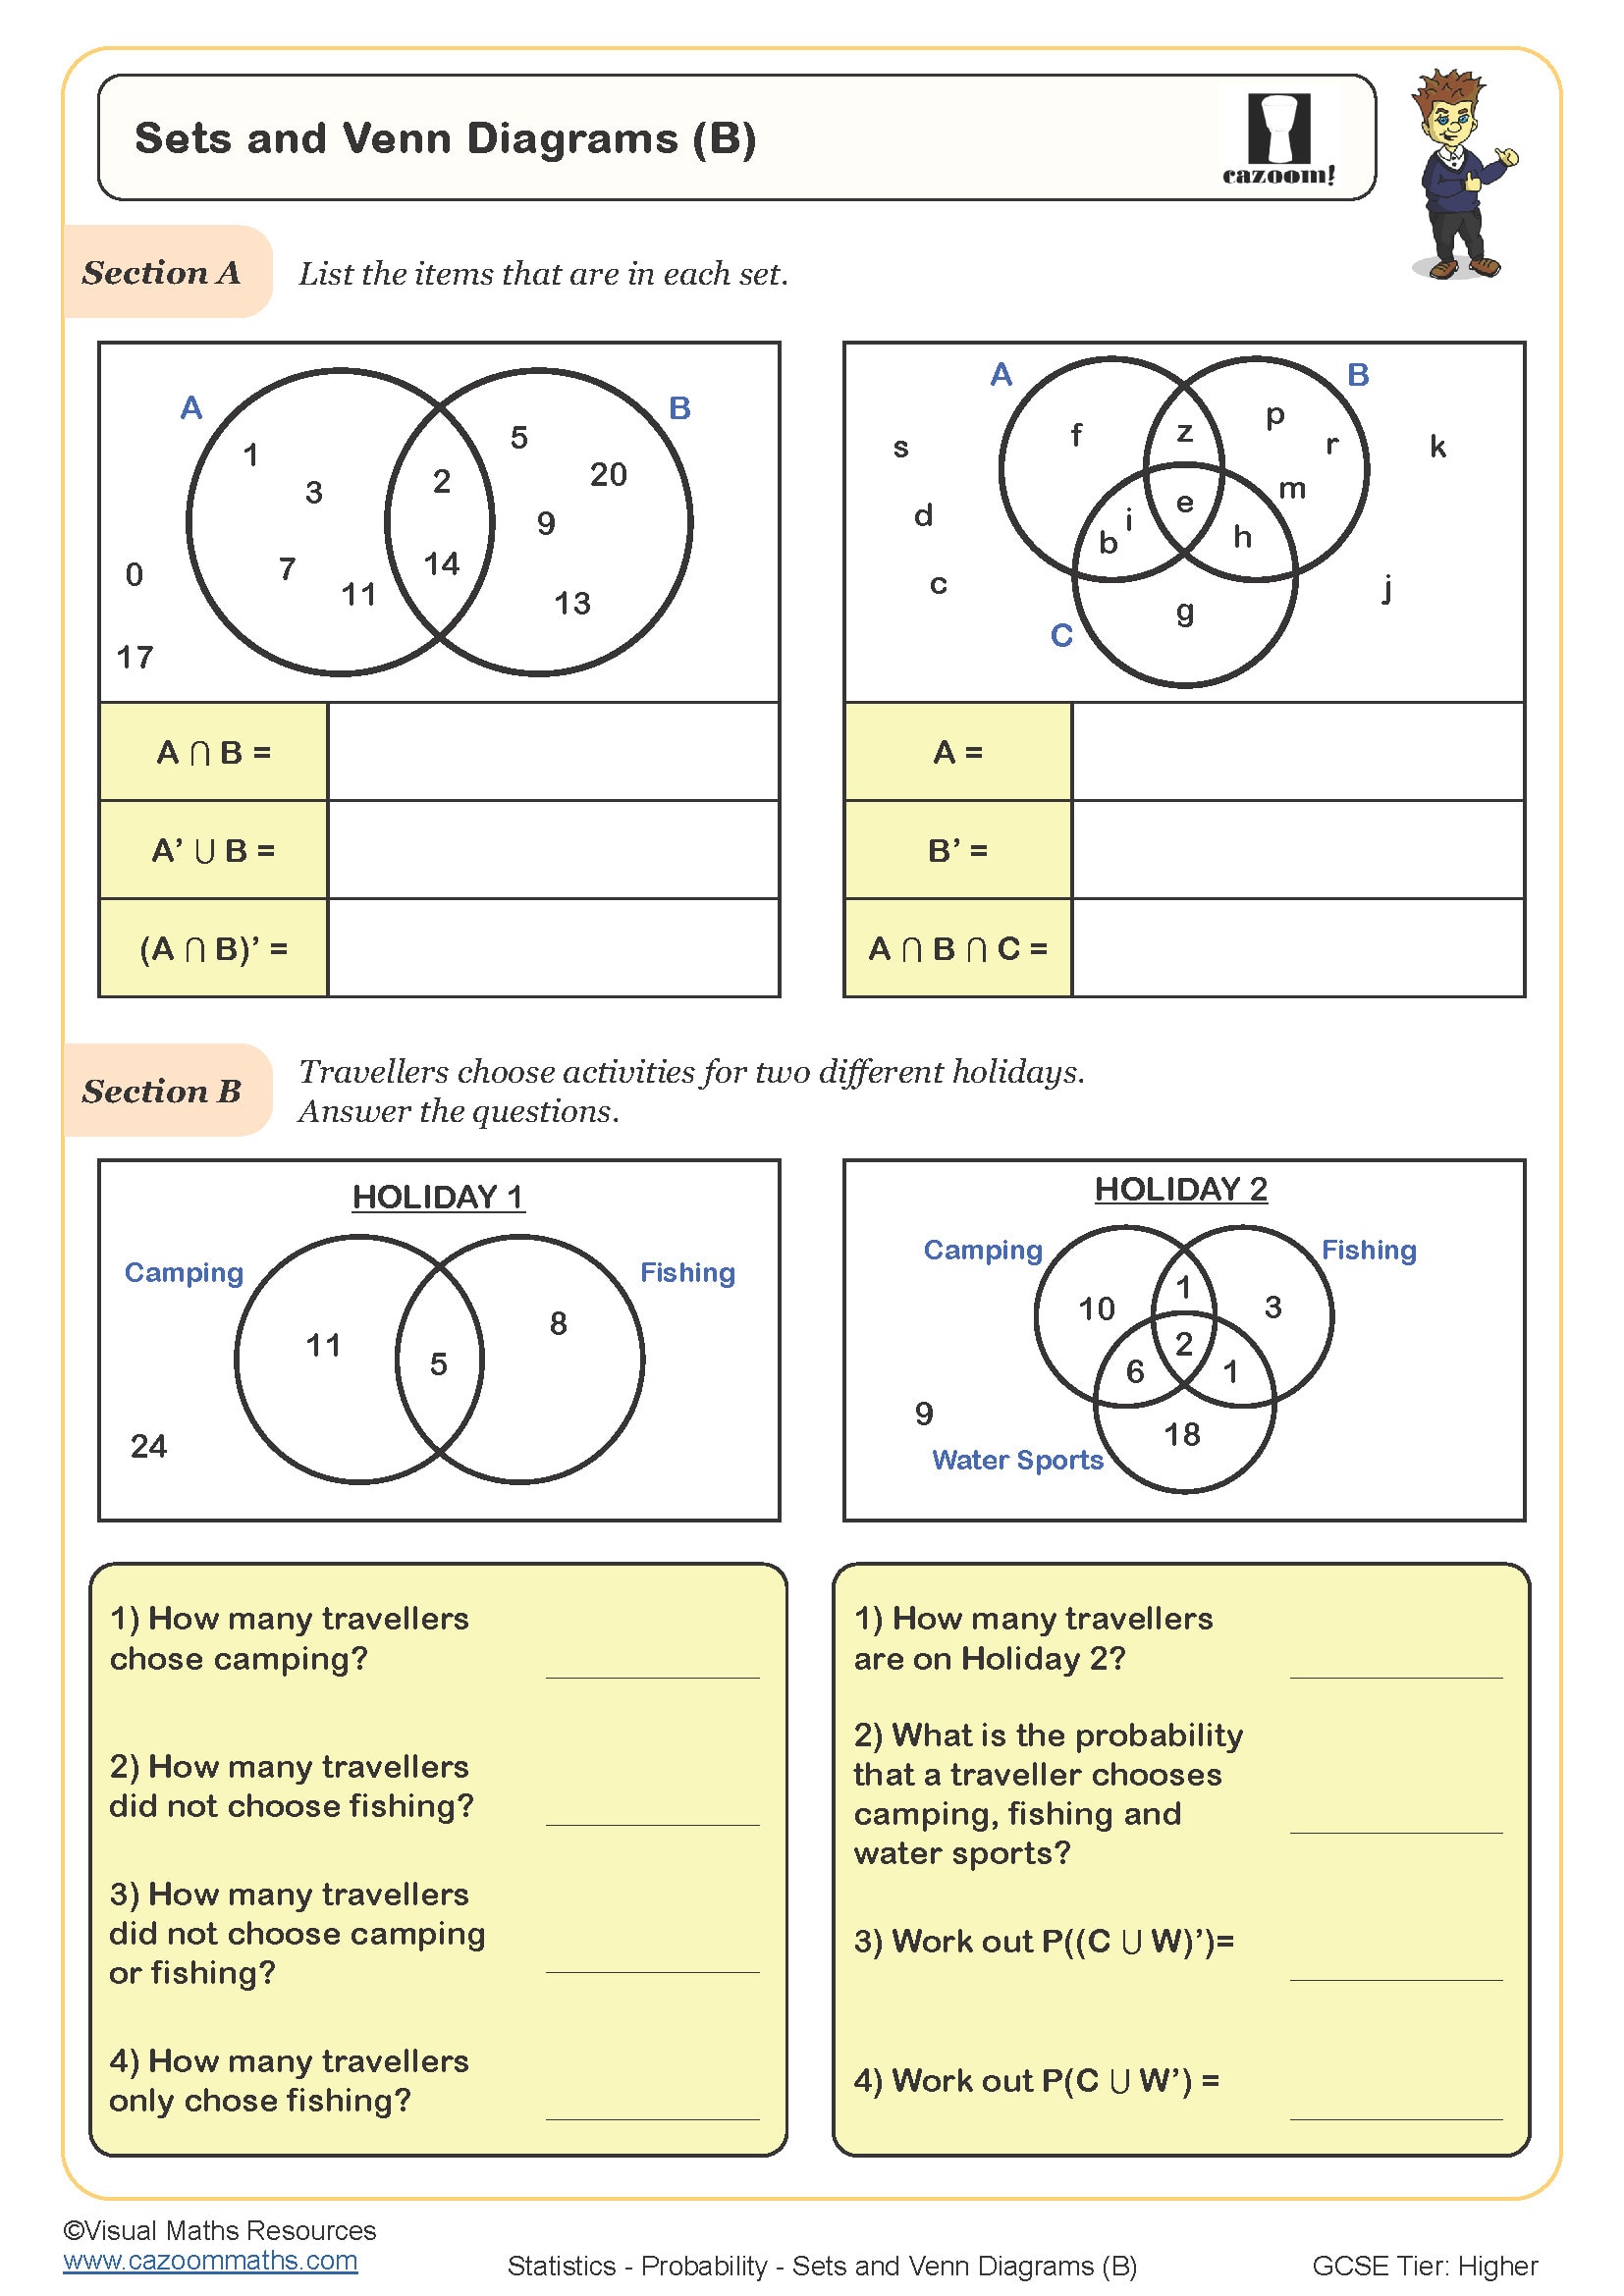
Sets and Venn Diagrams (B)
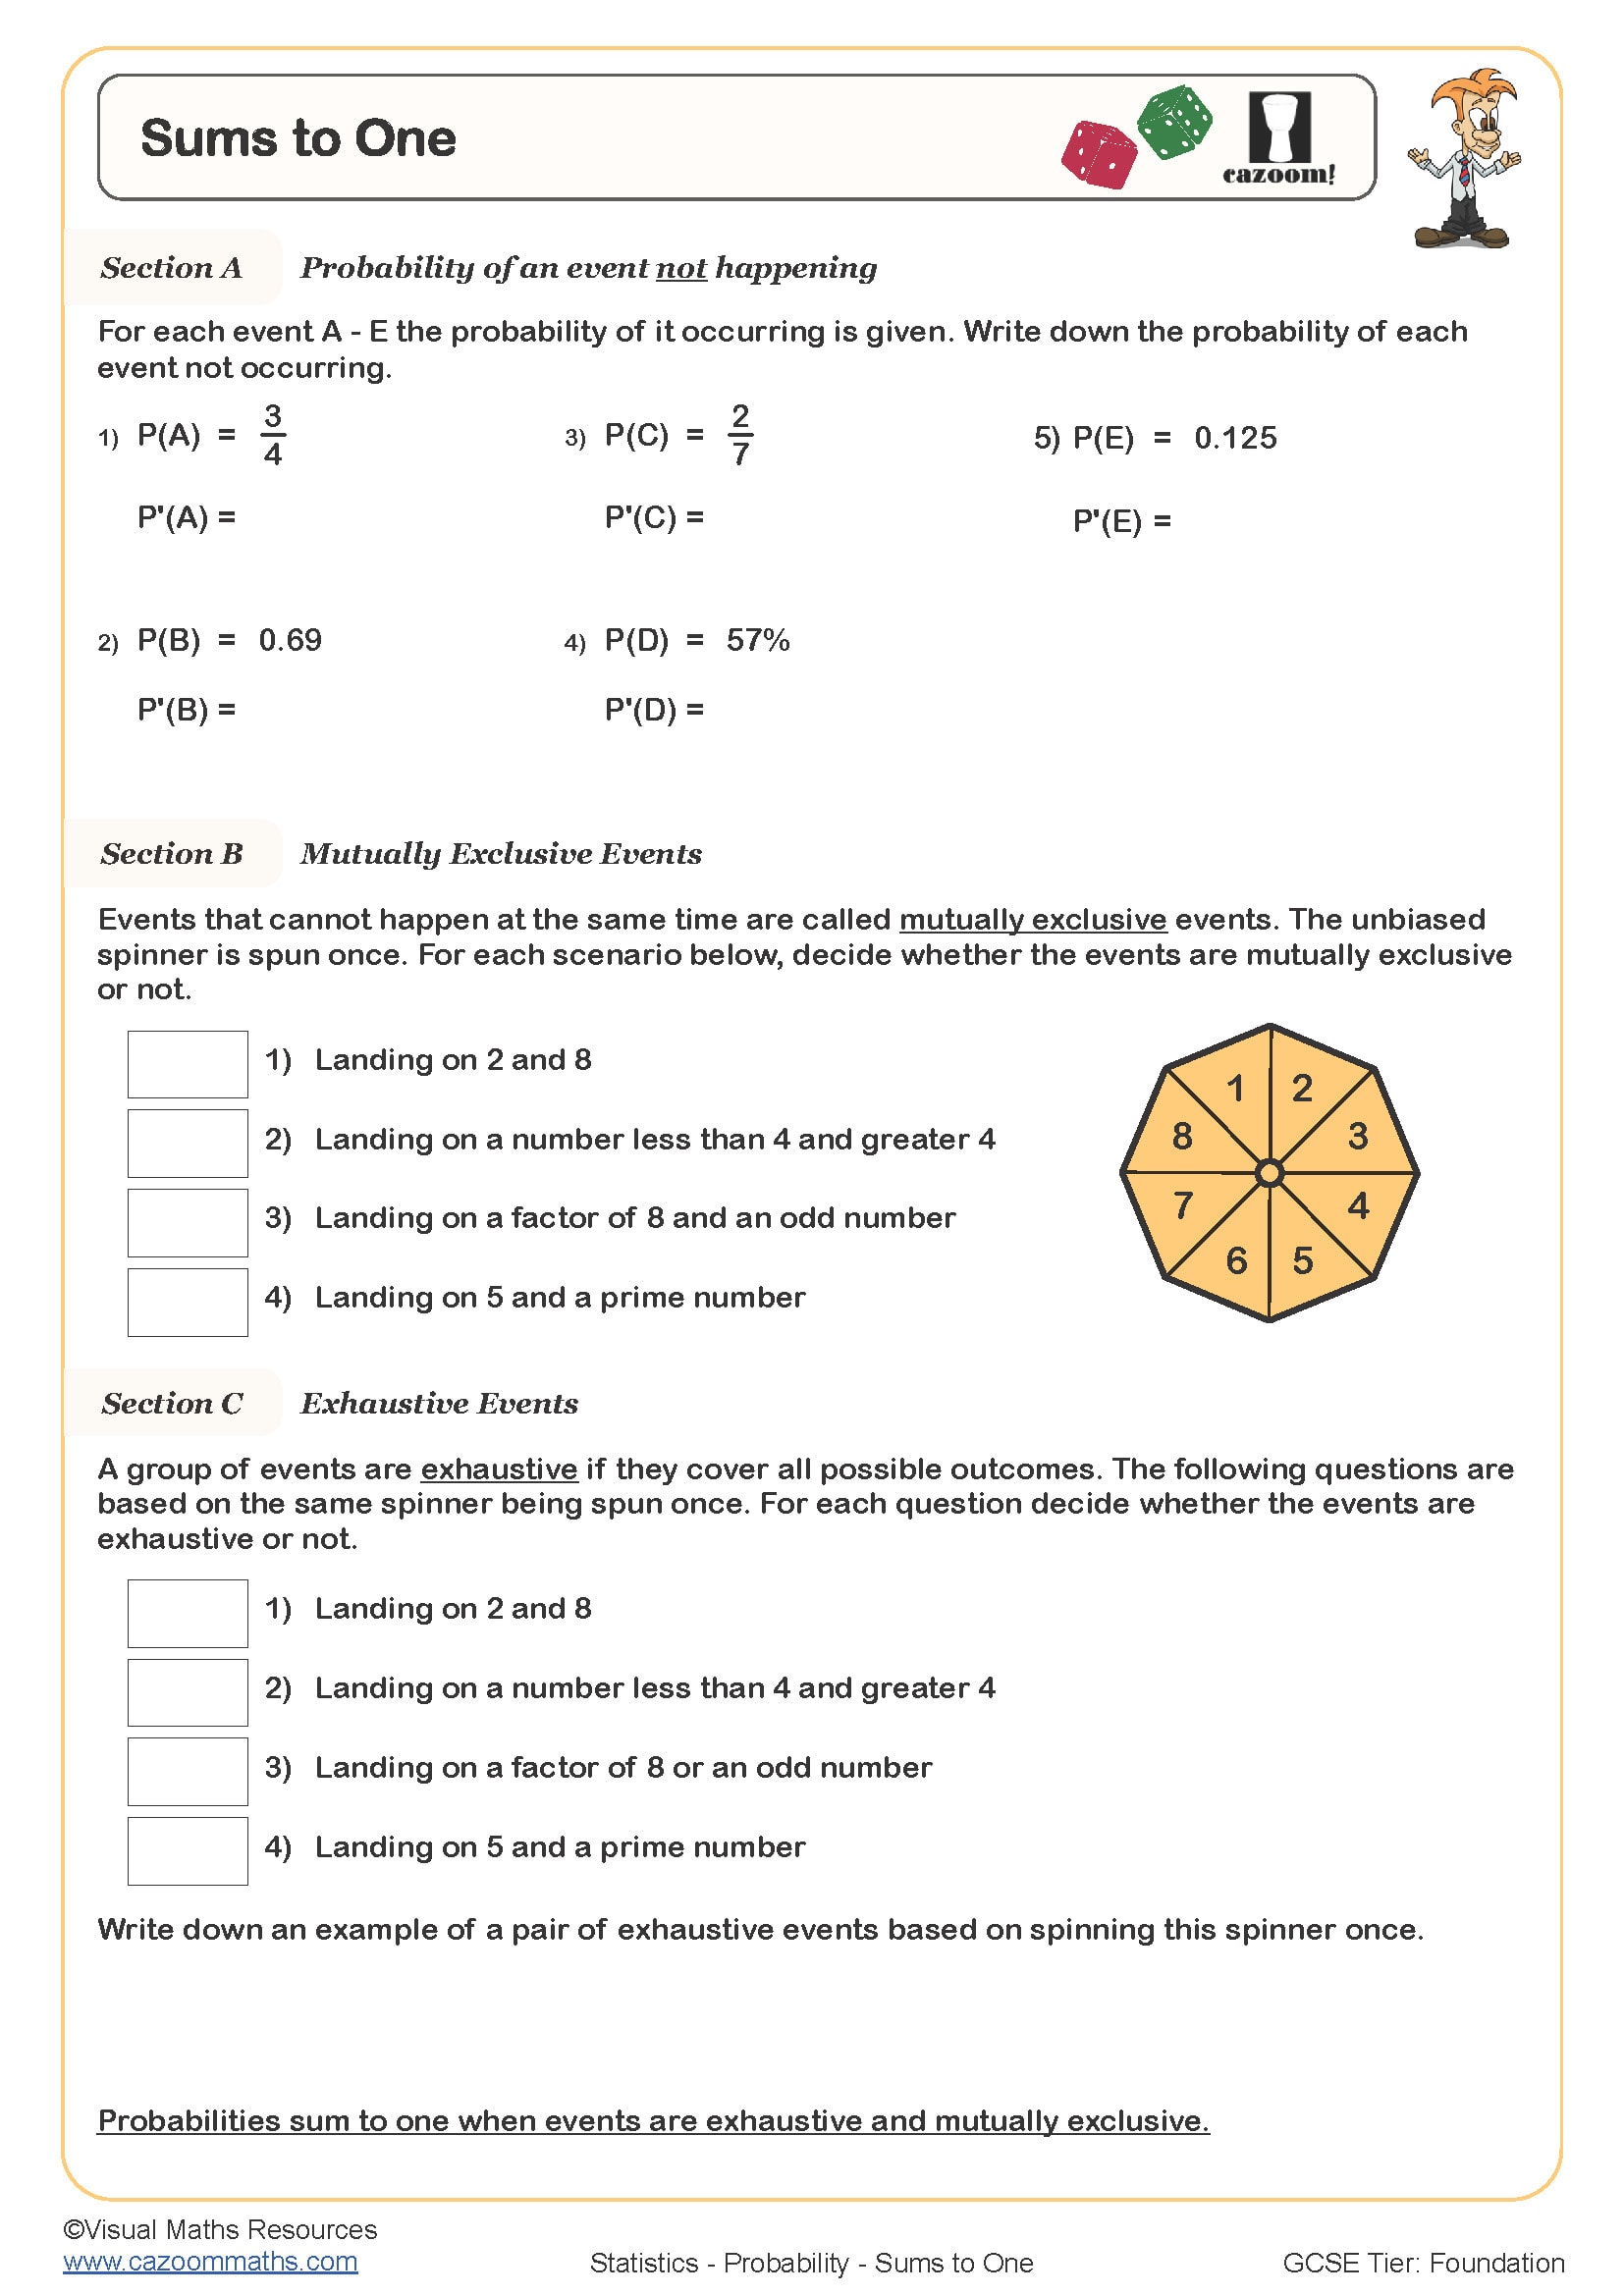
Sums to One
All worksheets are created by the team of experienced teachers at Cazoom Maths.
Discover the Key to Confident Learners Through Our Ready-to-Print Year 9 Statistics Worksheets
The worksheets expand on Year 8 knowledge by using different question formats which represent actual data-based challenges that students encounter in real life. Students learn to detect patterns through their education in complex data analysis and the development of mathematical expression skills. The transition from calculation-based problems to interpretative challenges helps students develop critical thinking abilities, which are necessary for advanced mathematical work. Students need to practice their materials at a steady pace to prevent knowledge gaps from developing when studying abstract subjects. This systematic approach transforms statistics from isolated techniques into interconnected problem-solving tools.
Specific learning benefits include:
• Master calculating averages from grouped data
• Develops confidence in interpreting scatter graphs.
• Strengthens probability reasoning skills
• Improves data representation choices
• The tool helps students to improve their comprehension of statistical vocabulary.
• Builds analytical thinking patterns
• Through this program, students gain fundamental knowledge which enables them to reach GCSE success.
Maths Skills You’ll Cover Using Cazoom Maths Year 9 Statistics Resources
The worksheets follow a structured progression which begins with numerical problems, followed by picture-based activities and ends with abstract statistical thinking based on established teaching methods. The resources provide complete worked solutions that demonstrate step-by-step methods to help students understand the mathematical reasoning in each calculation. The collection systematically addresses every statistics topic within the Year 9 curriculum.
The worksheets in this collection include:
• Mean, Median and Mode — calculating averages from frequency tables and grouped data
• Range and Interquartile Range — measuring spread and identifying outliers effectively
• Probability Fundamentals — understanding theoretical and experimental probability concepts
• Tree Diagrams — solving multi-stage probability problems systematically
• Scatter Graphs and Correlation — identifying relationships between variables visually
• Cumulative Frequency Graphs — constructing and interpreting cumulative frequency curves
• Box Plots — representing data distribution using five-number summaries
• Sampling Methods — understanding bias and representative data collection
• Frequency Polygons — comparing distributions through graphical representation
• Statistical Investigations — planning and conducting data collection projects
Unlock Faster Problem-Solving With Our KS3 Statistics Activities
The differentiated structure of the lesson enables teachers to use it with students of different abilities simultaneously, as it provides extension questions for advanced learners and foundational tasks for those who need review. Students achieve better learning results through proper lesson organisation and formatting, which also decreases their risk of confusion. The different types of questions in the exam help students prepare for real tests while avoiding information overload. Teachers use answer sheets to decrease their grading workload while showing students the proper methods of solving problems. The worksheets from Cazoom Maths work perfectly with current teaching plans to help students with their classroom work and their homework.
The Real-World Maths That Starts With Year 9 Statistics Activities
The statistical reasoning skills developed through these worksheets help people evaluate news reports and apply data to make improved choices in their everyday activities. For example-
• The evaluation of election predictions together with opinion polls demands a thorough examination.
• The correct interpretation of medical research and health statistics needs a solid grasp of their actual significance.
• A comprehensive evaluation of sports performance data and league standings is necessary.
• Evaluating climate change data and environmental trends
• The process of financial decision-making relies on statistical evidence analysis for its operations.
• Learning visual deception detection skills enables people to make informed decisions when watching advertisements and media content.
• Scientific experiments require suitable sampling methods to reach their successful completion.
• Risk assessment serves as an essential tool in our everyday lives because it enables us to identify potential threats, allowing us to take protective actions for ourselves and others.