Comparing Back to Back Stem and Leaf Diagrams RESOURCE (FREE DOWNLOAD)
Comparing Back to Back Stem and Leaf Diagrams RESOURCE DESCRIPTION
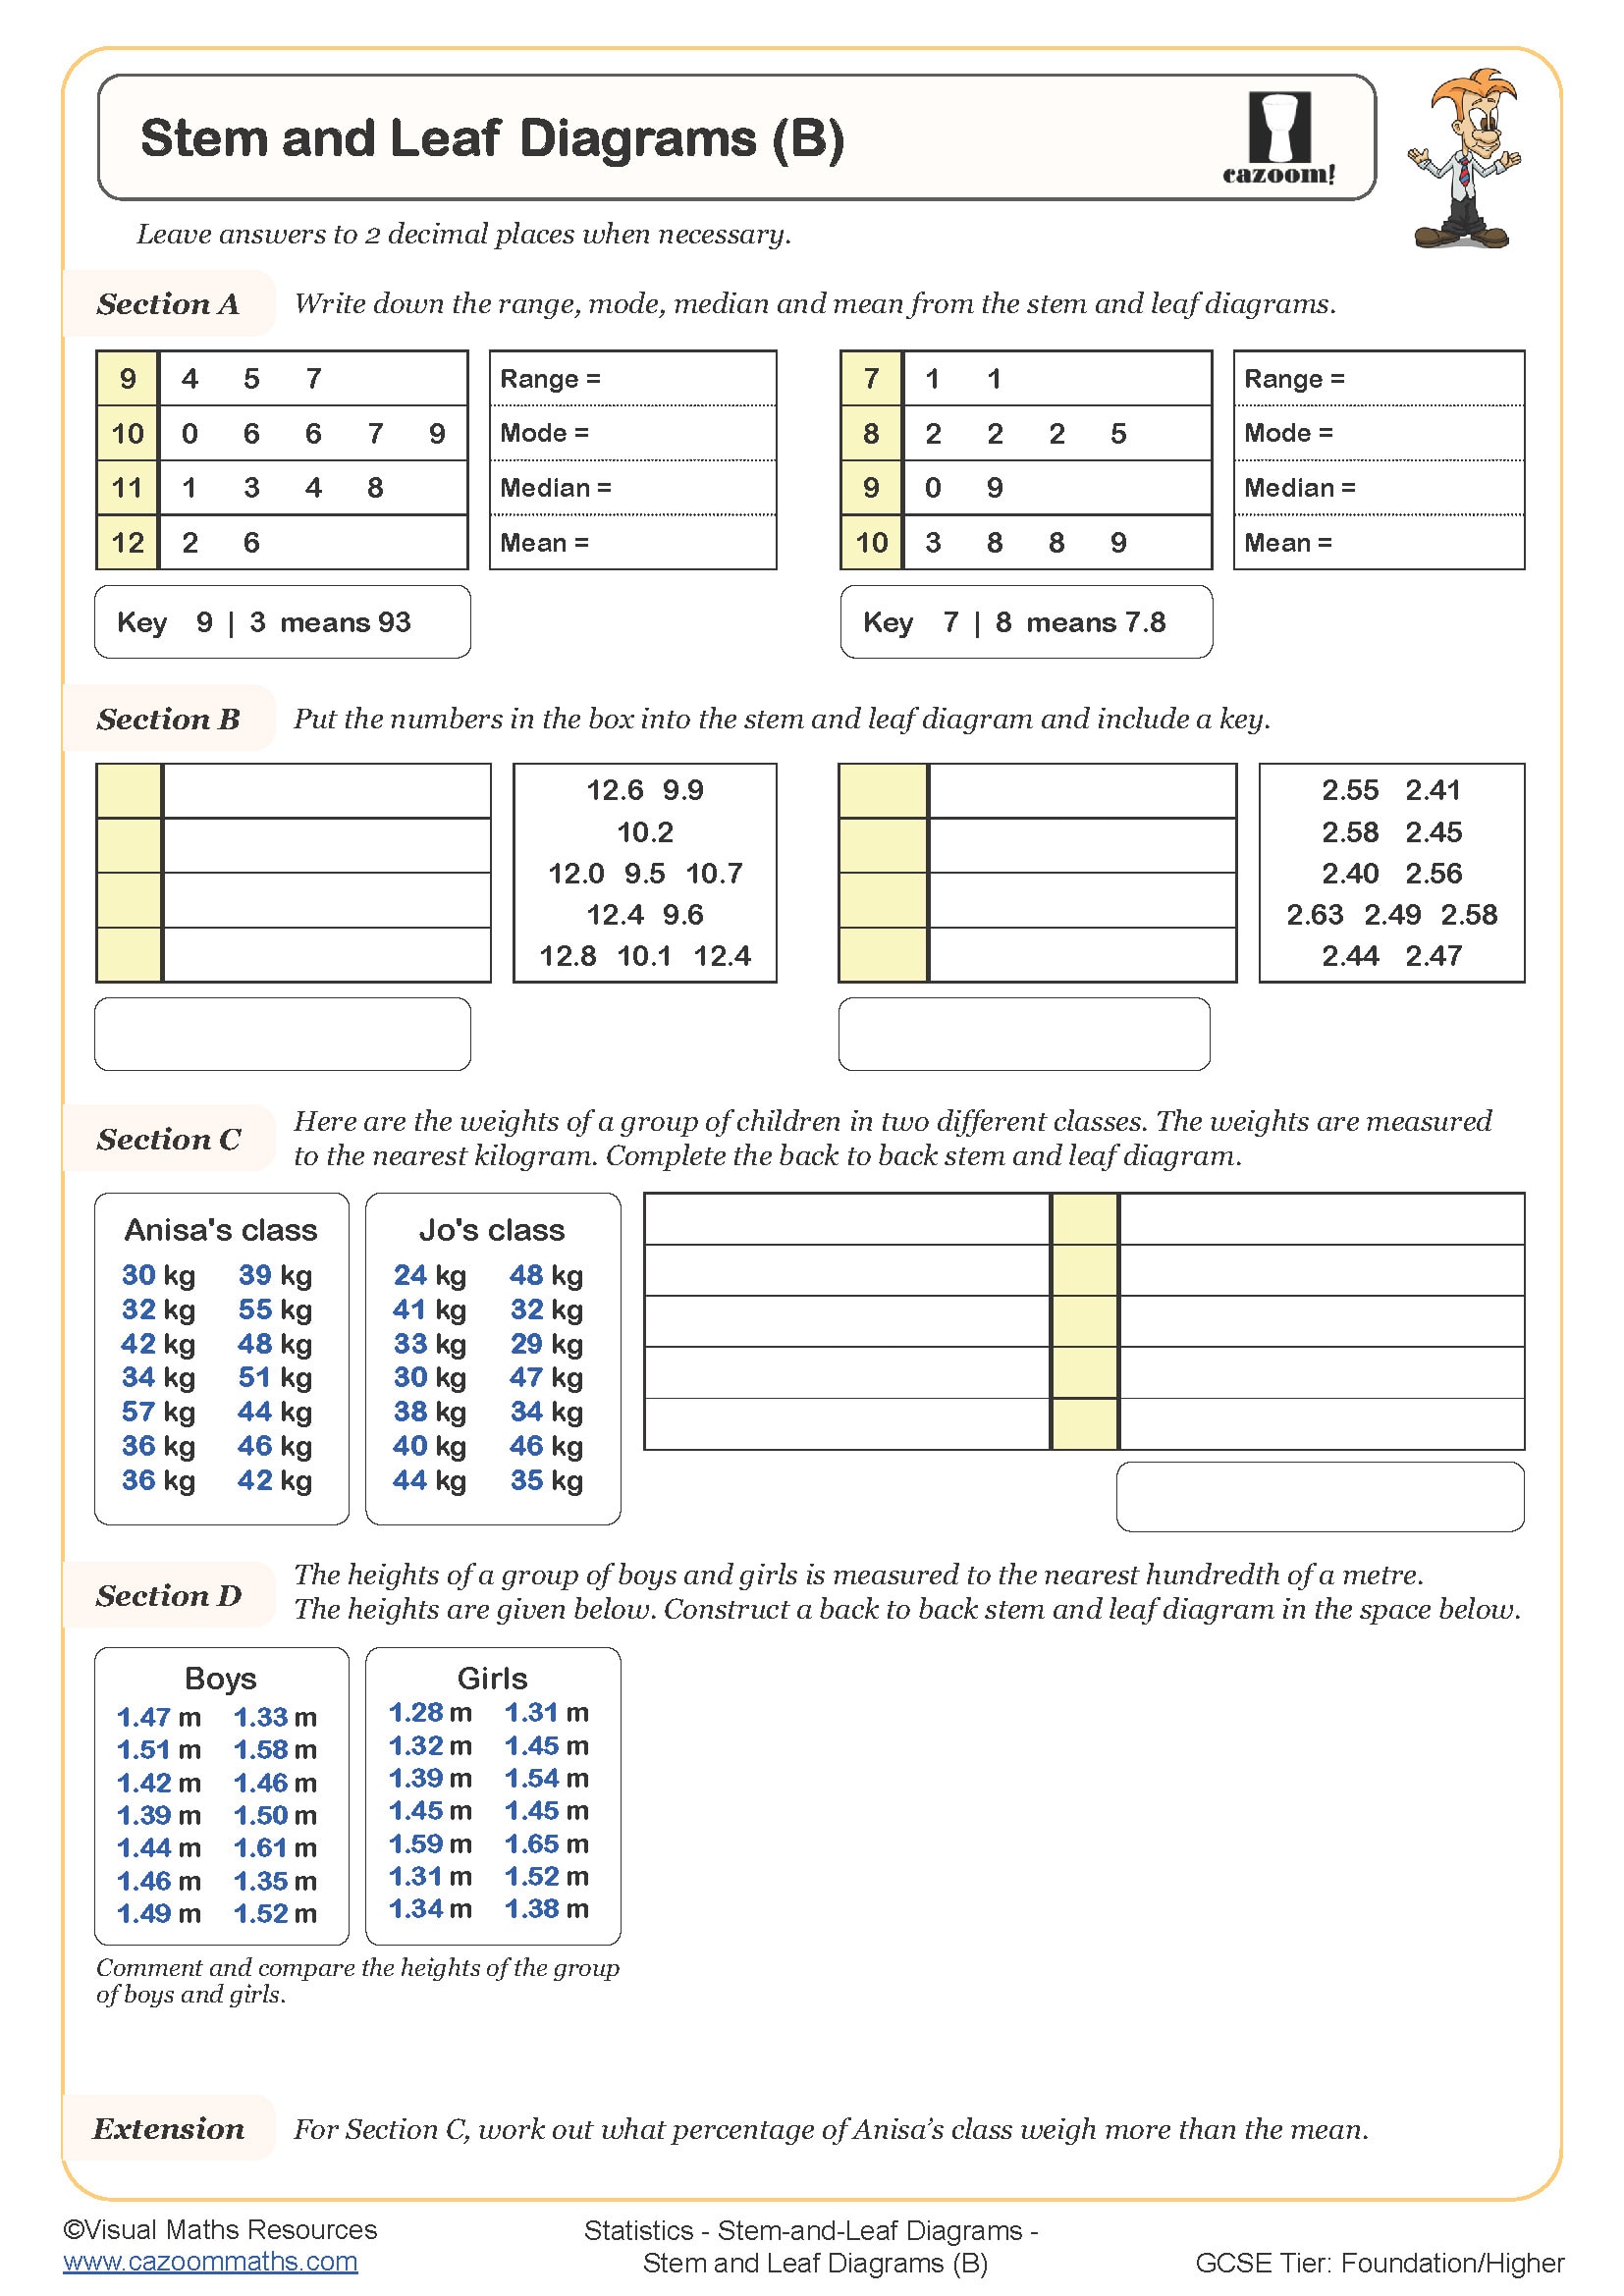
This resource shows one back to back stem and leaf diagram and the interquartile range being calculated for both sets of data in order to compare test scores of two classes. Use this resource to show how to find the interquartile range from a stem and leaf or as discussion for comparing two data sets.
All worksheets are created by the team of experienced teachers at Cazoom Maths.

RELATED TO Comparing Back to Back Stem and Leaf Diagrams
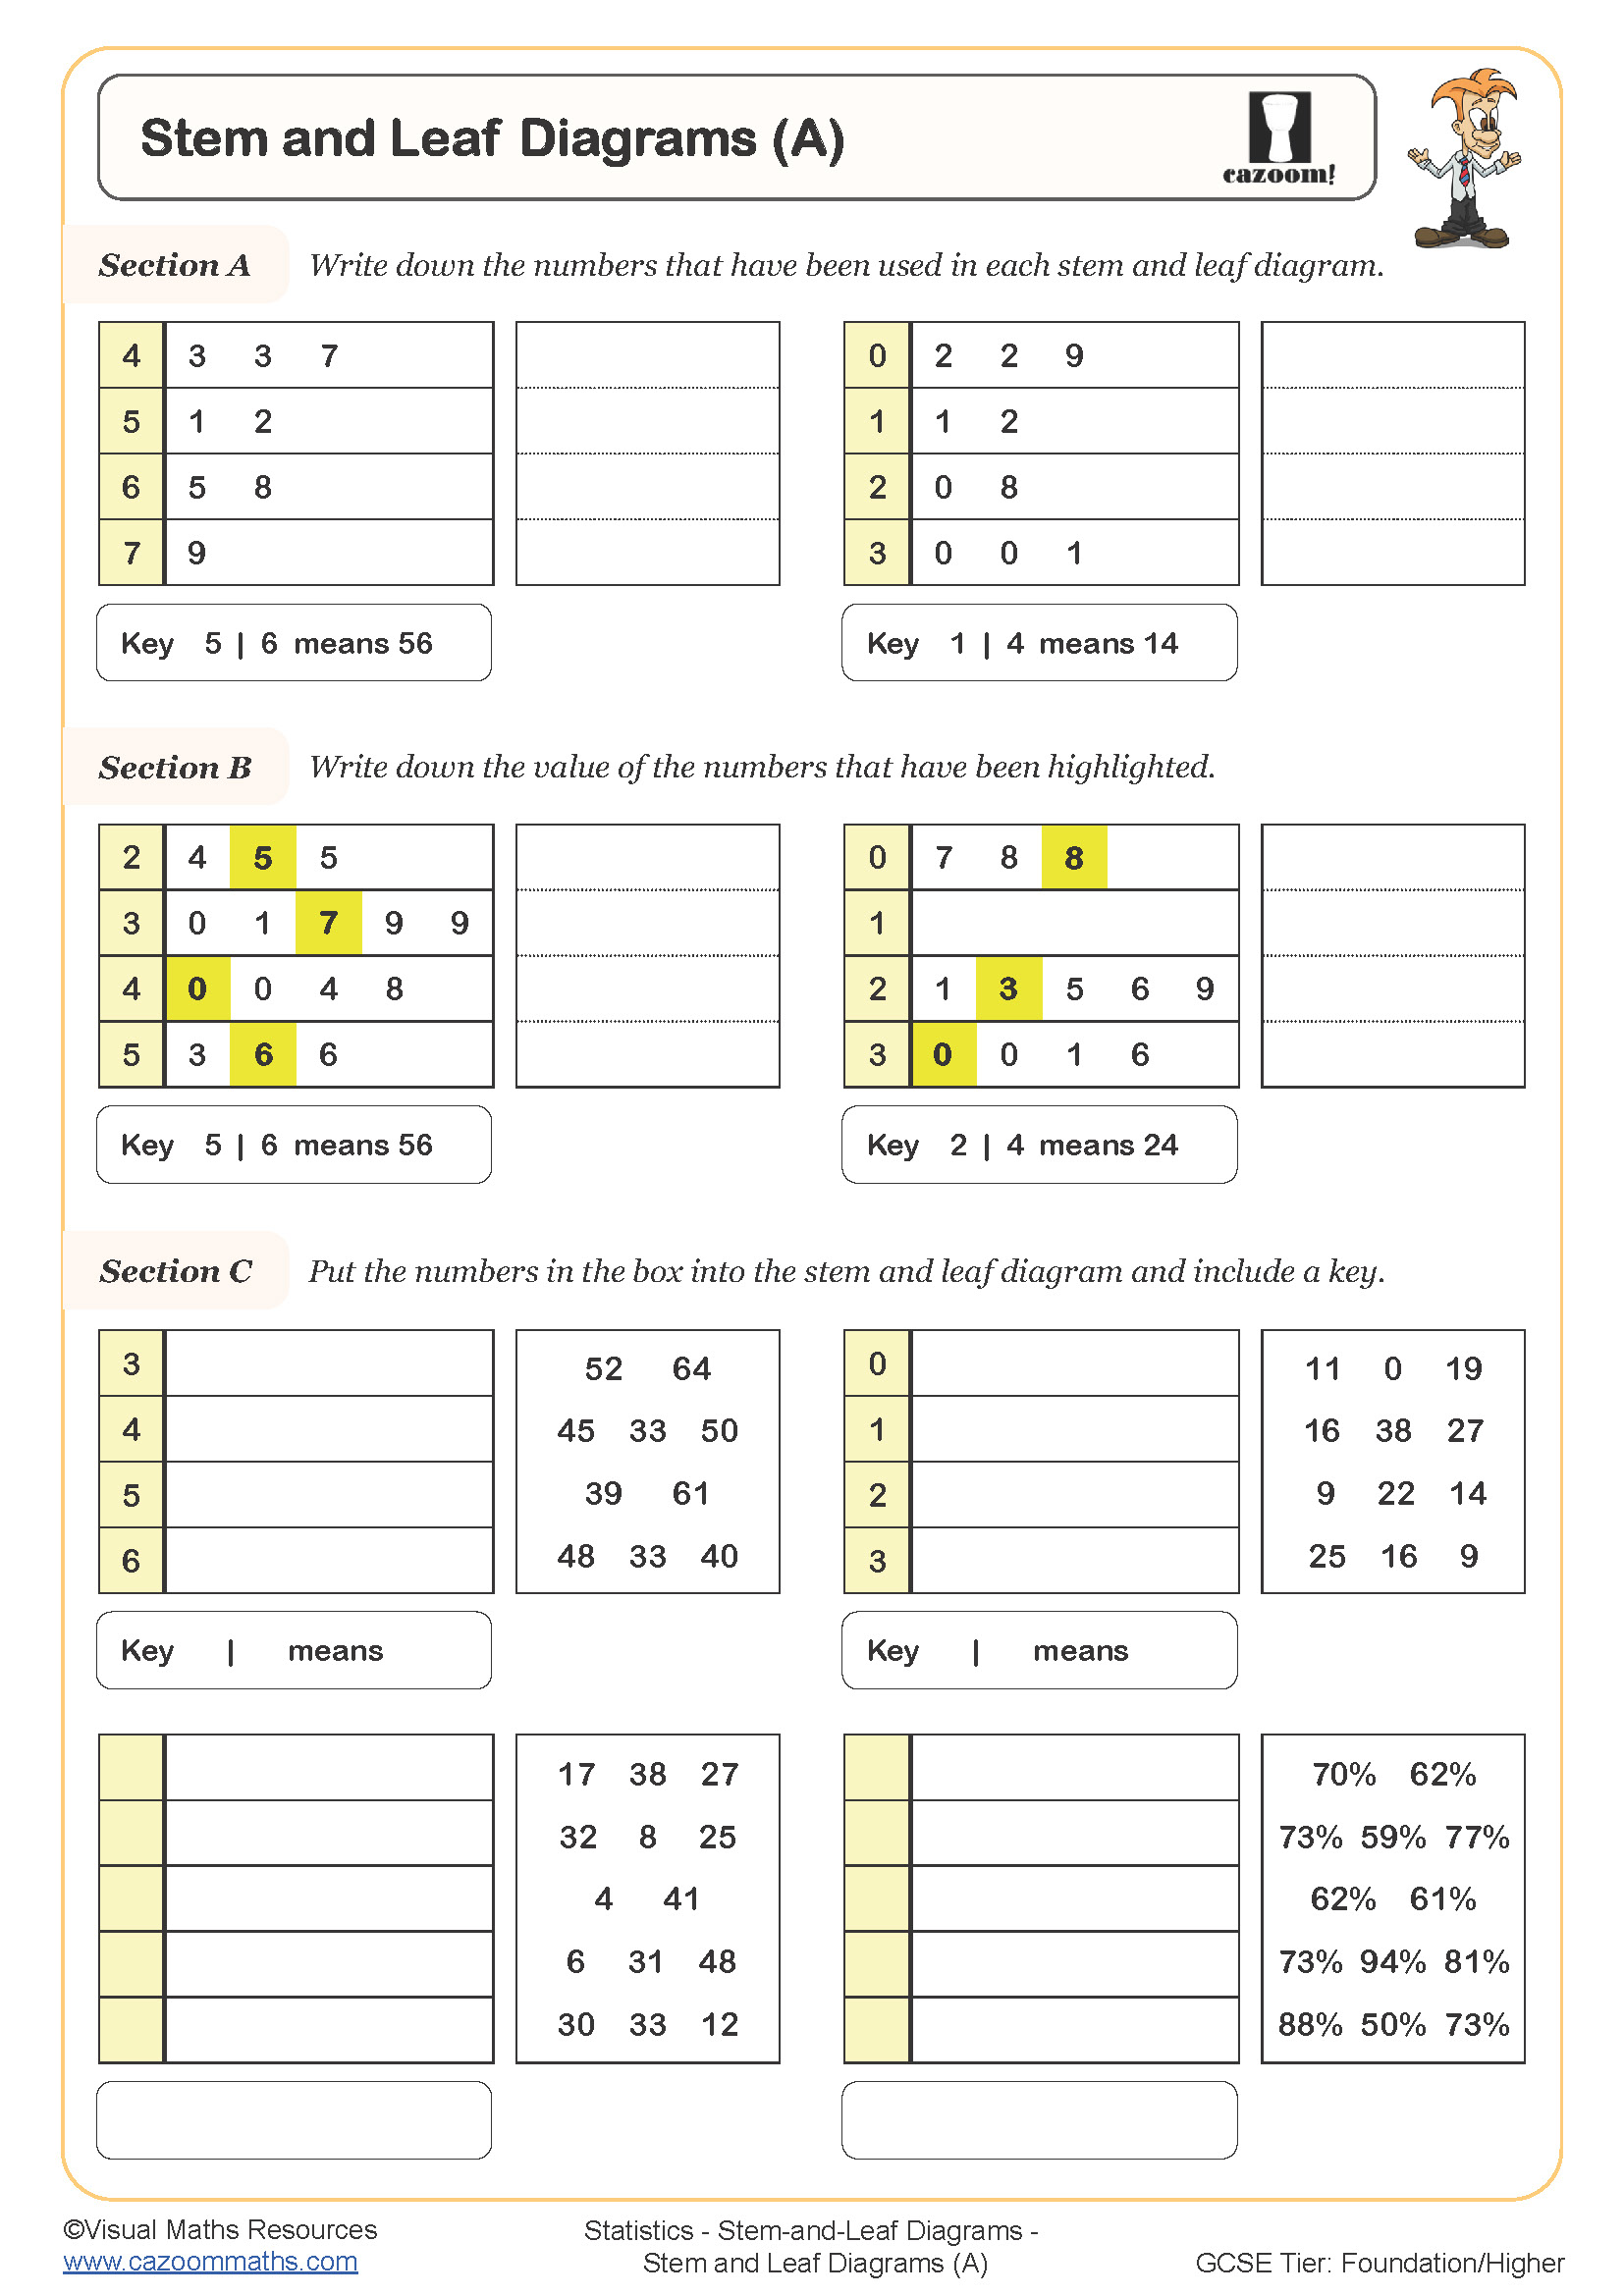
Comparing Back to Back stem and Leaf Diagrams
This resource focuses on using back-to-back stem and leaf diagrams to compare two sets of data side-by-side.
Why is data comparison important?
Comparing data sets helps us:
- Identify similarities and differences: Find patterns and variations.
- Draw conclusions: Make informed decisions based on analysis.
- Solve problems: Use data comparison to solve real-world problems.
How can this resource help?
This resource aids in understanding data comparison:
- Explanation: Explains how back-to-back diagrams work.
- Examples: Provide examples comparing datasets with diagrams.
- Visual comparison: Shows how the format aids in analysis.
- Free PDF download: Offers an easily accessible reference tool.
Benefits for learners:
- Improves data comparison and interpretation skills.
- Develops an understanding of how to use stem and leaf diagrams effectively.
- Supports learning about data analysis and decision-making.
This resource is perfect for teachers extending lessons on stem and leaf diagrams. It's also valuable for students needing extra practice in data comparison or parents helping with maths homework.
Also, have a look at our wide range of worksheets that are specifically curated to help your students practice their skills related to Stem and Leaf Diagrams. These teaching resources and worksheets are in PDF format and can be downloaded easily.