Mean From Grouped Frequency Table Example RESOURCE (FREE DOWNLOAD)
Mean From Grouped Frequency Table Example RESOURCE DESCRIPTION
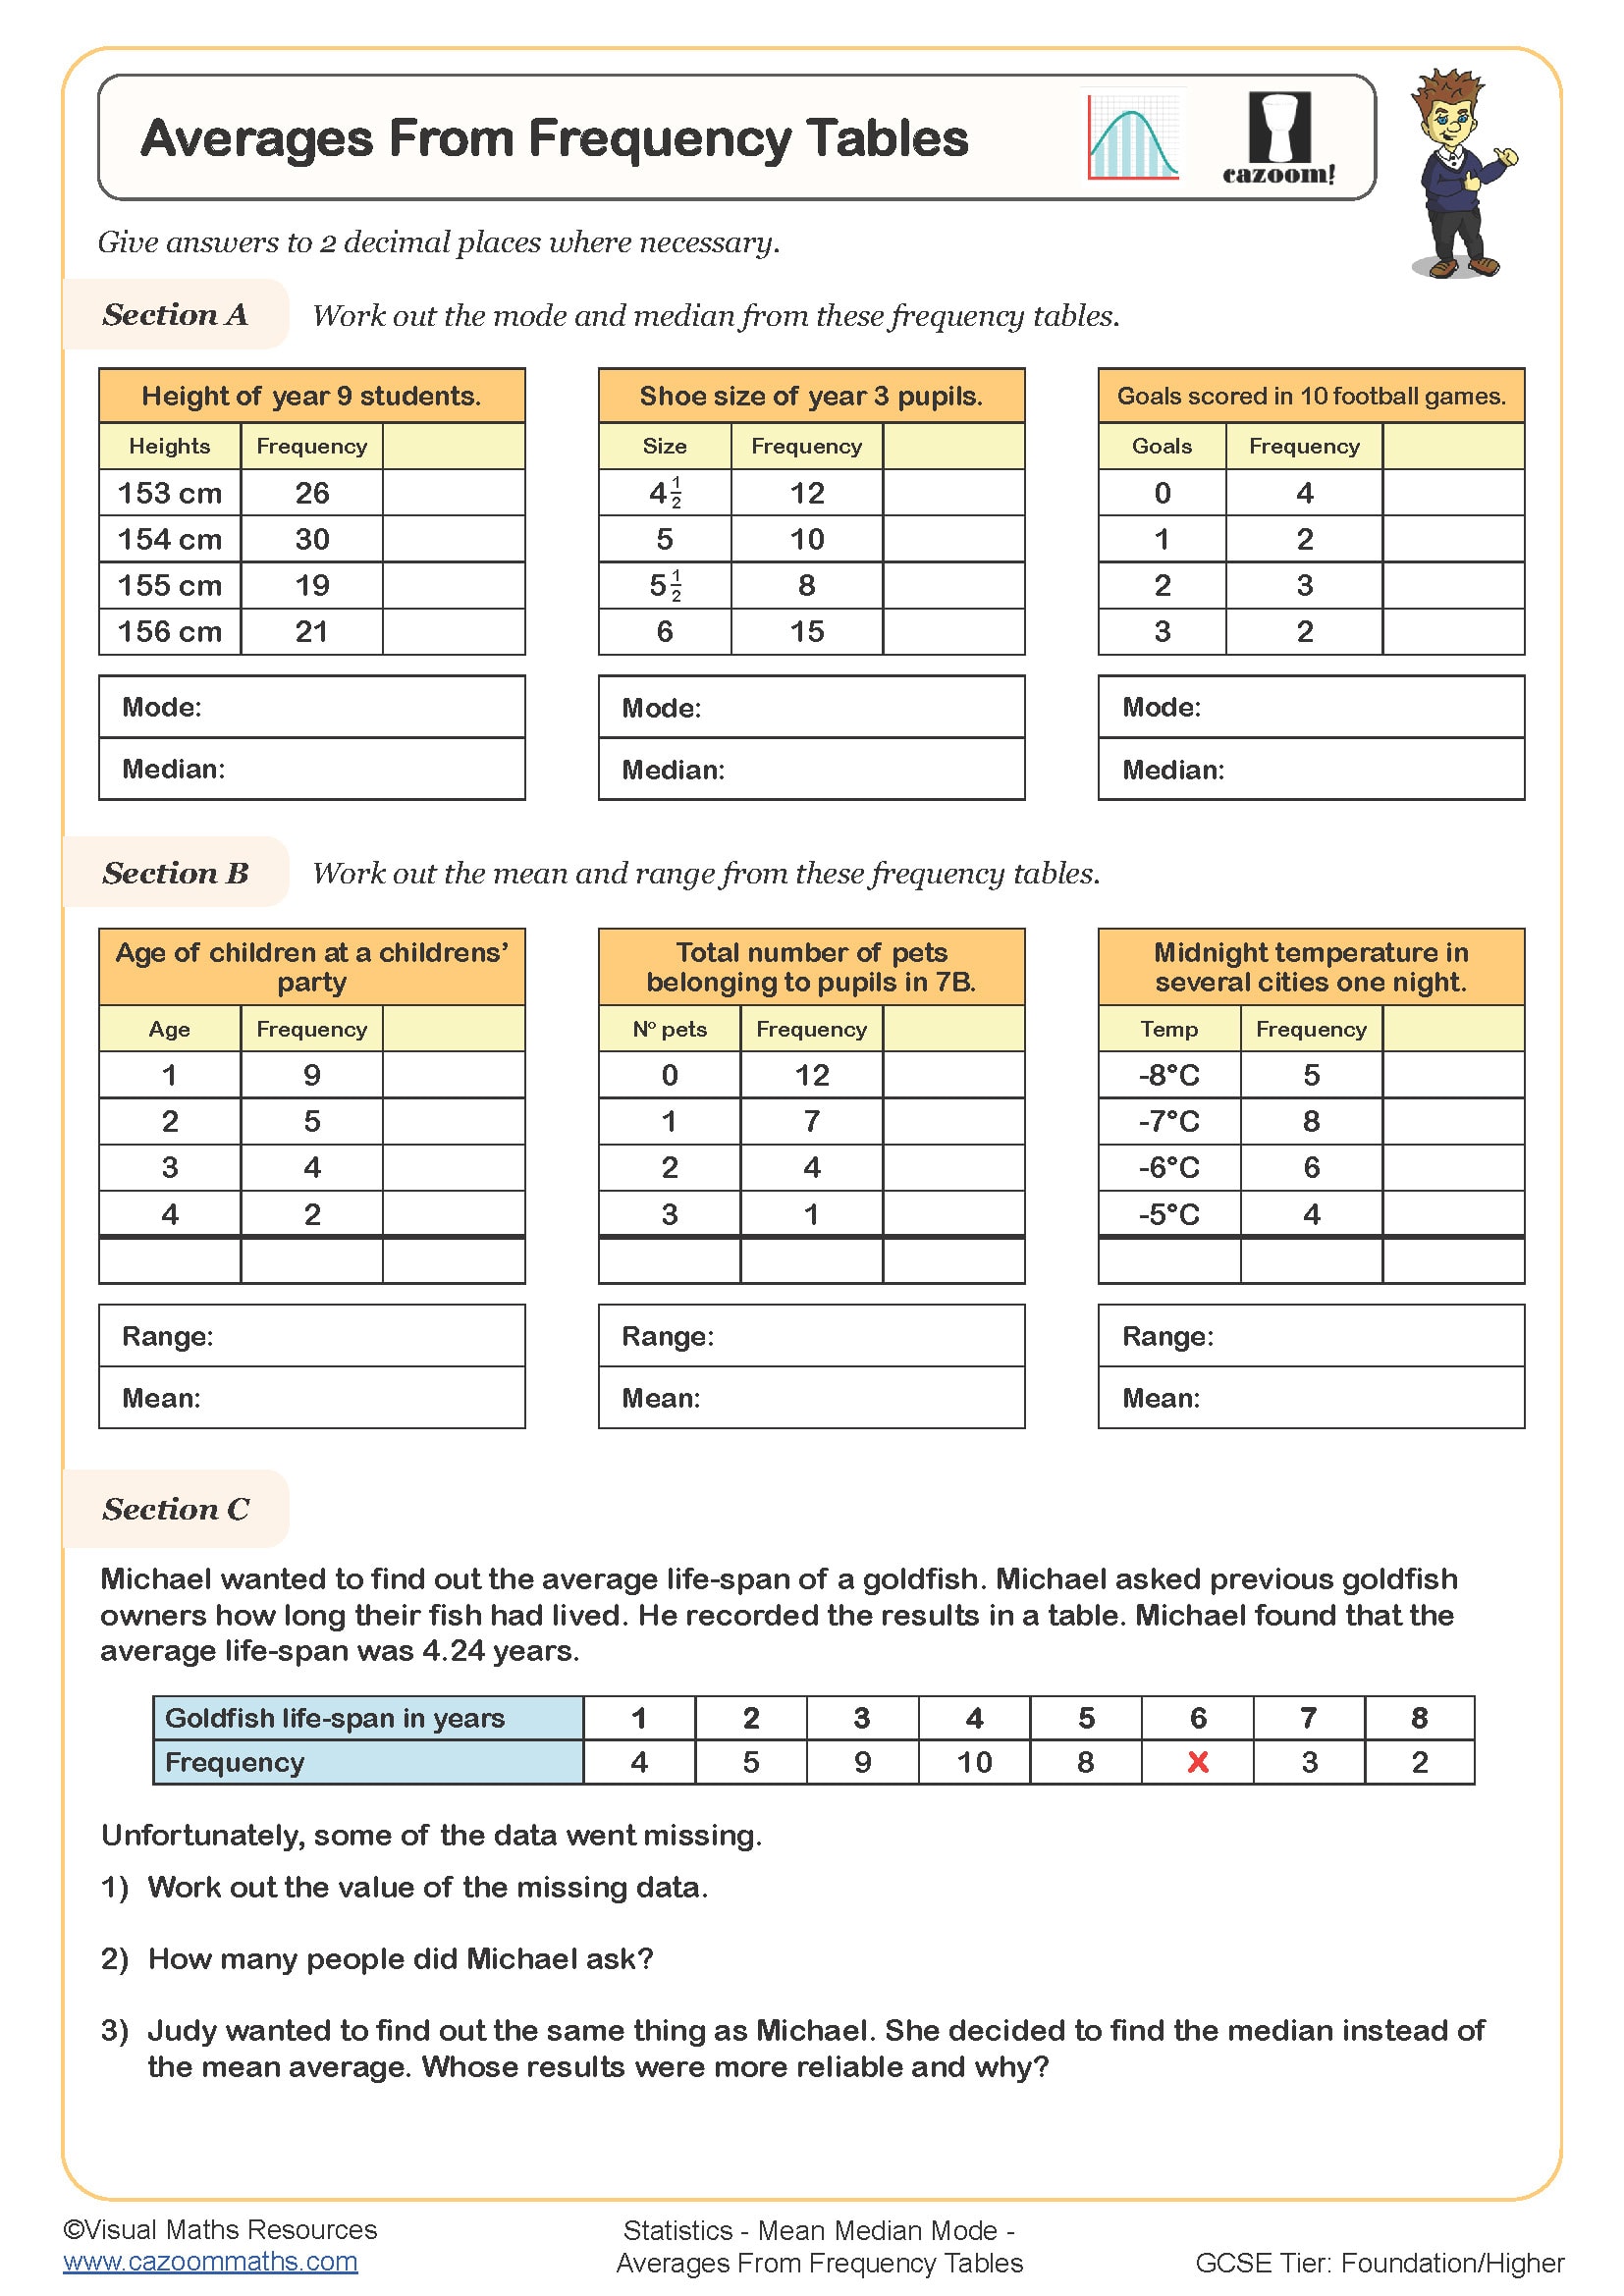
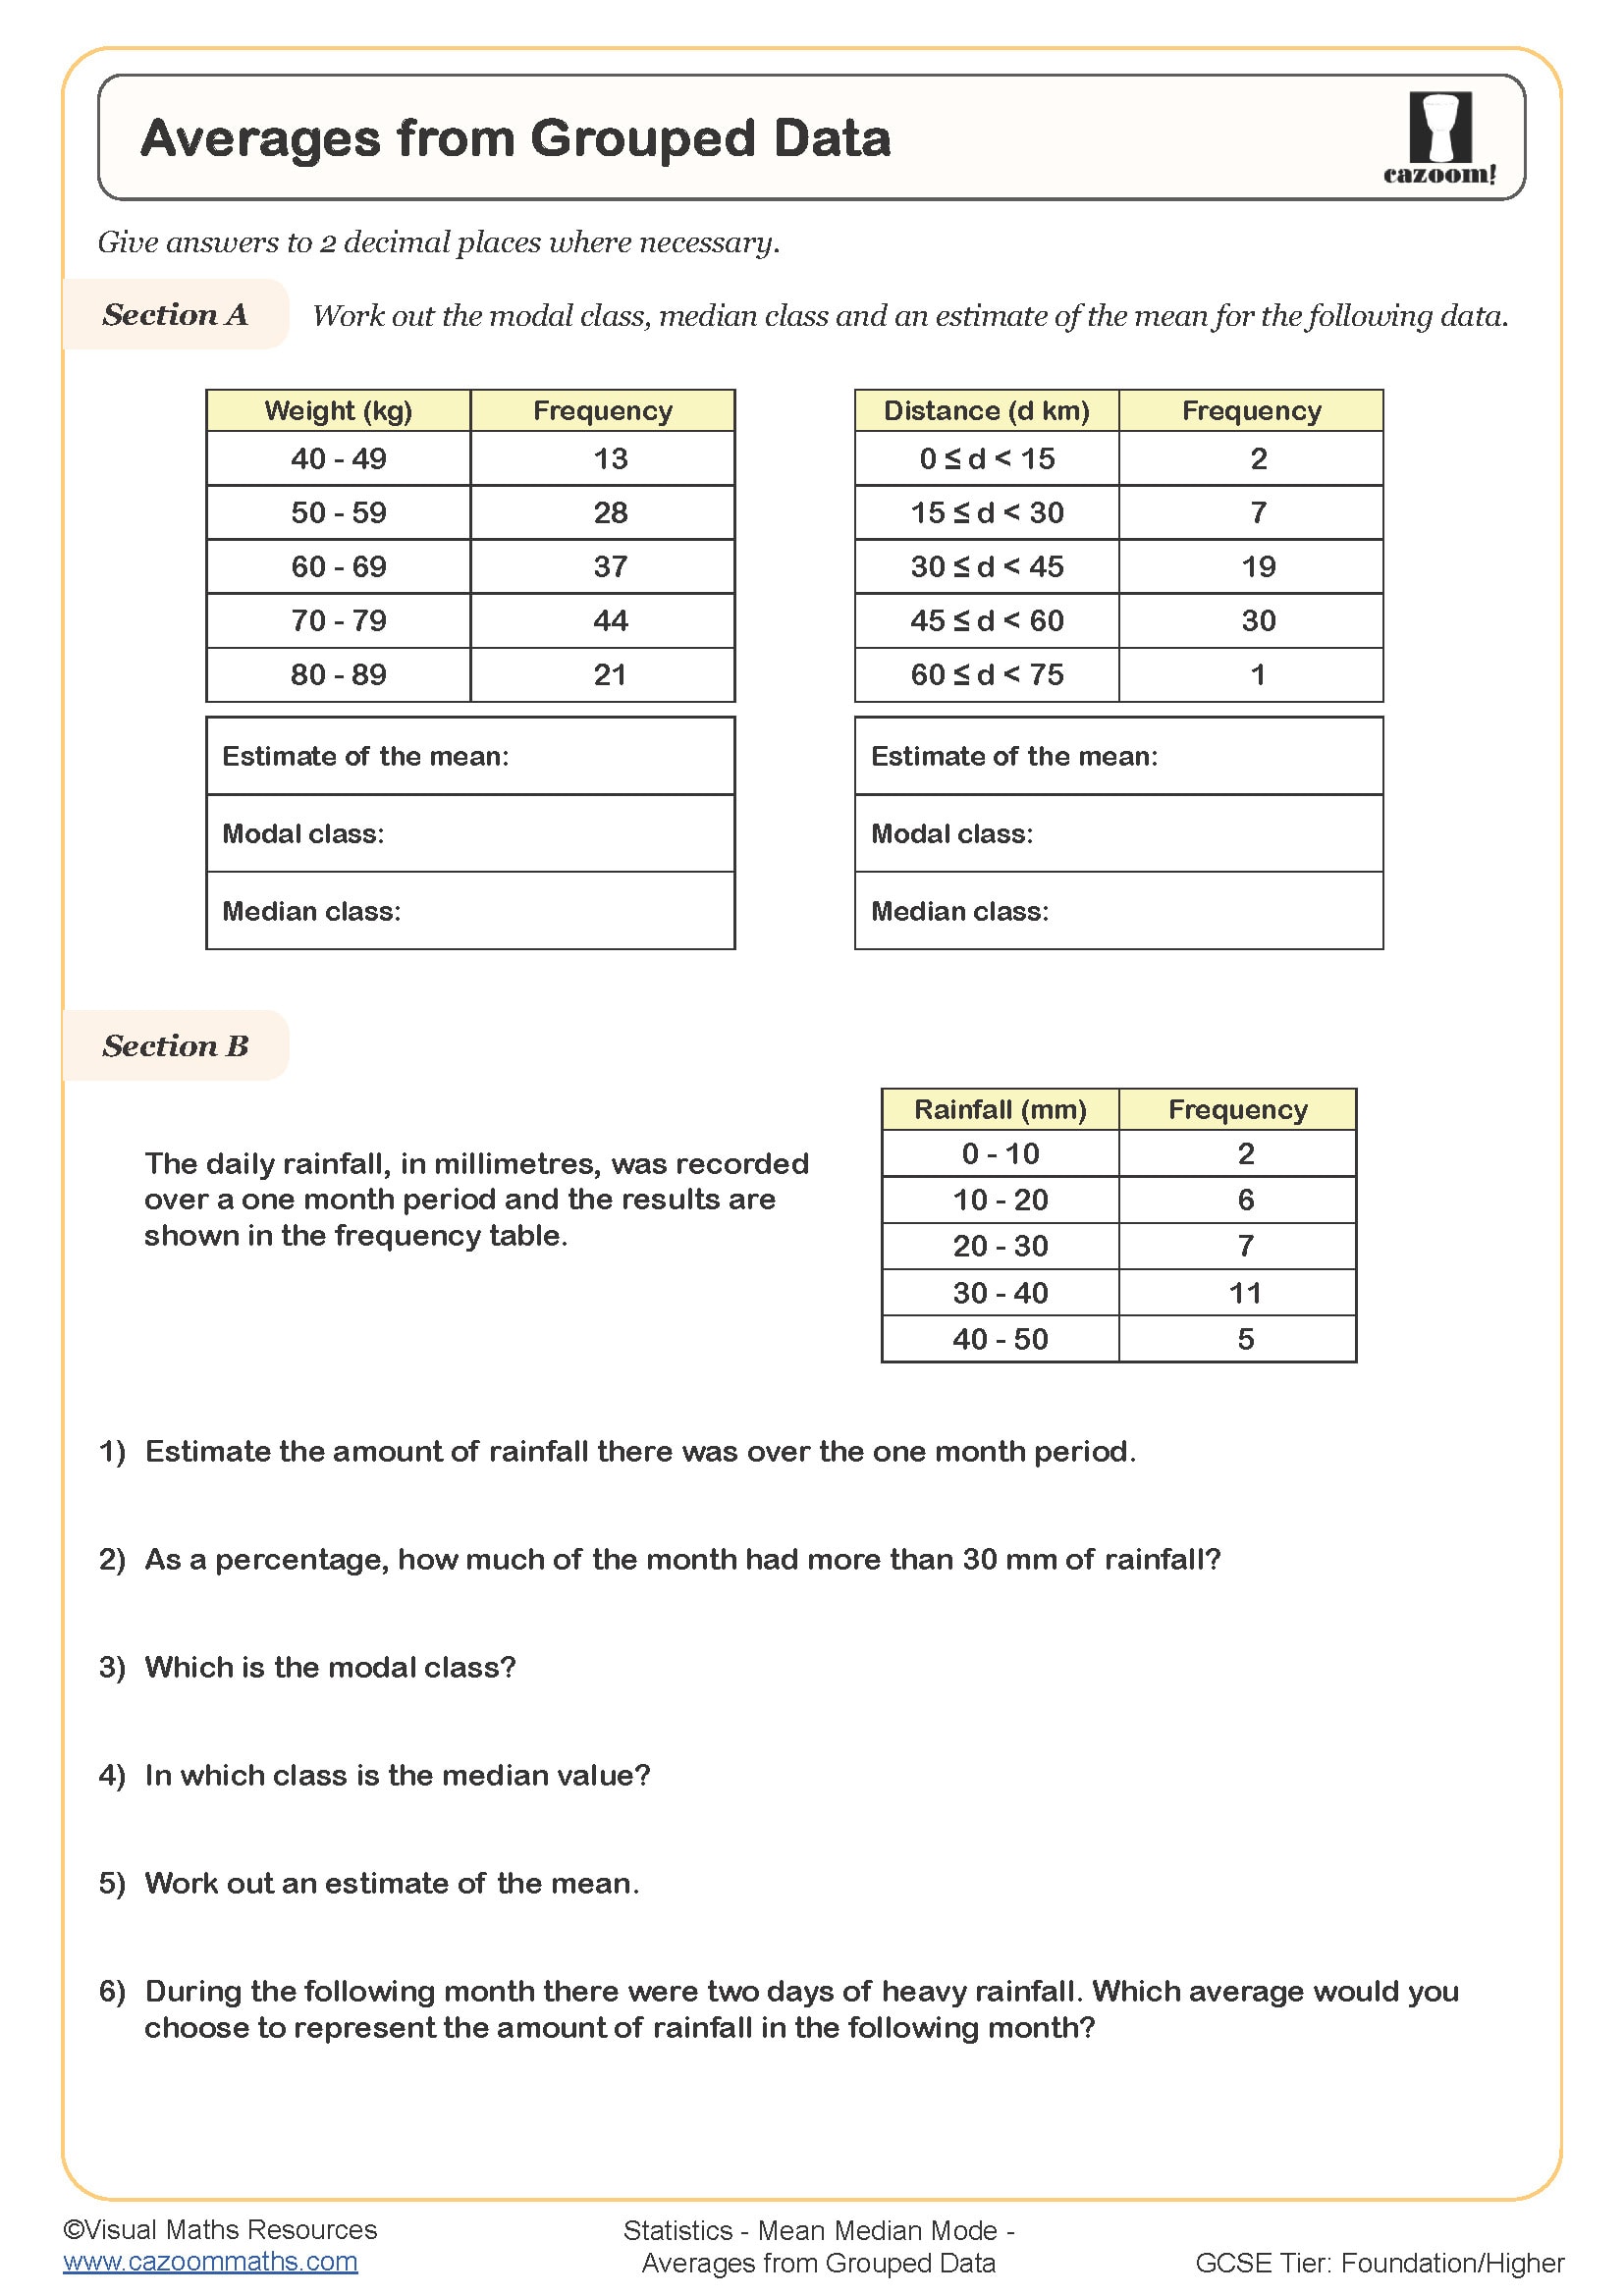
This document is a step-by-step guide to estimating a mean from a grouped frequency table. Can be given to students as a worked example or revision tool.
How to Work Out the Mean from a Frequency Table
The concept of mean from a frequency table is an important and common statistical method for KS3 and KS4 curriculum. This concept is generally used to find the average of grouped data. Our statistics teaching resource- ‘Mean From Grouped Frequency Table Example’ will help you teach and understand how to find the mean of a frequency table, as well as grouped and ungrouped frequency tables, with easy-to-understand, step-by-step explanations.
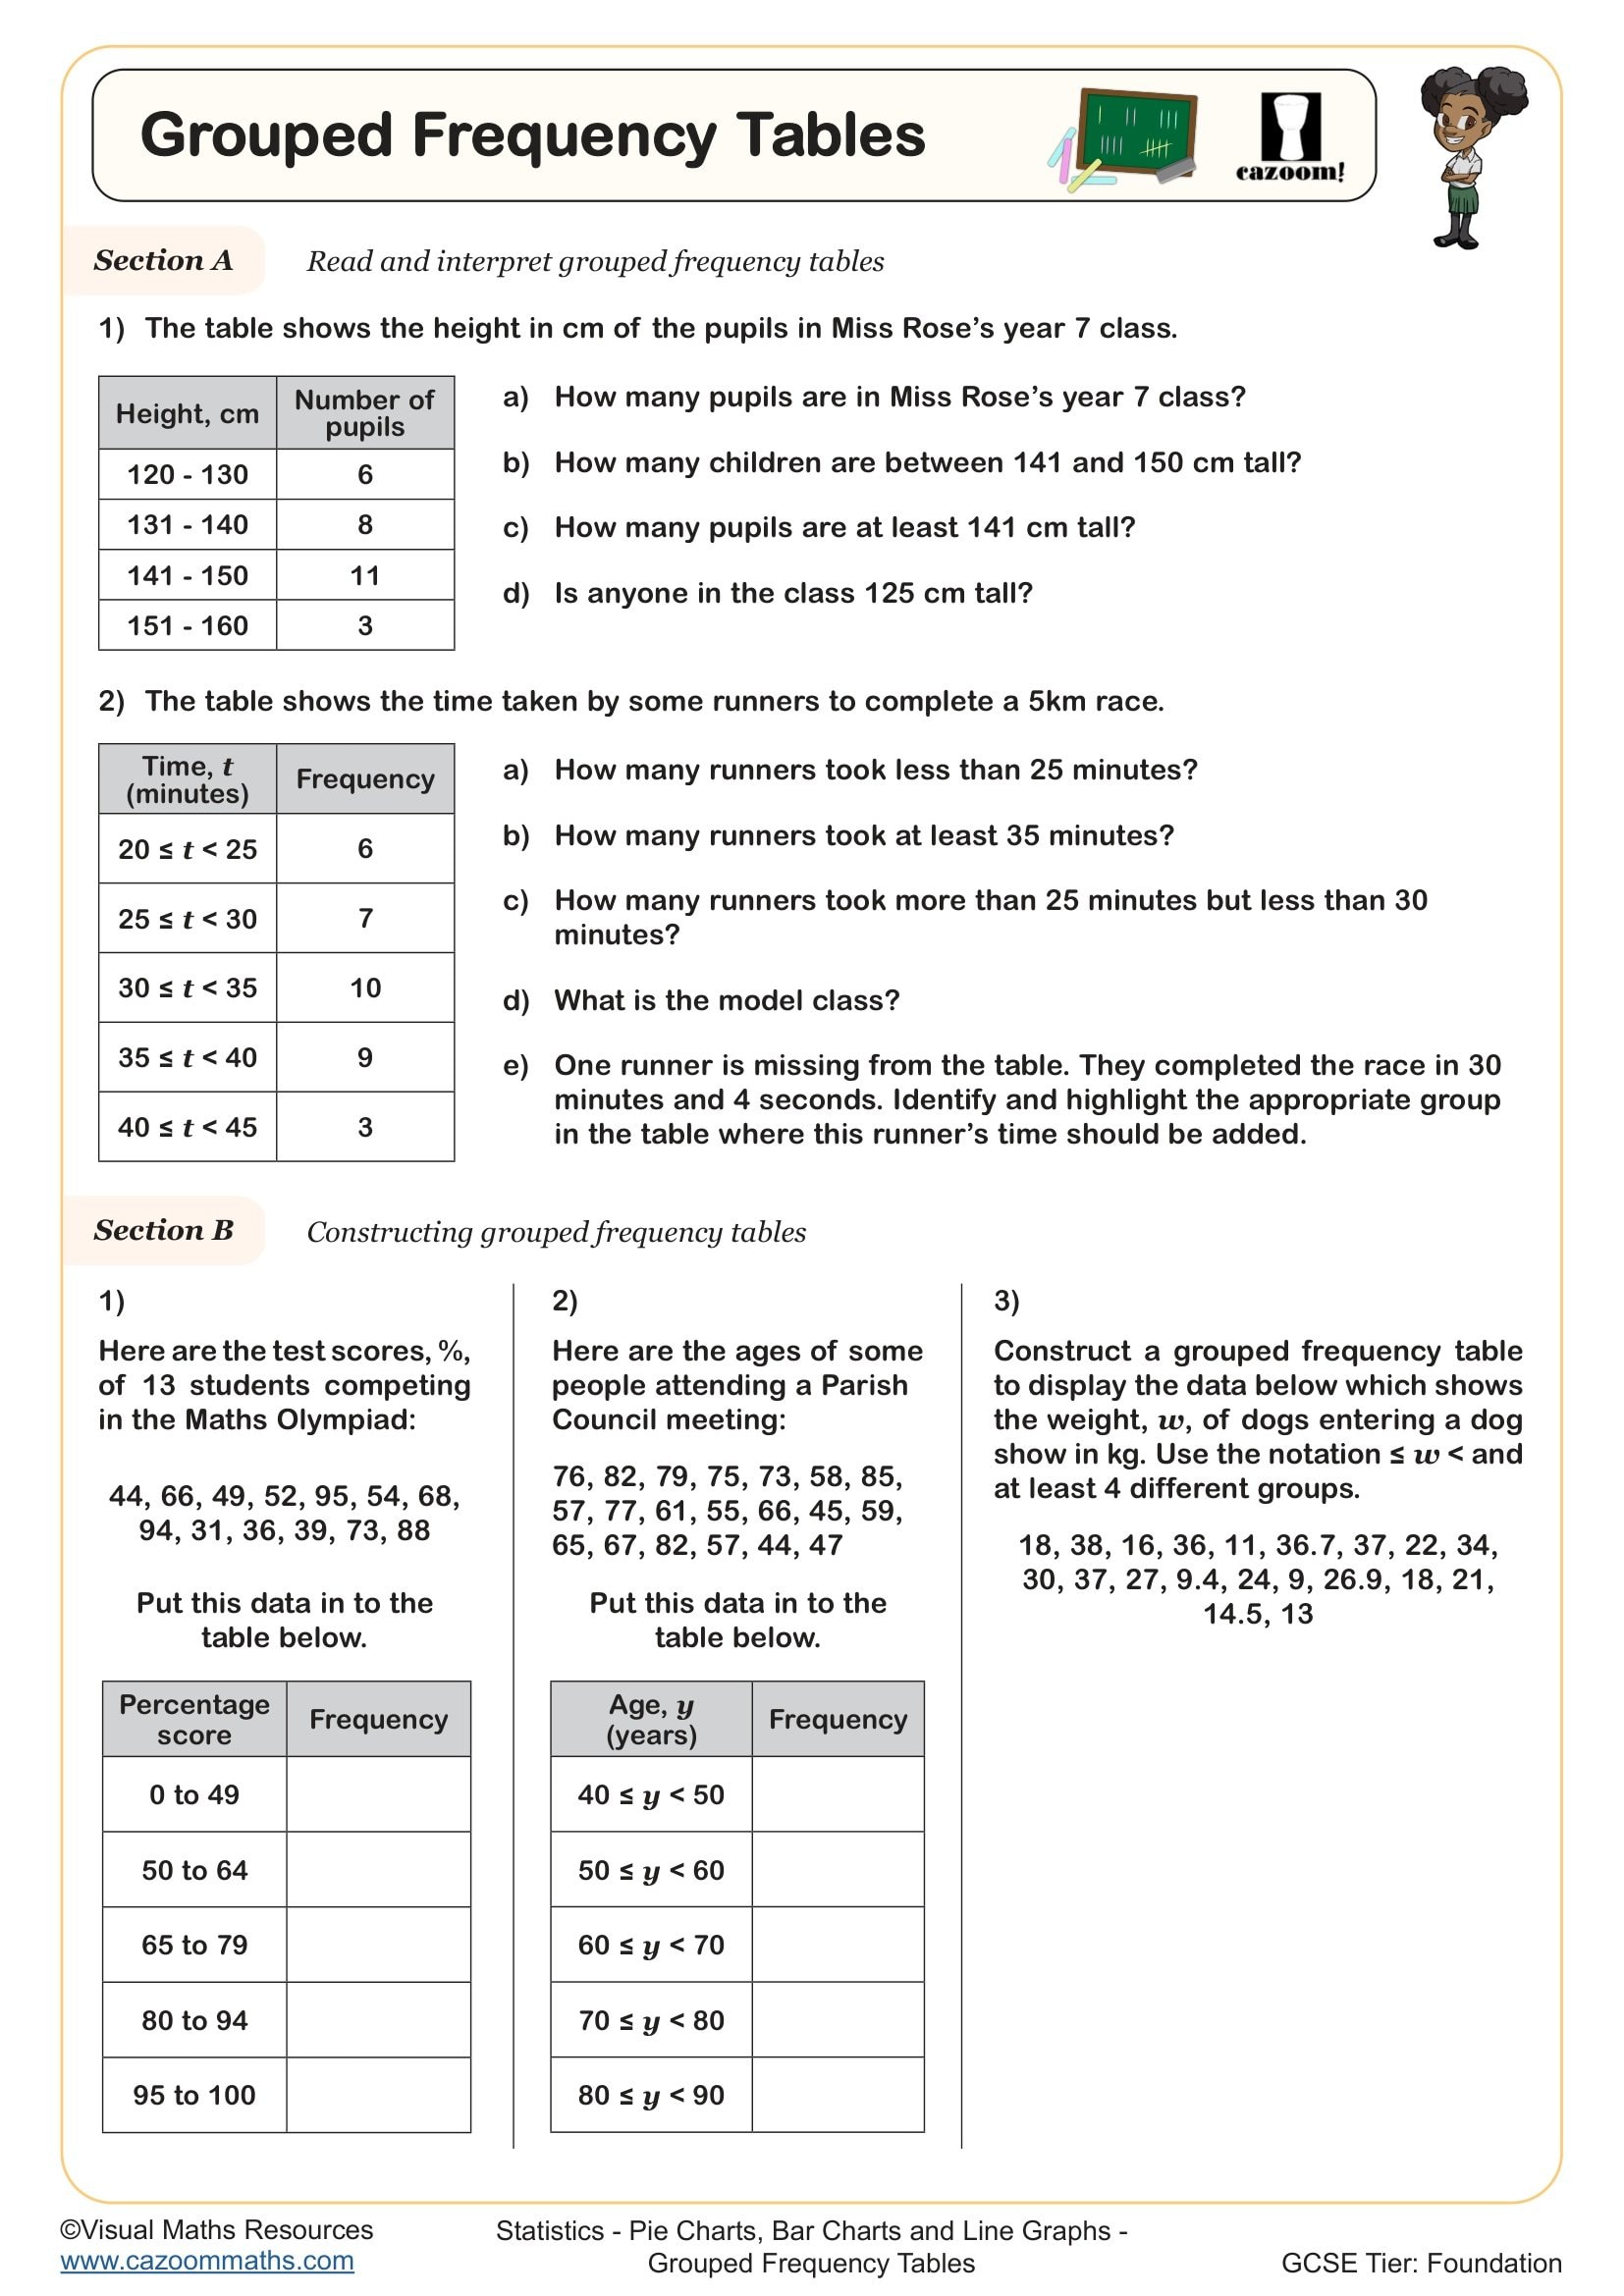
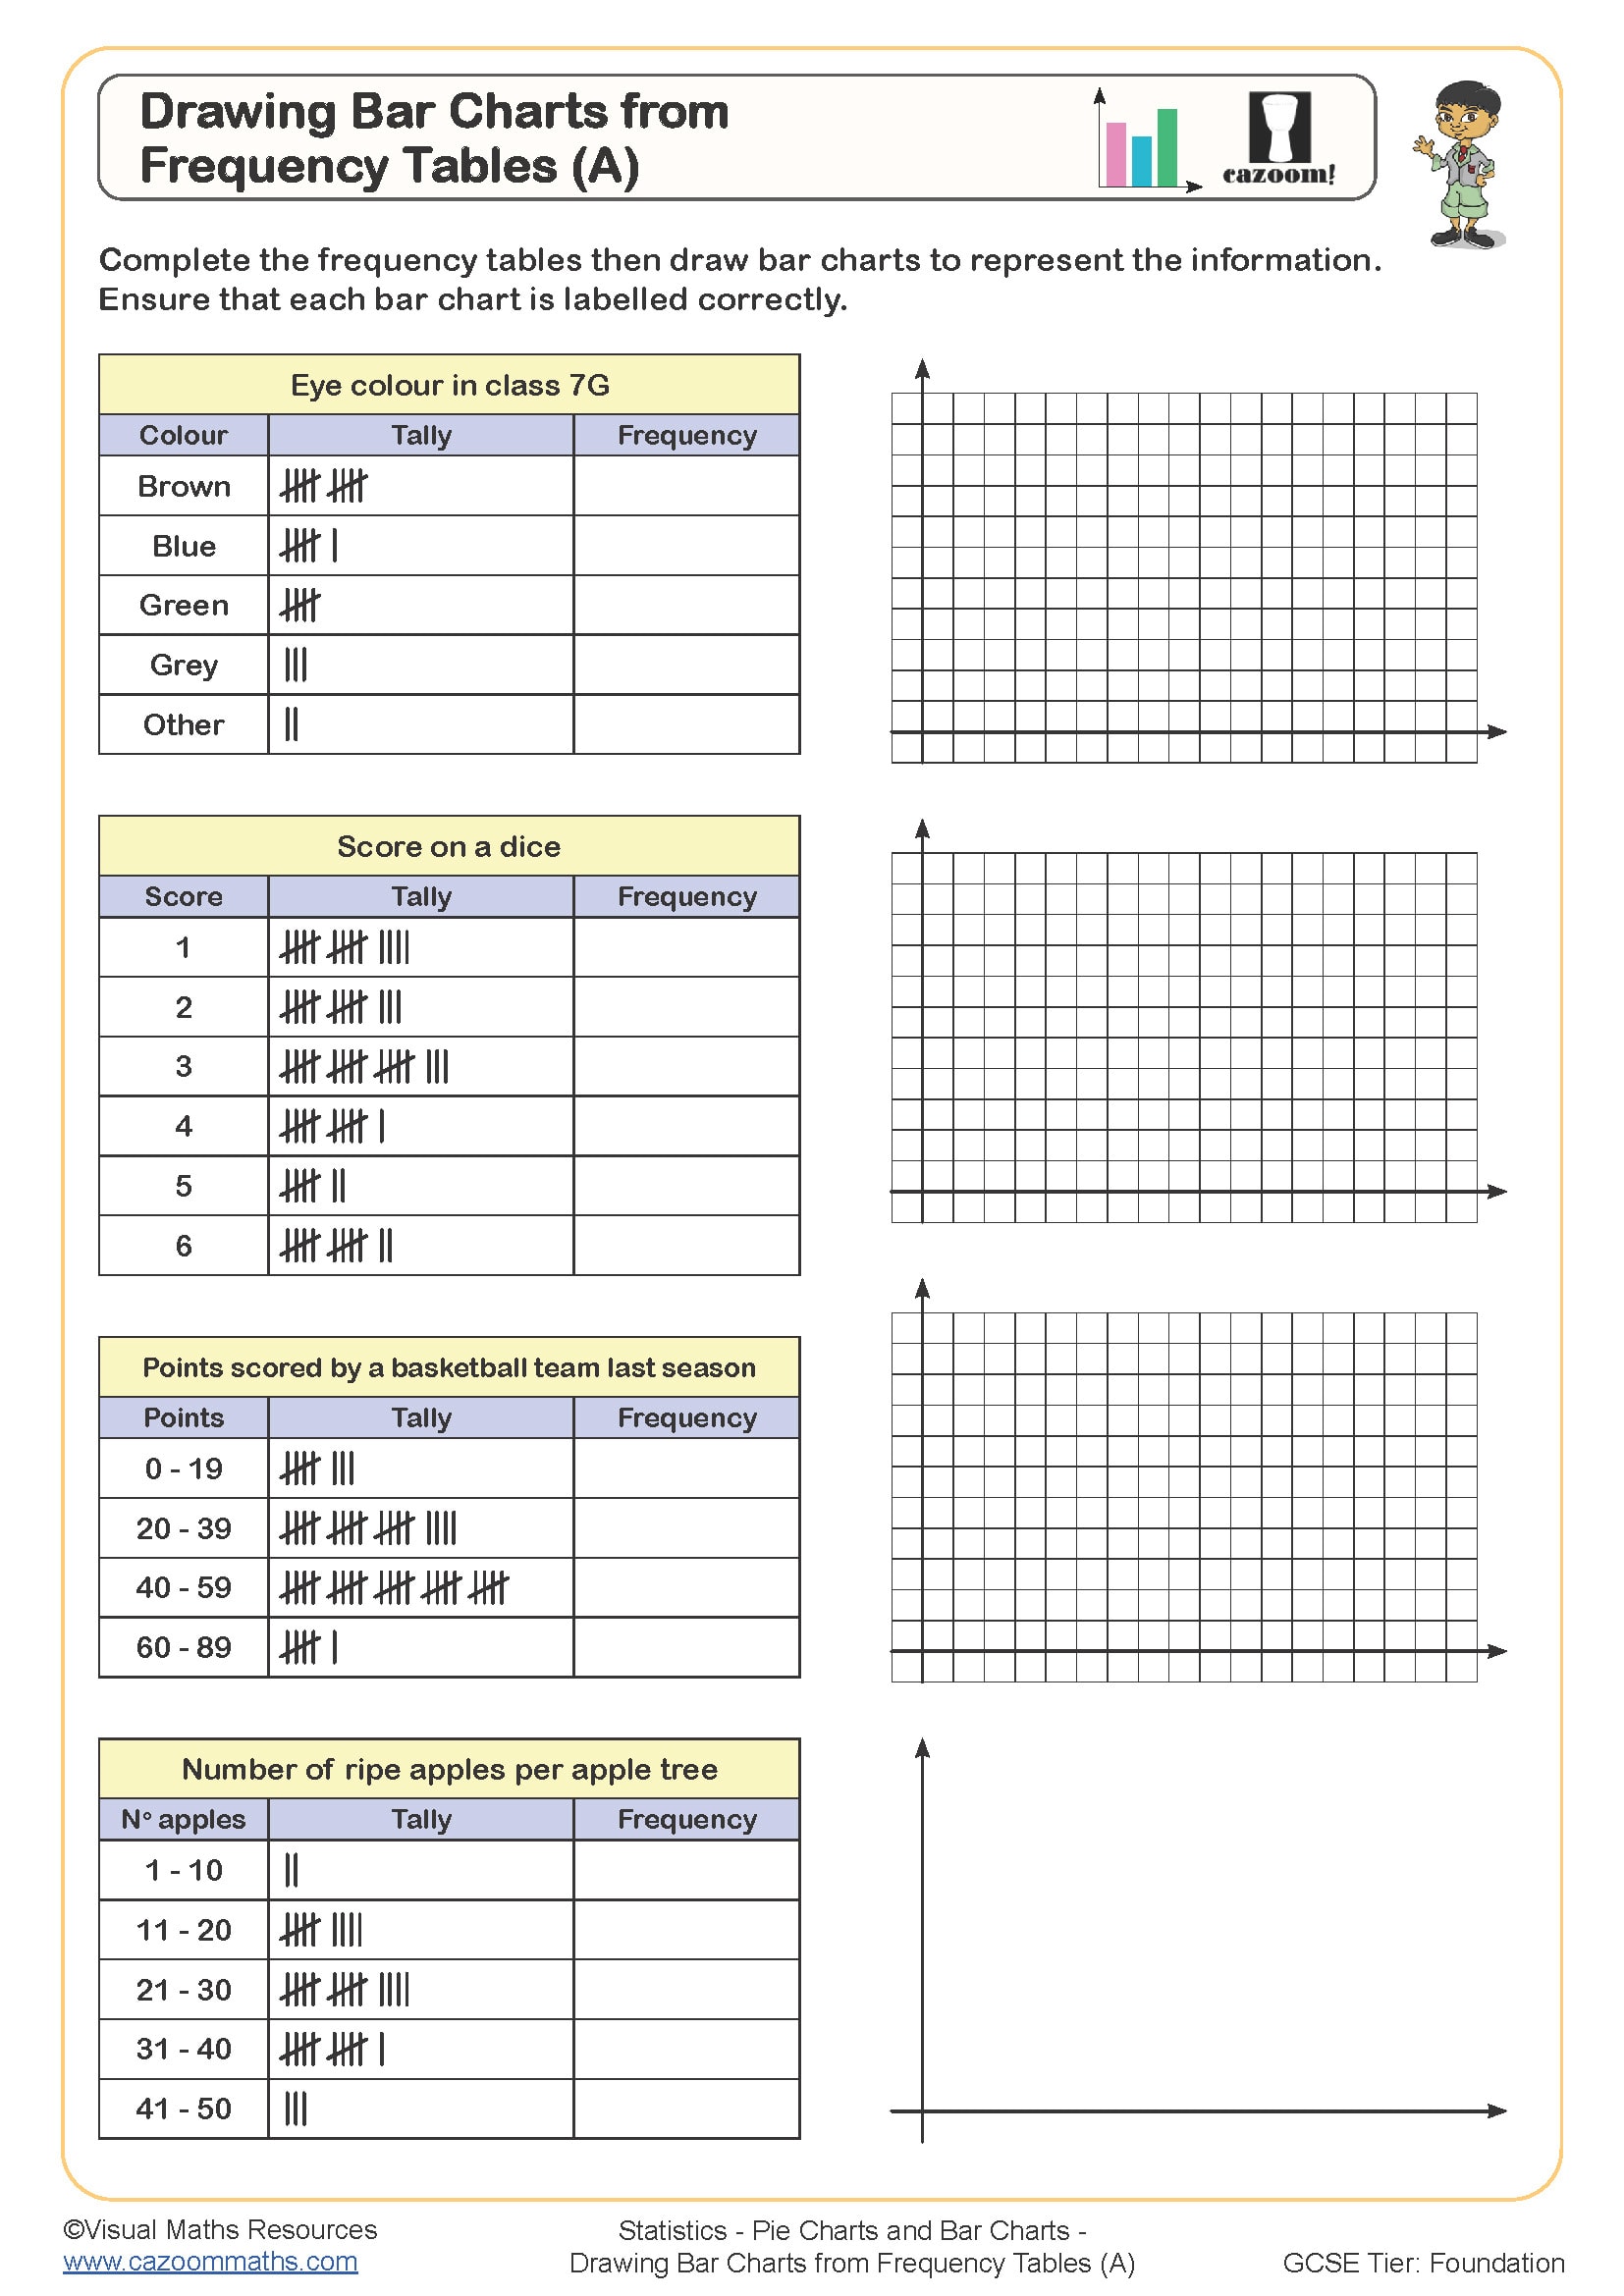
What is a Frequency Table?
A frequency table is commonly used for organizing data into categories. It shows how often each value or group of values appears in a statistical calculation. When the data is grouped, we must use midpoints to calculate the mean.
How to Find the Mean of a Frequency Table (Step-by-Step)
To find the Mean of a Frequency Table, we will use the mean formula. That is-
Mean=∑fx∑f\text{Mean} = \frac{\sum fx}{\sum f}Mean=∑f∑fx
Where:
- fff = frequency (number of occurrences)
- xxx = midpoint of each class interval
- fxfxfx = frequency multiplied by the midpoint
Example: Mean from a Grouped Frequency Table
For example, let’s imagine a teacher is recording the ages of students in a frequency table:
| Age Group | Frequency (f) |
| 8 - 10 | 12 |
| 11 - 13 | 25 |
| 14 - 16 | 37 |
| 17 - 19 | 14 |
Step 1: Find the Midpoints
The midpoint of each class can easily be calculated as:
Midpoint=Lower Bound+Upper Bound2\text{Midpoint} = \frac{\text{Lower Bound} + \text{Upper Bound}}{2}Midpoint=2Lower Bound+Upper Bound
| Age Group | Frequency (f) | Midpoint (x) |
| 8 - 10 | 12 | 9 |
| 11 - 13 | 25 | 12 |
| 14 - 16 | 37 | 15 |
| 17 - 19 | 14 | 18 |
Step 2: Multiply Frequency by Midpoint (fx)
Multiply each frequency by its corresponding midpoint.
| Age Group | Frequency (f) | Midpoint (x) | fx = f × x |
| 8 - 10 | 12 | 9 | 108 |
| 11 - 13 | 25 | 12 | 300 |
| 14 - 16 | 37 | 15 | 555 |
| 17 - 19 | 14 | 18 | 252 |
∑fx=1215\sum fx = 1215∑fx=1215
Step 3: Find the Total Frequency
Sum up all the frequencies:
12+25+37+14=8812 + 25 + 37 + 14 = 8812+25+37+14=88 ∑f=88\sum f = 88∑f=88
Step 4: Divide the Total fx by the Total Frequency
Using the mean formula:
Mean=∑fx∑f=121588=13.8\text{Mean} = \frac{\sum fx}{\sum f} = \frac{1215}{88} = 13.8Mean=∑f∑fx=881215=13.8
Final Answer: The mean age is 13.8 years.
Key Takeaways
Here are some key takeaways that you must remember-
- We must use midpoints when working with grouped frequency tables.
- We need to multiply frequency by midpoint, then sum the totals.
- It must be divided by the total frequency to get the mean.
All worksheets are created by the team of experienced teachers at Cazoom Maths.