The Line of Best Fit RESOURCE (FREE DOWNLOAD)
The Line of Best Fit RESOURCE DESCRIPTION
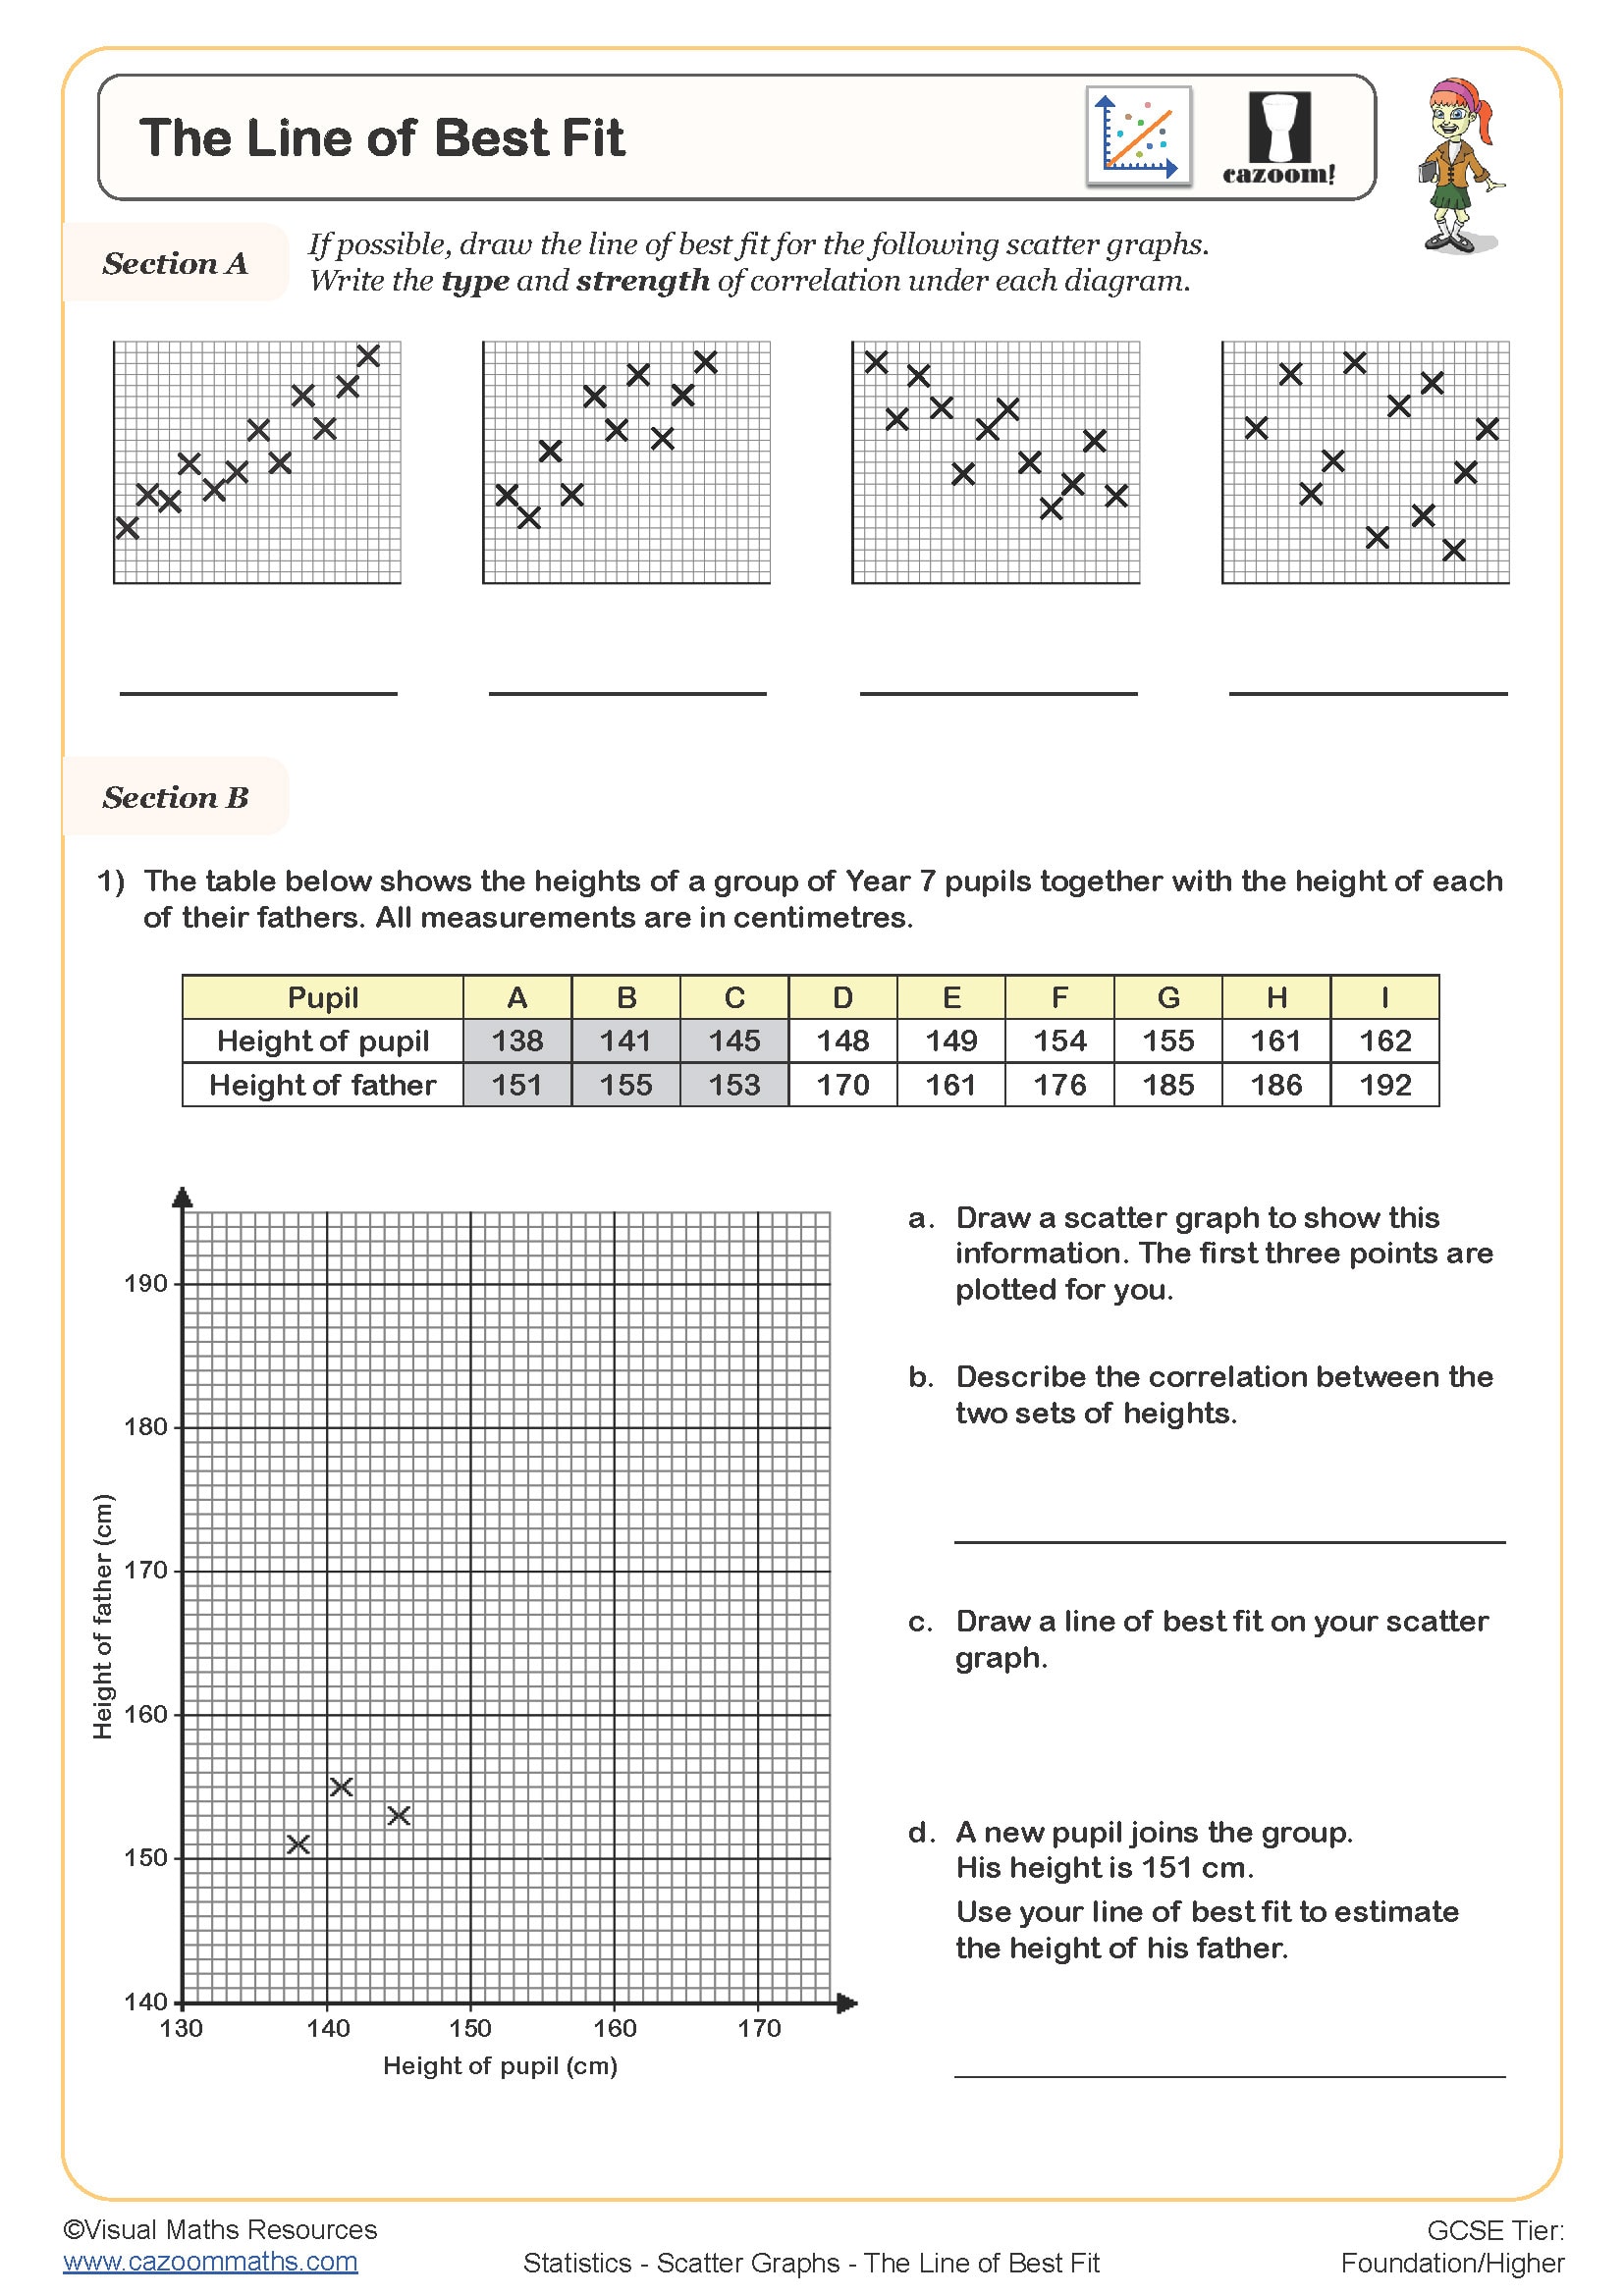
This pdf displays images and examples of different lines of best fit along with the type of correlation they show. Examples of where there is no correlation and no line of best fit can be drawn are also shown.
All worksheets are created by the team of experienced teachers at Cazoom Maths.

RELATED TO The Line of Best Fit
The Line of Best Fit
This resource focuses on the line of best fit, a tool used to represent trends in scatter plots and analyse the relationship between two variables.
Why are lines of best fit important?
Lines of best fit help us:
- Visualise trends: See the overall direction of a relationship in data.
- Estimates: Make predictions based on the observed pattern.
- Analyse strength: Assess how closely the data fits the linear trend.
How can this resource help?
This resource supports learning about lines of best fit:
- Explains the concept: Defines what a line of best fit represents.
- Visual examples: Uses scatter plots to illustrate how to draw them.
- Guides estimation: Shows how to use the line for predictions.
- Free PDF download: Offers an accessible reference tool.
Benefits for learners:
- Improves understanding of scatter plots and trend analysis.
- Develops skills in drawing and interpreting lines of best fit.
- Supports learning about linear relationships and predictions.
This resource is perfect for teachers introducing lines of best fit or providing revision support. It's also valuable for students needing extra practice or for parents helping with maths homework.
Also, have a look at our wide range of worksheets that are specifically curated to help your students practice their skills related to the line of best fit. These teaching resources and worksheets are in PDF format and can be downloaded easily.