Year 3 Statistics Worksheets
All worksheets are created by the team of experienced teachers at Cazoom Maths.
Year 3 Statistics Worksheets PDF Collection with Detailed Answer Keys
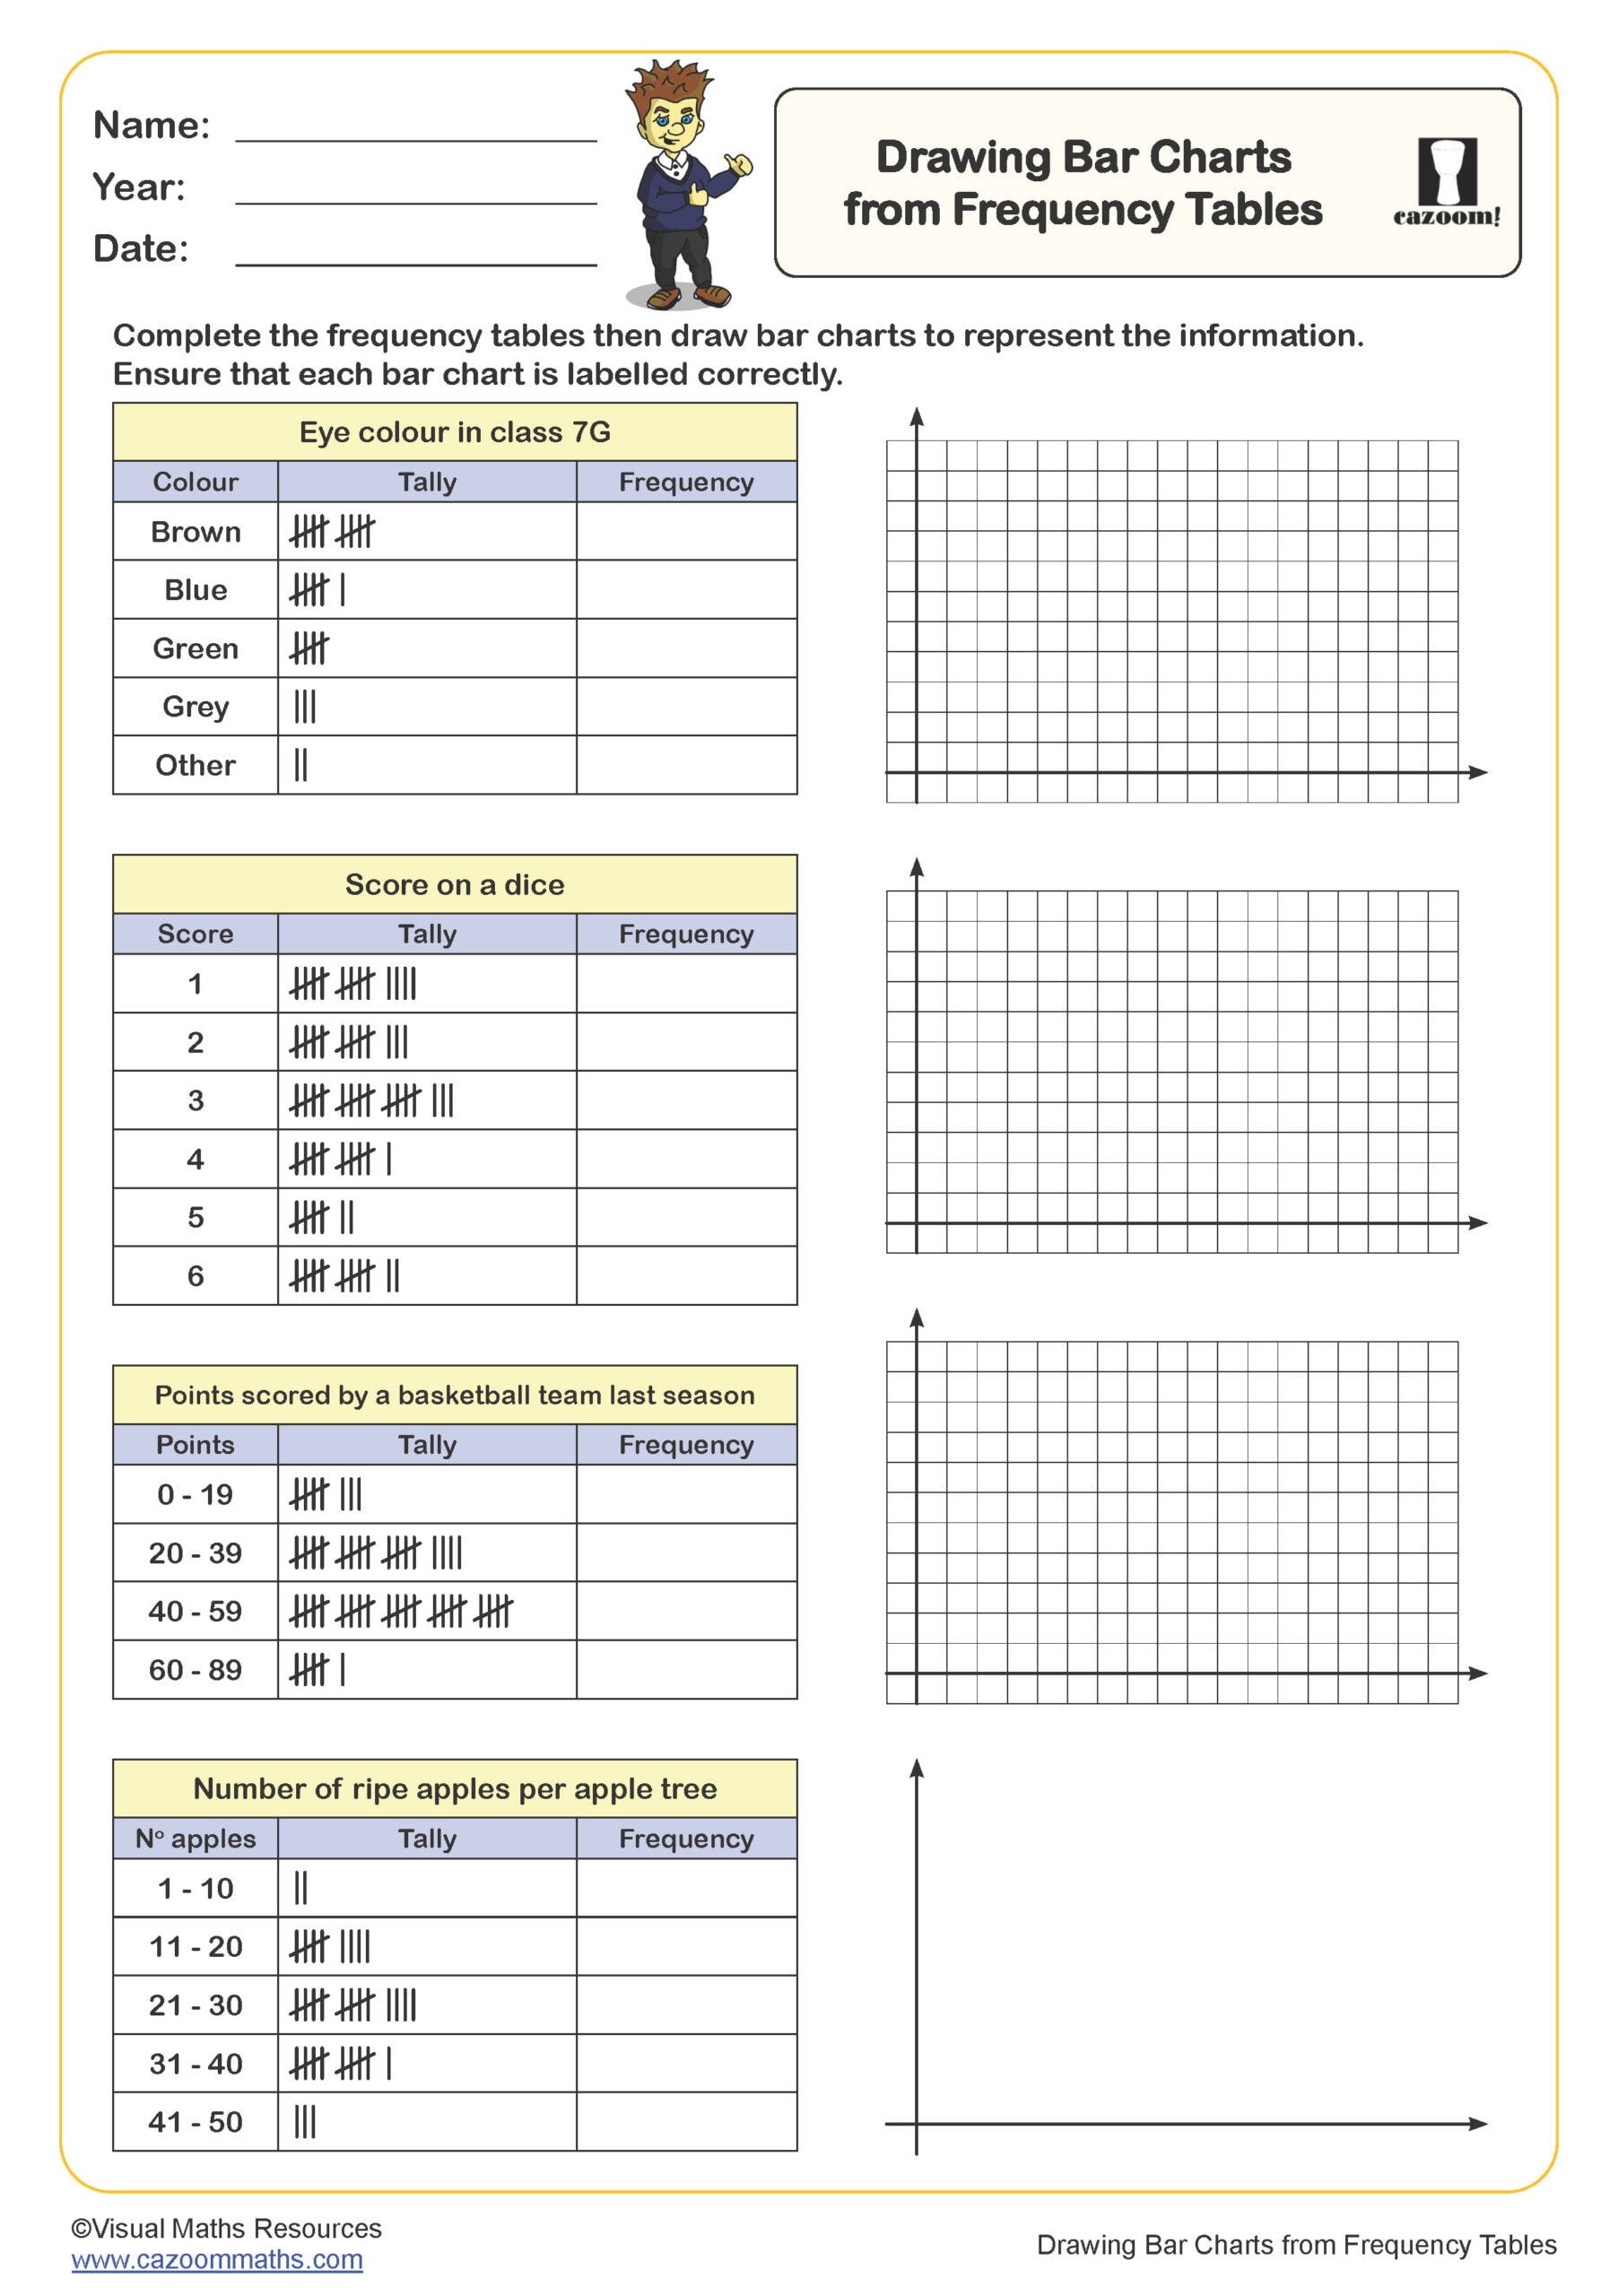
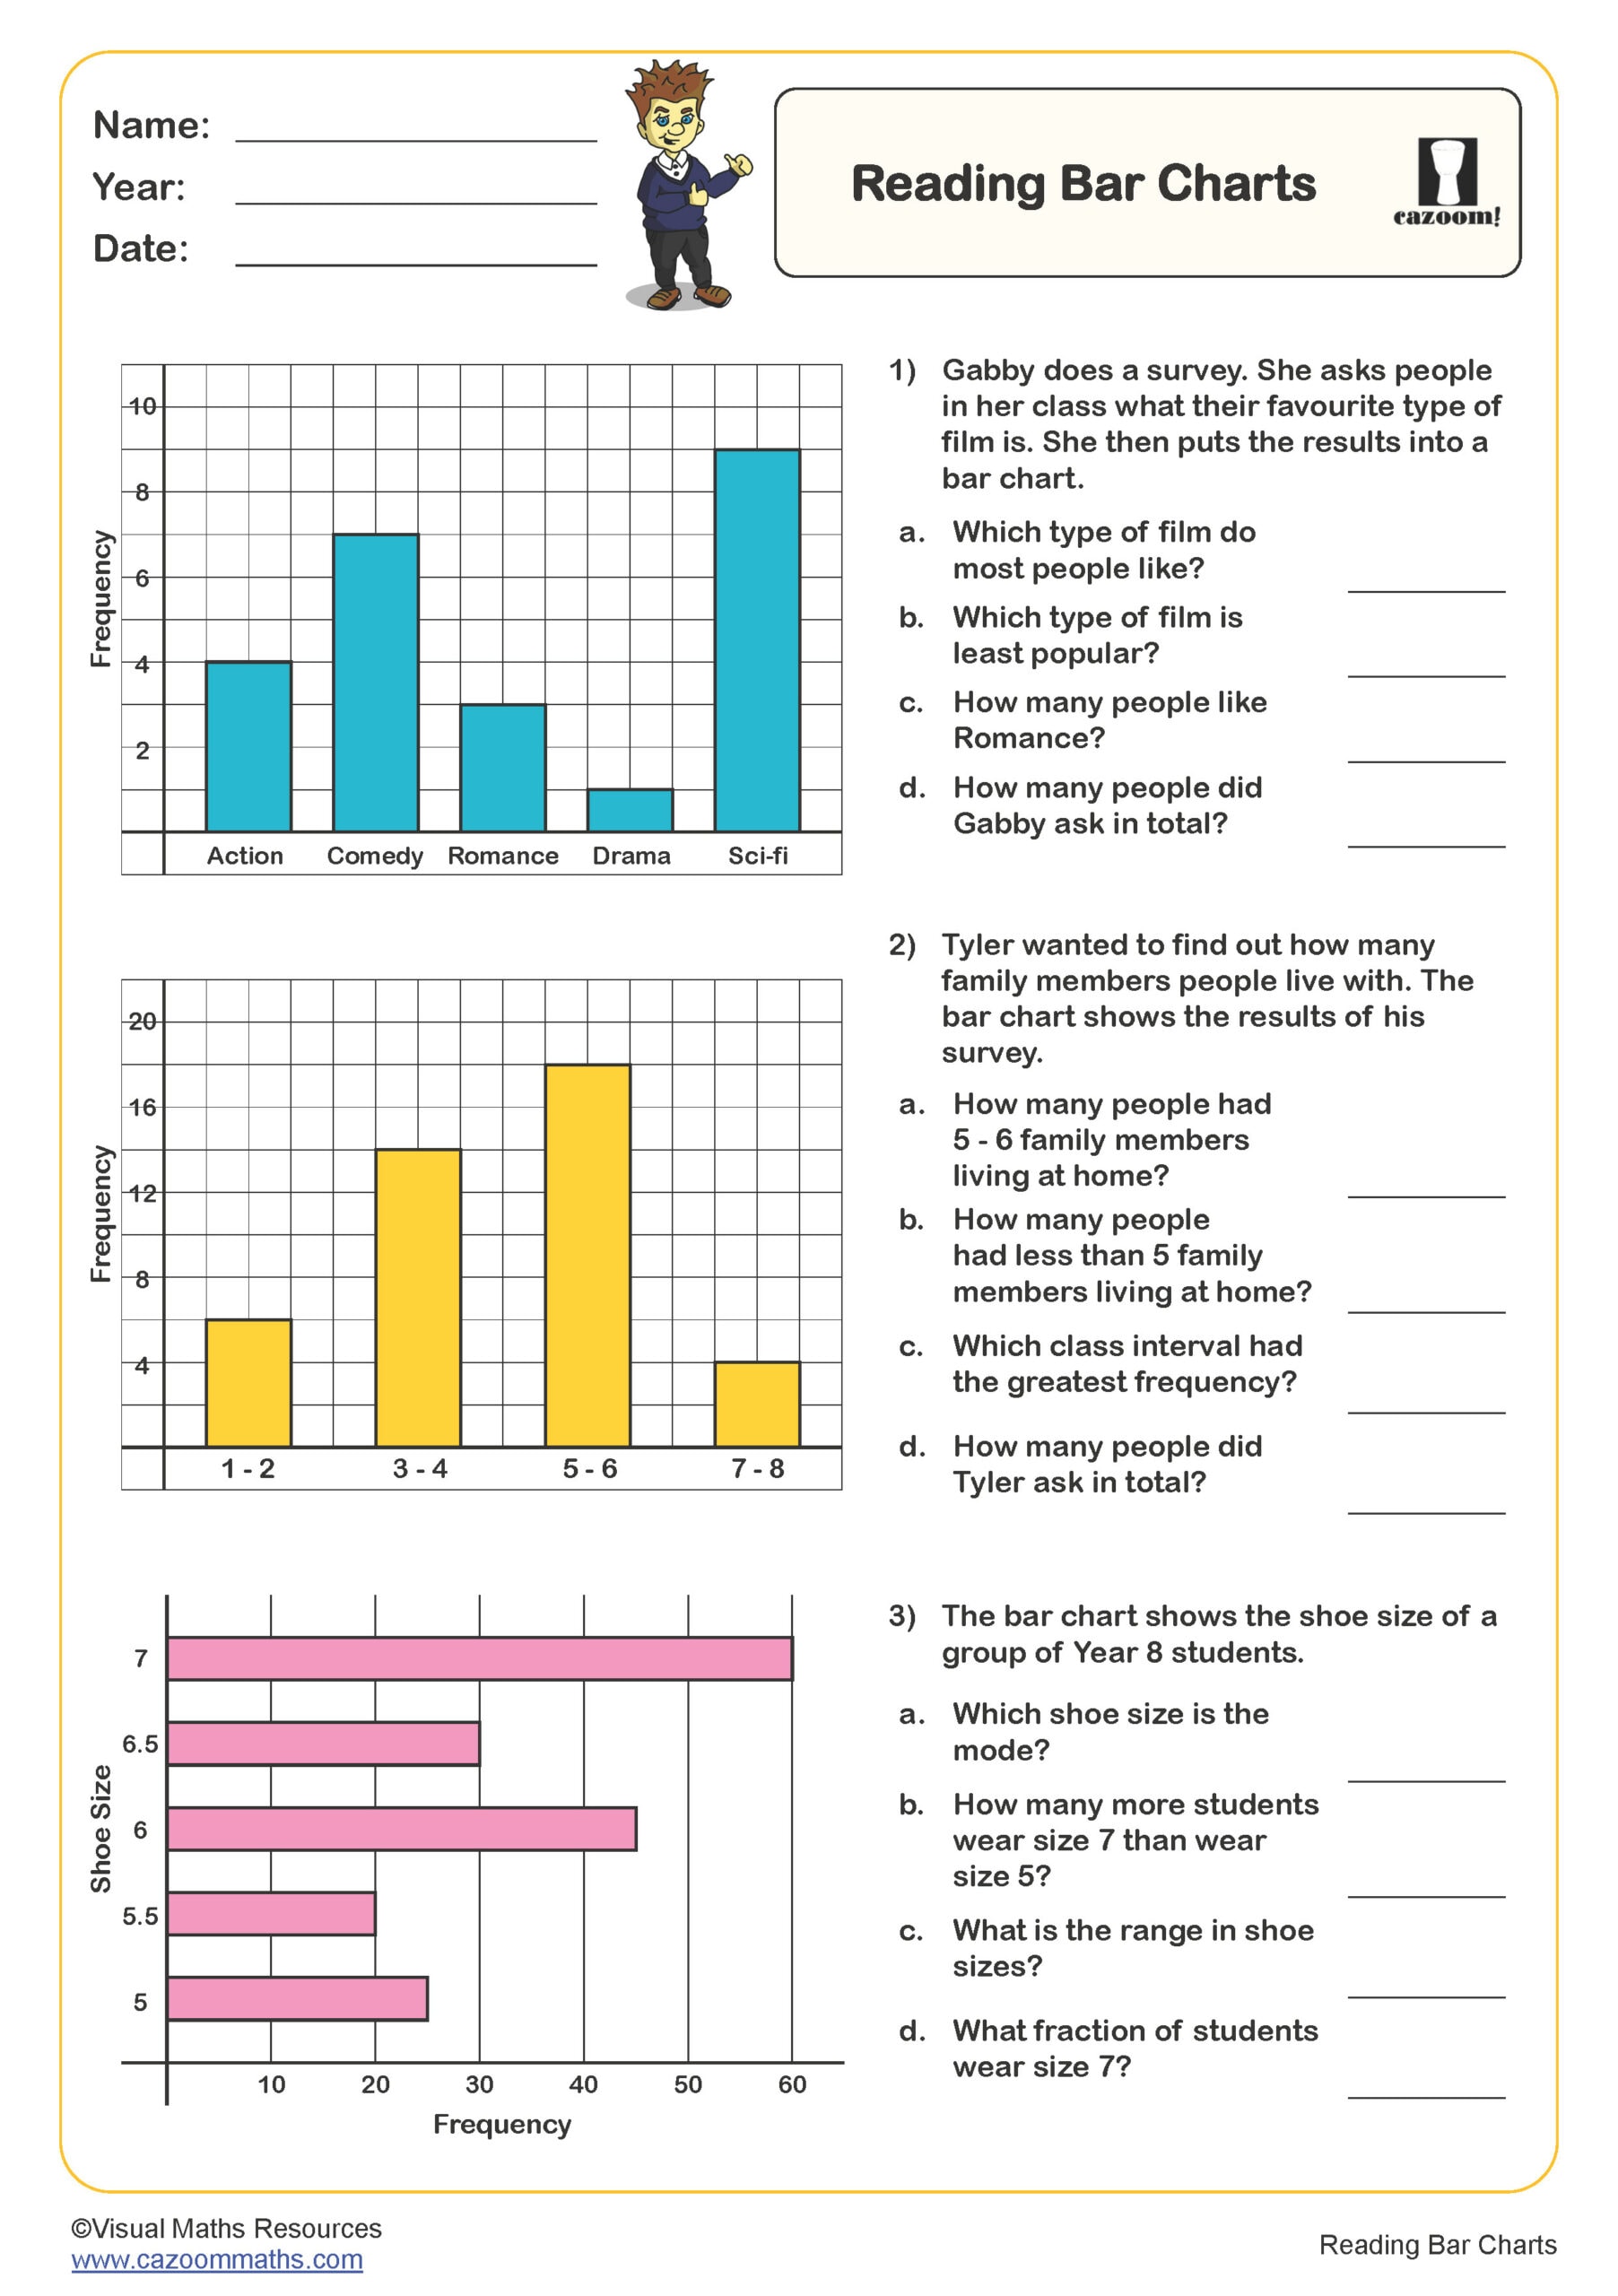
Finding statistics resources that actually challenge Year 3 minds without overwhelming them can be surprisingly tricky. Our printable PDF worksheets tackle this perfectly by introducing scaled pictograms, interpreting bar charts, and analysing two-way tables through contexts that genuinely interest children. Each worksheet comes with comprehensive marking schemes that explain not just the answers, but the reasoning process we want students to develop.
Which Data Handling Skills Do Year 3 Students Master?
Basic statistics is simply the art of collecting, organising, and making sense of numbers - it's how we turn messy data into useful information that helps us understand patterns and make better decisions. Think of it as the essential toolkit for answering questions like "What's typical?" or "How do these things compare?" using everything from simple averages to charts and graphs.
Cazoom Maths expert team has structured these activities to build genuine understanding rather than just procedural knowledge! Students start with reading simple bar charts before progressing to creating their own scaled representations. The progression through different chart types helps children recognise when each format works best. Plus, the problem-solving questions encourage that deeper thinking that separates confident mathematicians from those just following rules.
How Statistics Practice Transforms Year 3 Mathematical Confidence
Here's what we consistently observe: children who master data interpretation early become much more confident with mathematical reasoning throughout Key Stage 2. These worksheets directly support the National Curriculum objectives while preparing students for the increased complexity they'll encounter in Year 4. Regular practice with these skills creates a solid foundation for future statistical work.
Essential classroom benefits:
• Strengthens interpretation skills through varied chart formats
• Develops critical thinking about data representation choices
• Builds confidence in mathematical communication and explanation
• Supports cross-curricular connections with science and geography
• Provides excellent differentiation opportunities for mixed-ability classes
Real-World Statistics: Where Year 3 Students Use Data Skills Daily
Data appears in their science experiments, geography projects, and even when they're comparing football statistics or planning school events. These worksheets help children recognise that statistics isn't just a maths topic; it's a life skill that helps them make sense of the world around them.
Practical applications they'll encounter:
• Interpreting weather data and temperature graphs in geography lessons
• Analysing results from science investigations and experiments
• Understanding sports statistics and league tables in PE
• Evaluating survey results for student council elections
• Reading nutrition information and making healthy food choices
• Comparing data in history topics like population changes over time

