Year 4 Statistics Worksheets
All worksheets are created by the team of experienced teachers at Cazoom Maths.
Year 4 Maths Statistics Worksheets - Printable Data Handling Activities
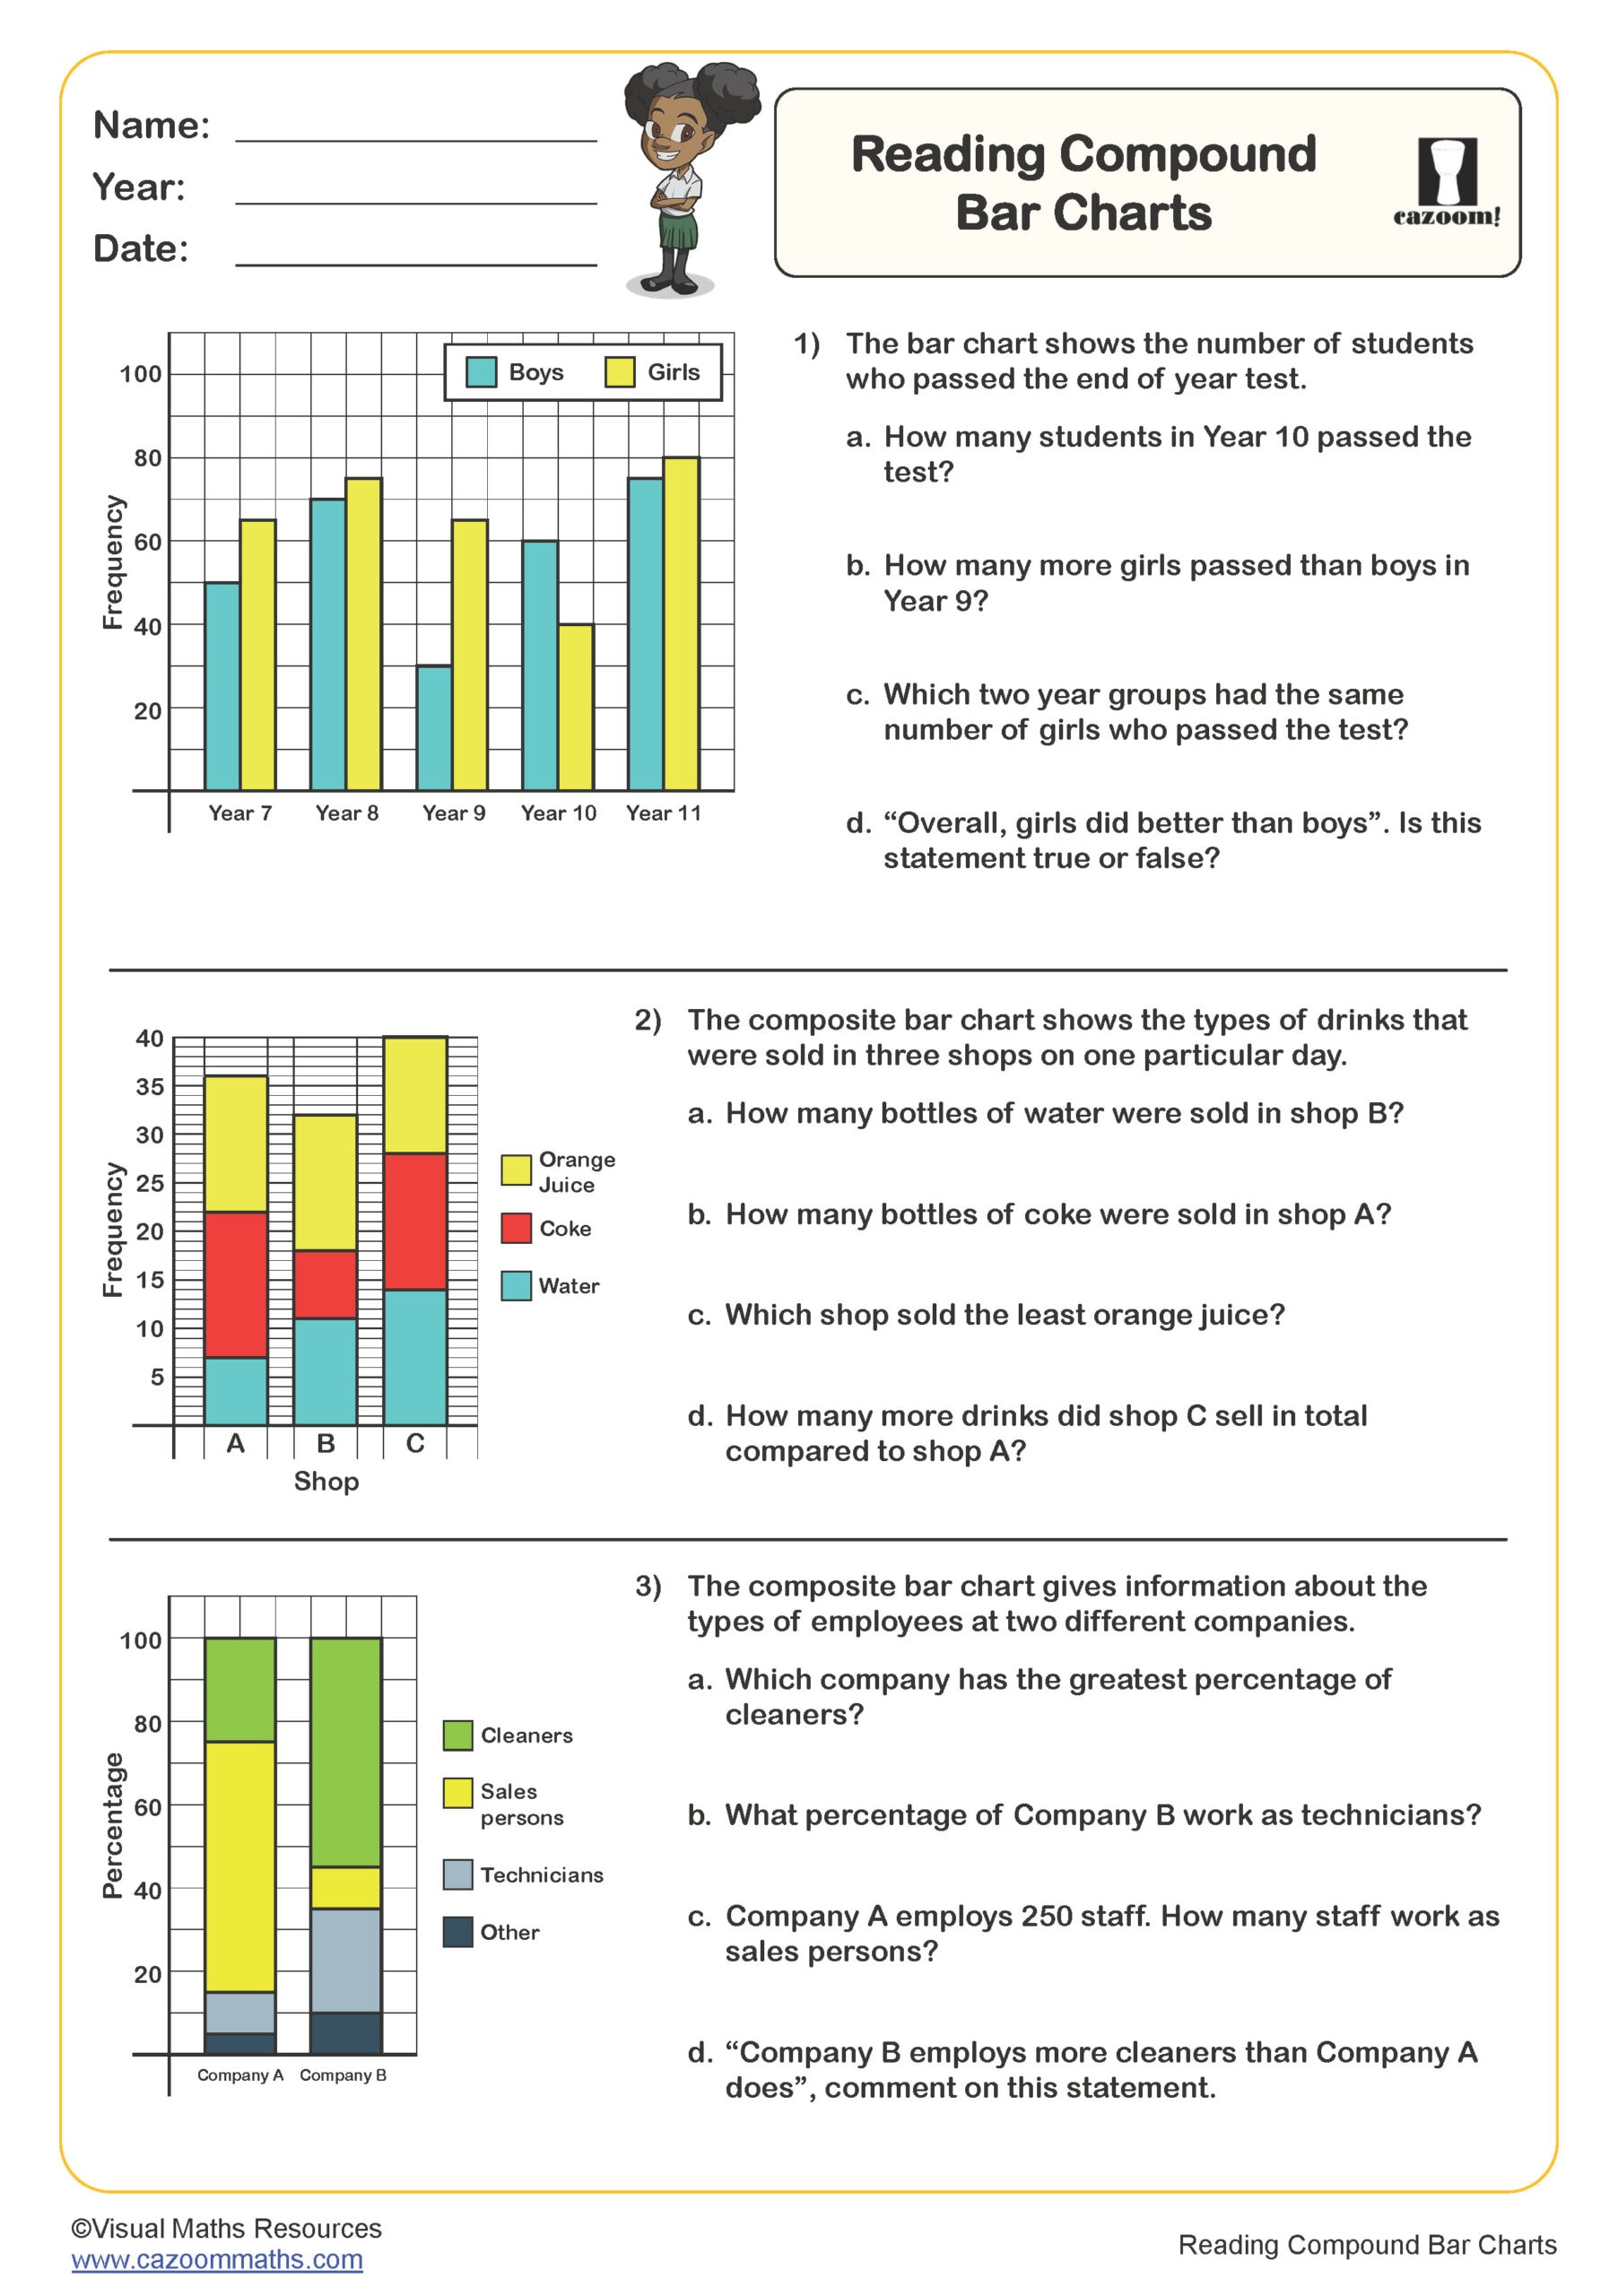
Finding statistics resources that actually challenge Year 4 minds without overwhelming them can be surprisingly tricky. Our printable PDF worksheets tackle this perfectly by introducing concepts like scaled pictograms, interpreting bar charts, and analysing two-way tables through contexts that genuinely interest children. Each worksheet comes with comprehensive marking schemes that explain not just the answers, but the reasoning process we want students to develop.
Statistics Activities Covered in Year 4 Data Handling Worksheets
Basic statistics is simply the art of collecting, organising, and making sense of numbers - it's how we turn messy data into useful information that helps us understand patterns and make better decisions. Think of it as the essential toolkit for answering questions like "What's typical?" or "How do these things compare?" using everything from simple averages to charts and graphs.
Cazoom Maths expert team has structured these activities to build genuine understanding rather than just procedural knowledge! Students start with reading simple bar charts before progressing to creating their own scaled representations. The progression through different chart types helps children recognise when each format works best. Plus, the problem-solving questions encourage that deeper thinking that separates confident mathematicians from those just following rules.
Why Year 4 Maths Students Need Statistics Worksheet Practice
Our primary school statistics worksheets bridge that crucial gap between basic number work and advanced mathematical reasoning that Year 4 students need for KS2 success. The variety of question types ensures students are ready for any statistics challenge they'll face.
• Build confidence in reading and interpreting different types of graphs and charts
• Develop critical thinking through comparison and analysis questions
• Master essential KS2 skills required for end-of-year assessments
• Strengthen mathematical vocabulary specific to data handling and statistics
• Practice real exam-style questions that mirror the SAT's format and expectations
Data Handling Skills: Real-World Statistics Applications for Year 4
These data handling skills connect directly to science investigations, geography fieldwork, and even PE when recording sports results. We've seen students become genuinely excited when they realise they're using the same skills as weather forecasters, sports analysts, and market researchers. It's actually quite satisfying when that lightbulb moment happens!
• Science experiments - recording and presenting investigation results using appropriate graphs
• Geography studies - interpreting climate data, population statistics, and environmental surveys
• PE and sports - tracking team performance, recording personal bests, and analysing game statistics
• History research - understanding historical data through timelines and population charts
• Art and design - using data to inform creative decisions and pattern recognition
• Daily life skills - reading train timetables, understanding weather forecasts, and comparing shopping comparisons
