Correlation and Causation WORKSHEET
Correlation and Causation WORKSHEET DESCRIPTION
This worksheet supports students in understanding the distinction between correlation and causation through a series of structured tasks.
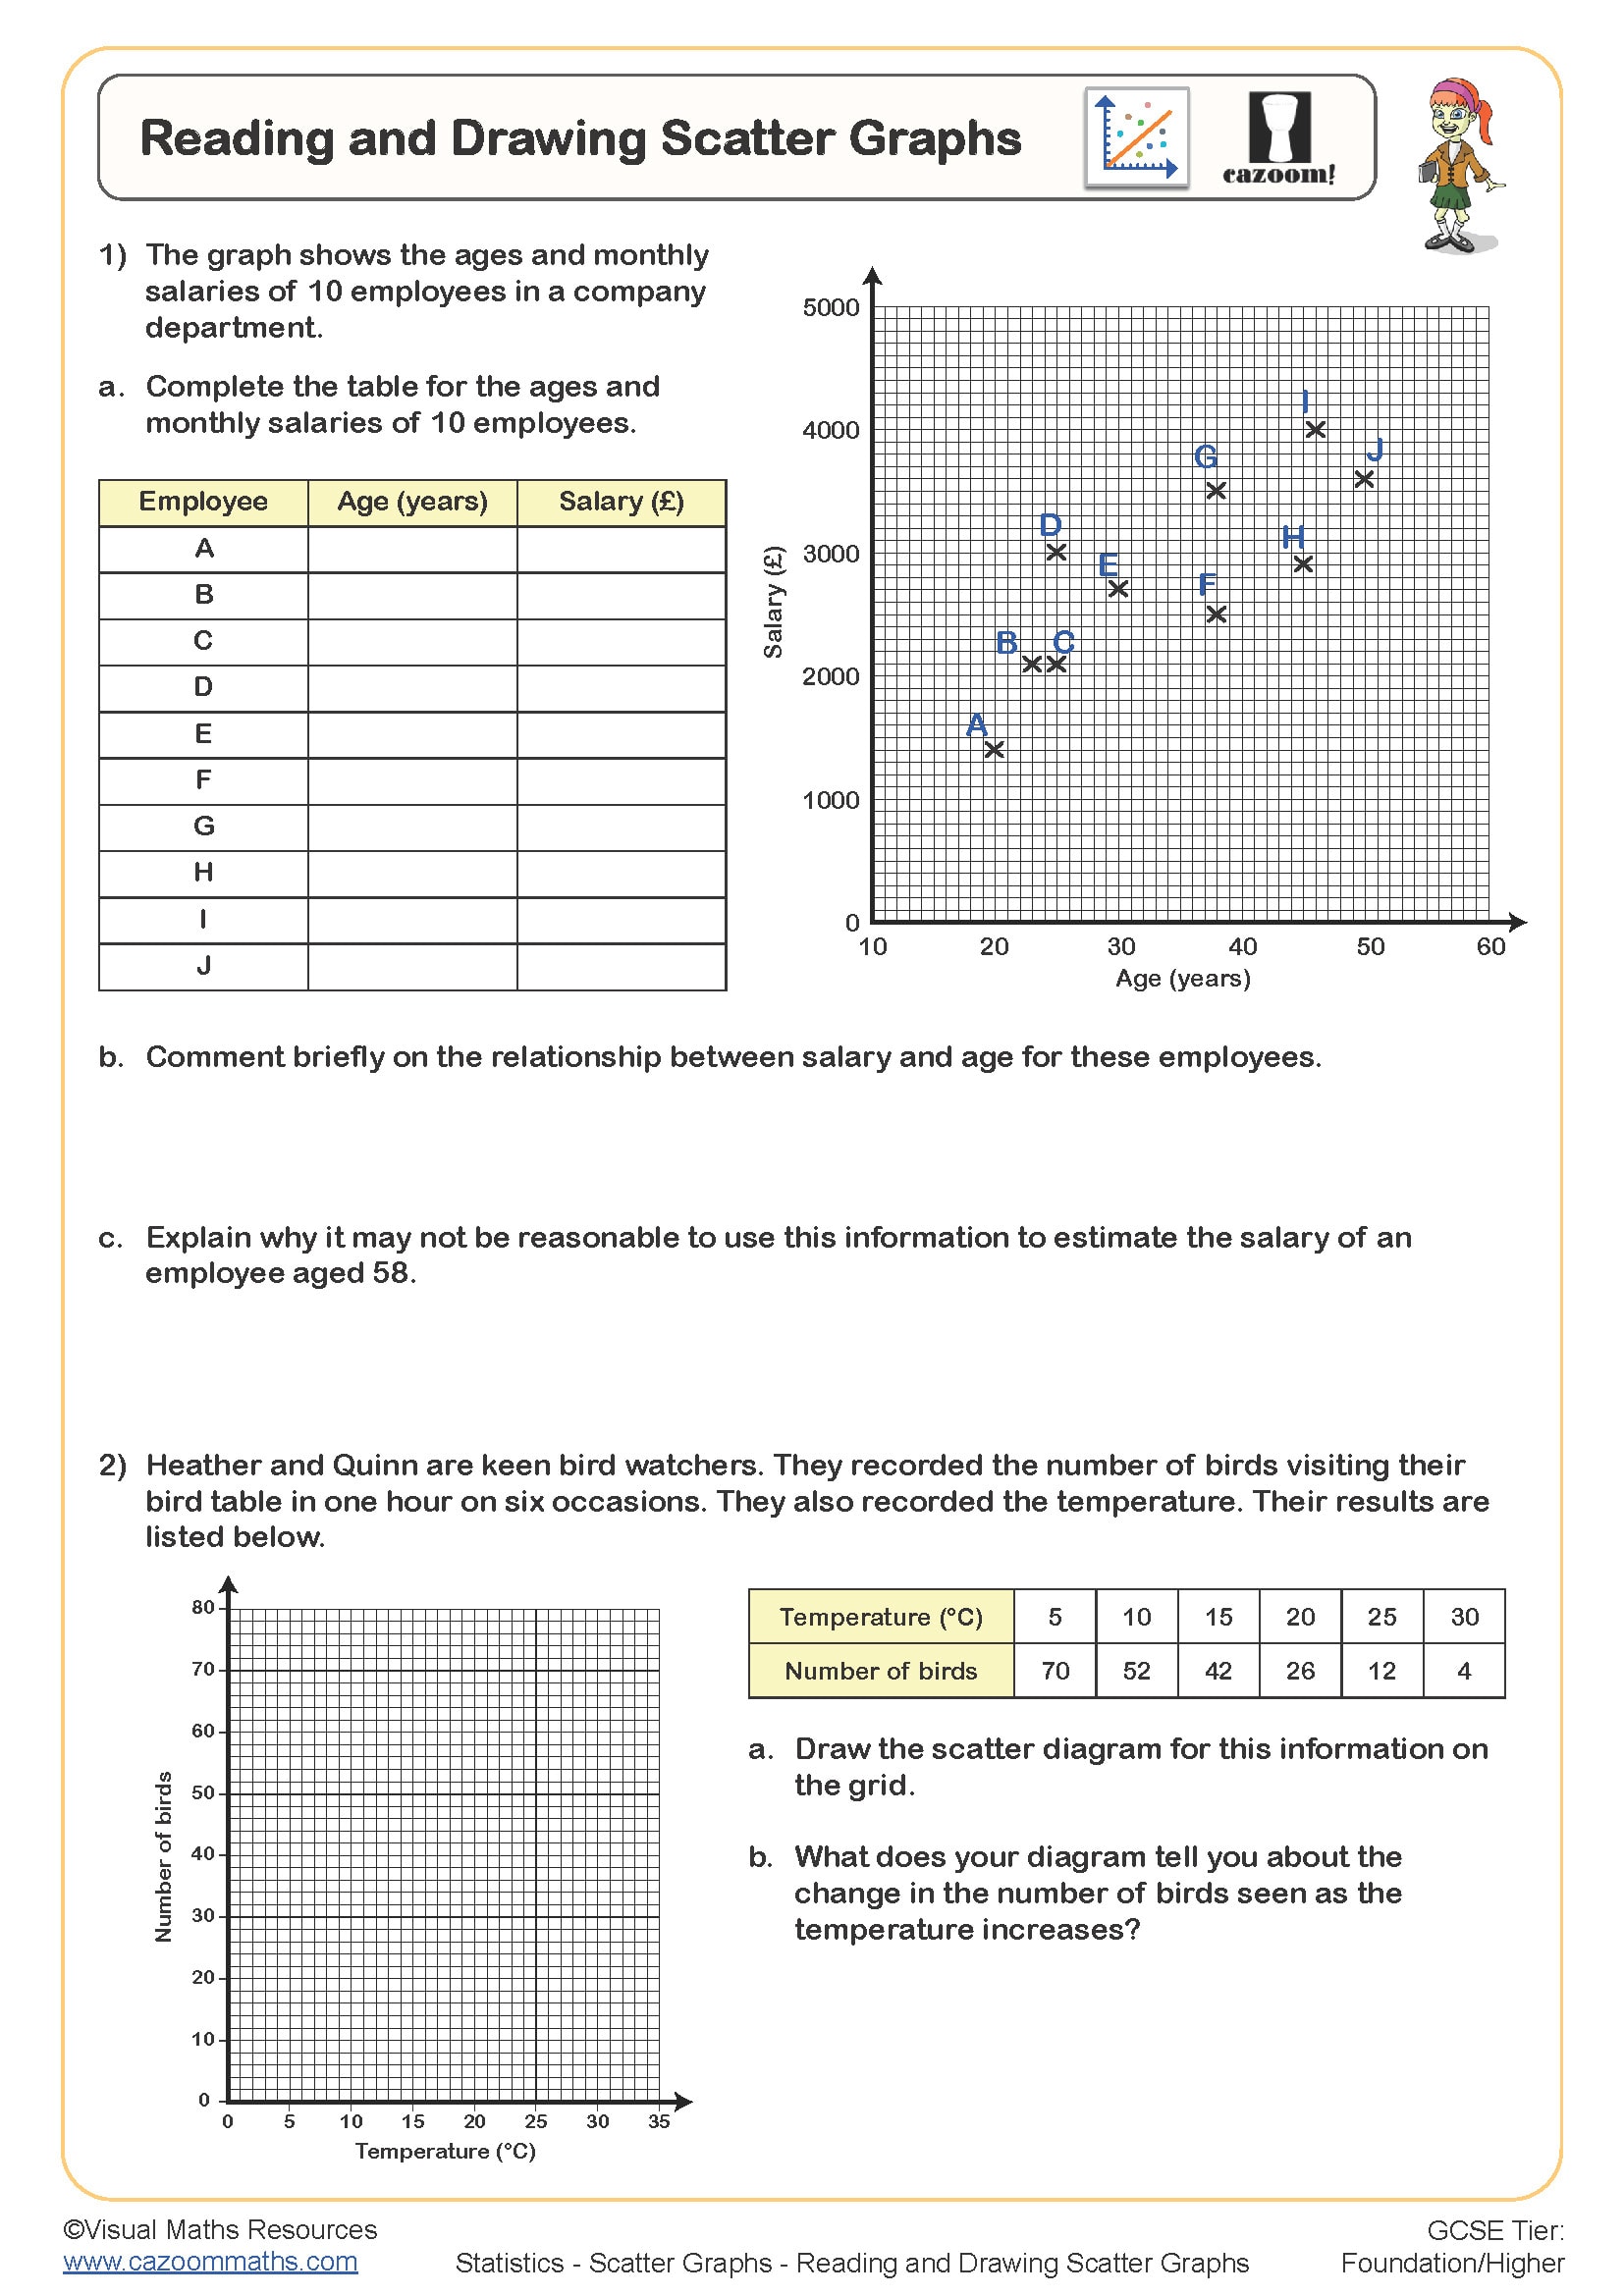
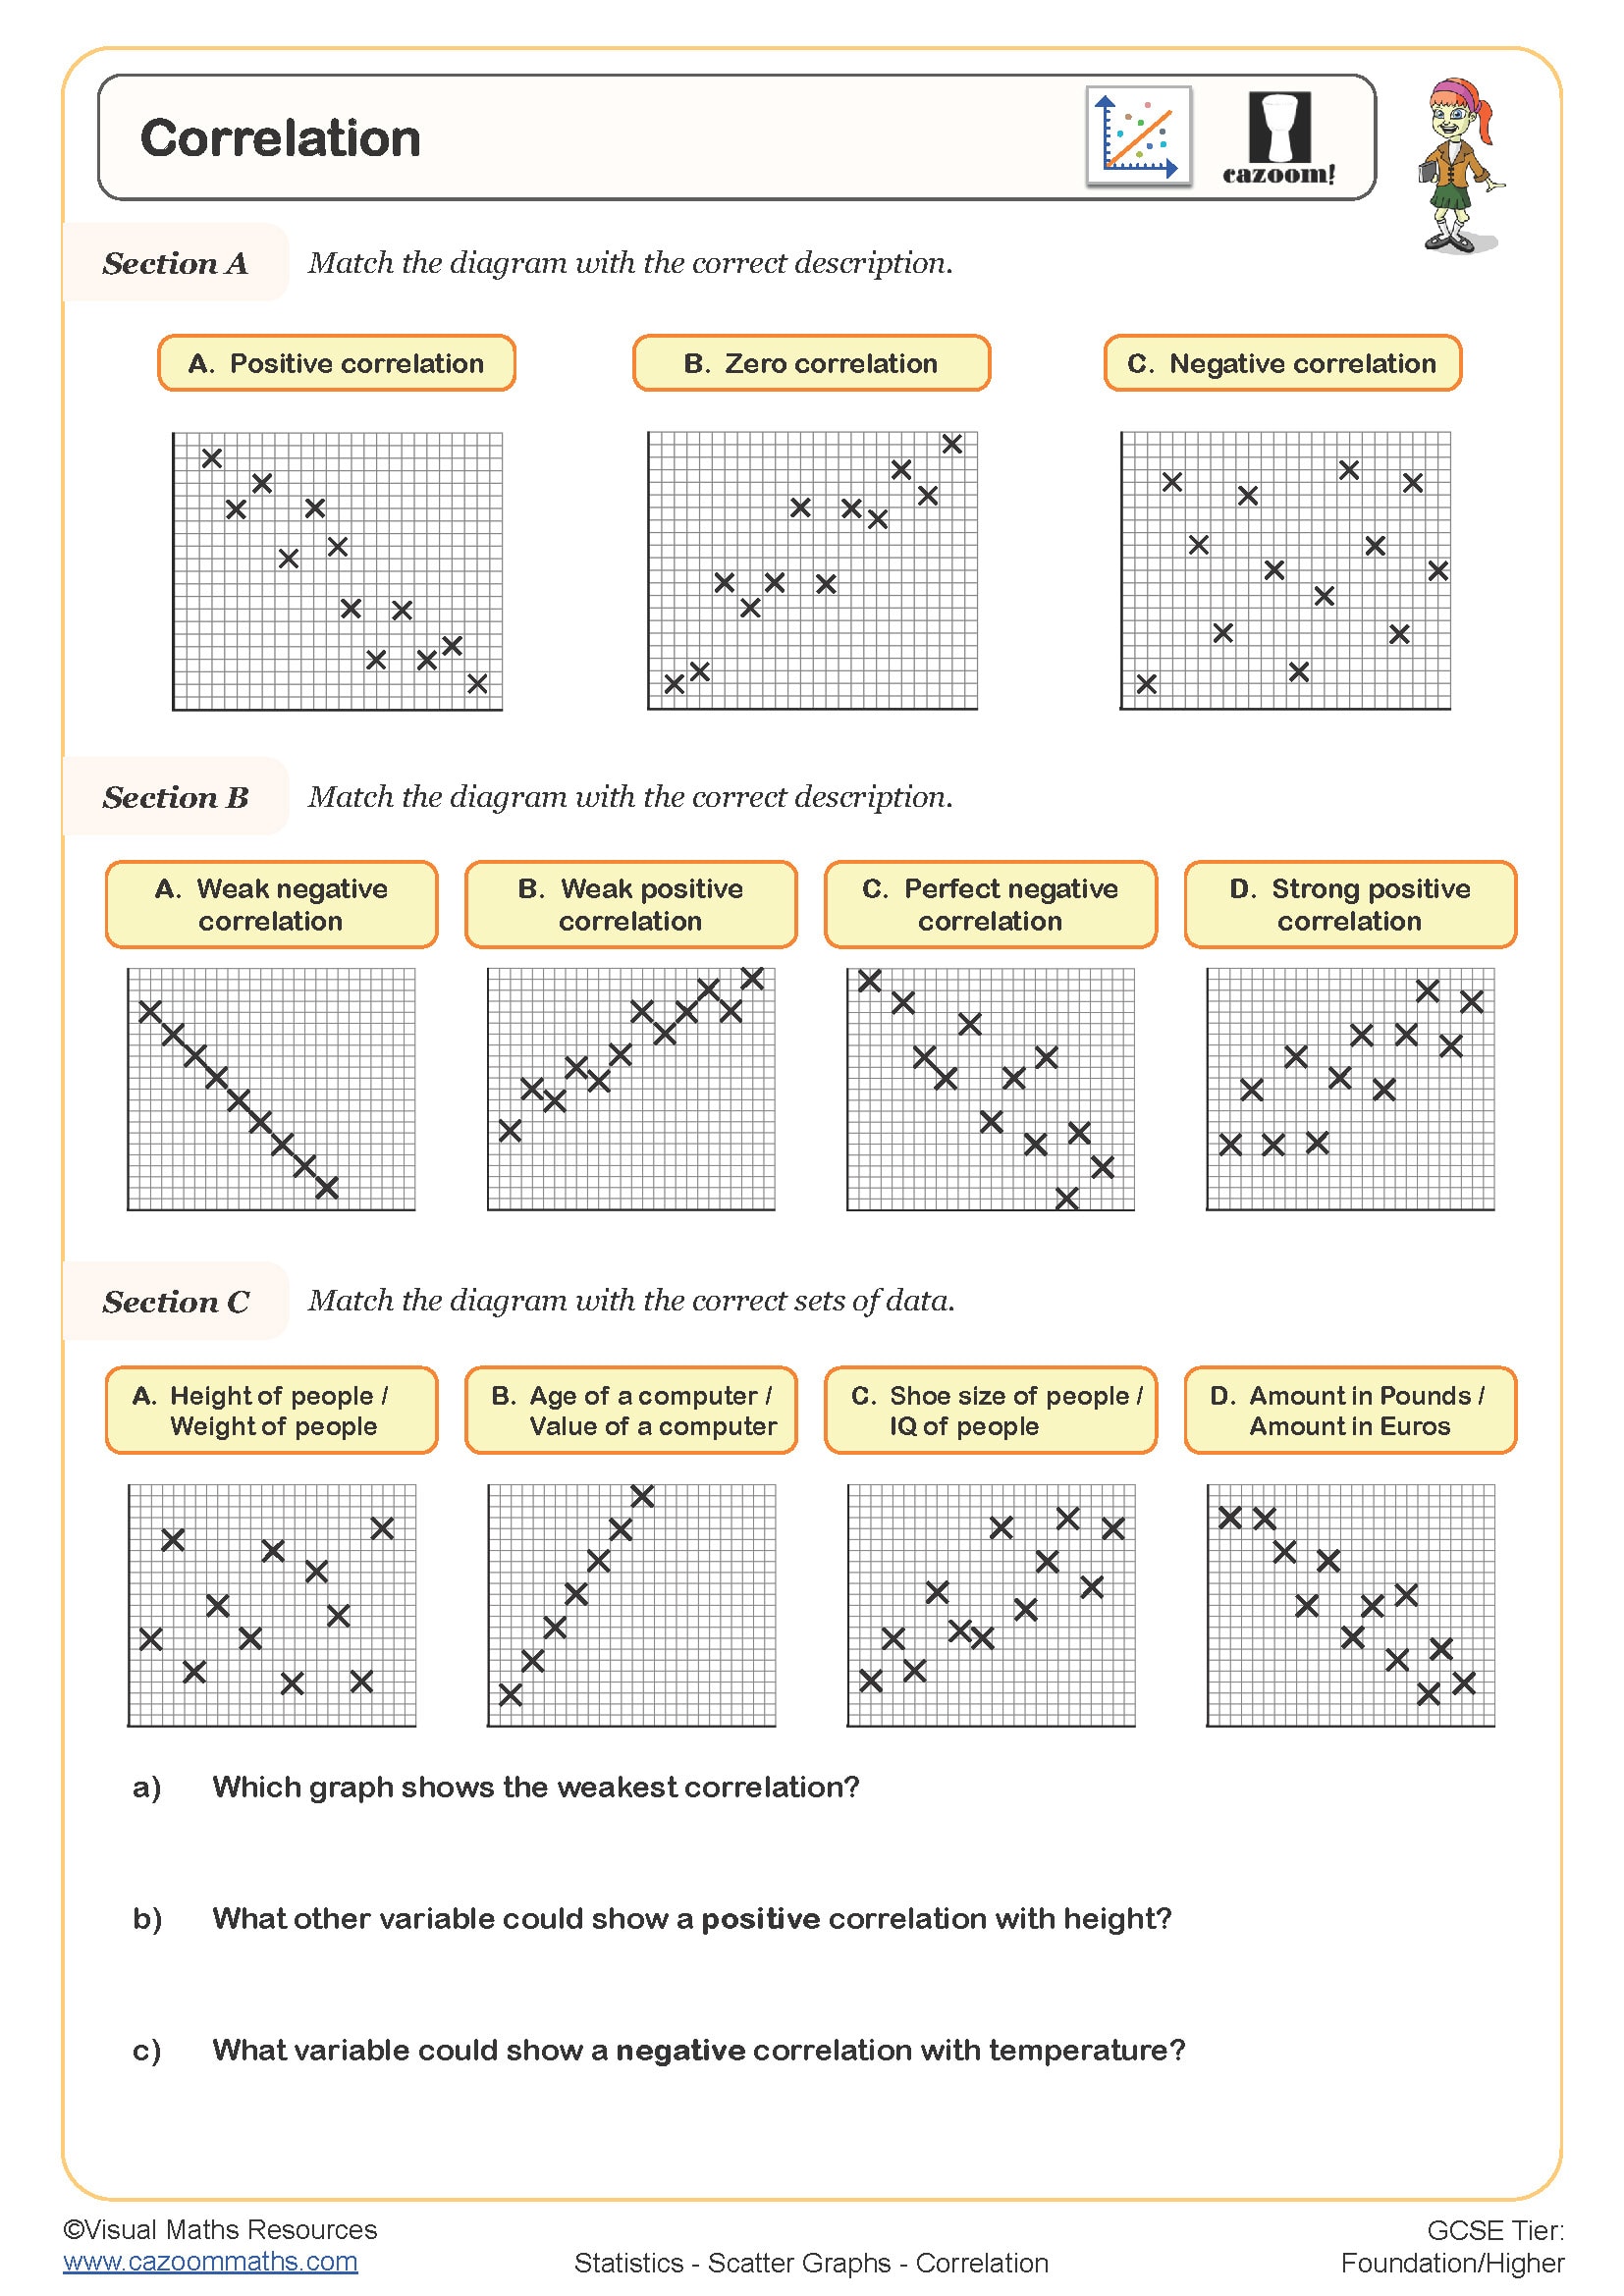
In Section A, pupils interpret scatter graphs showing relationships such as age versus salary and time spent studying versus test scores. For each graph, they identify the type of correlation and evaluate whether a causal link is present, helping to develop their critical thinking and data analysis skills.
Section B features further real-life examples—including graphs for car speed versus fuel efficiency and sunglasses sold versus sunburn cases—where students assess whether one variable causes changes in another or if the link is coincidental.
All worksheets are created by the team of experienced teachers at Cazoom Maths.

RELATED TO Correlation and Causation WORKSHEET
Frequently Asked Questions
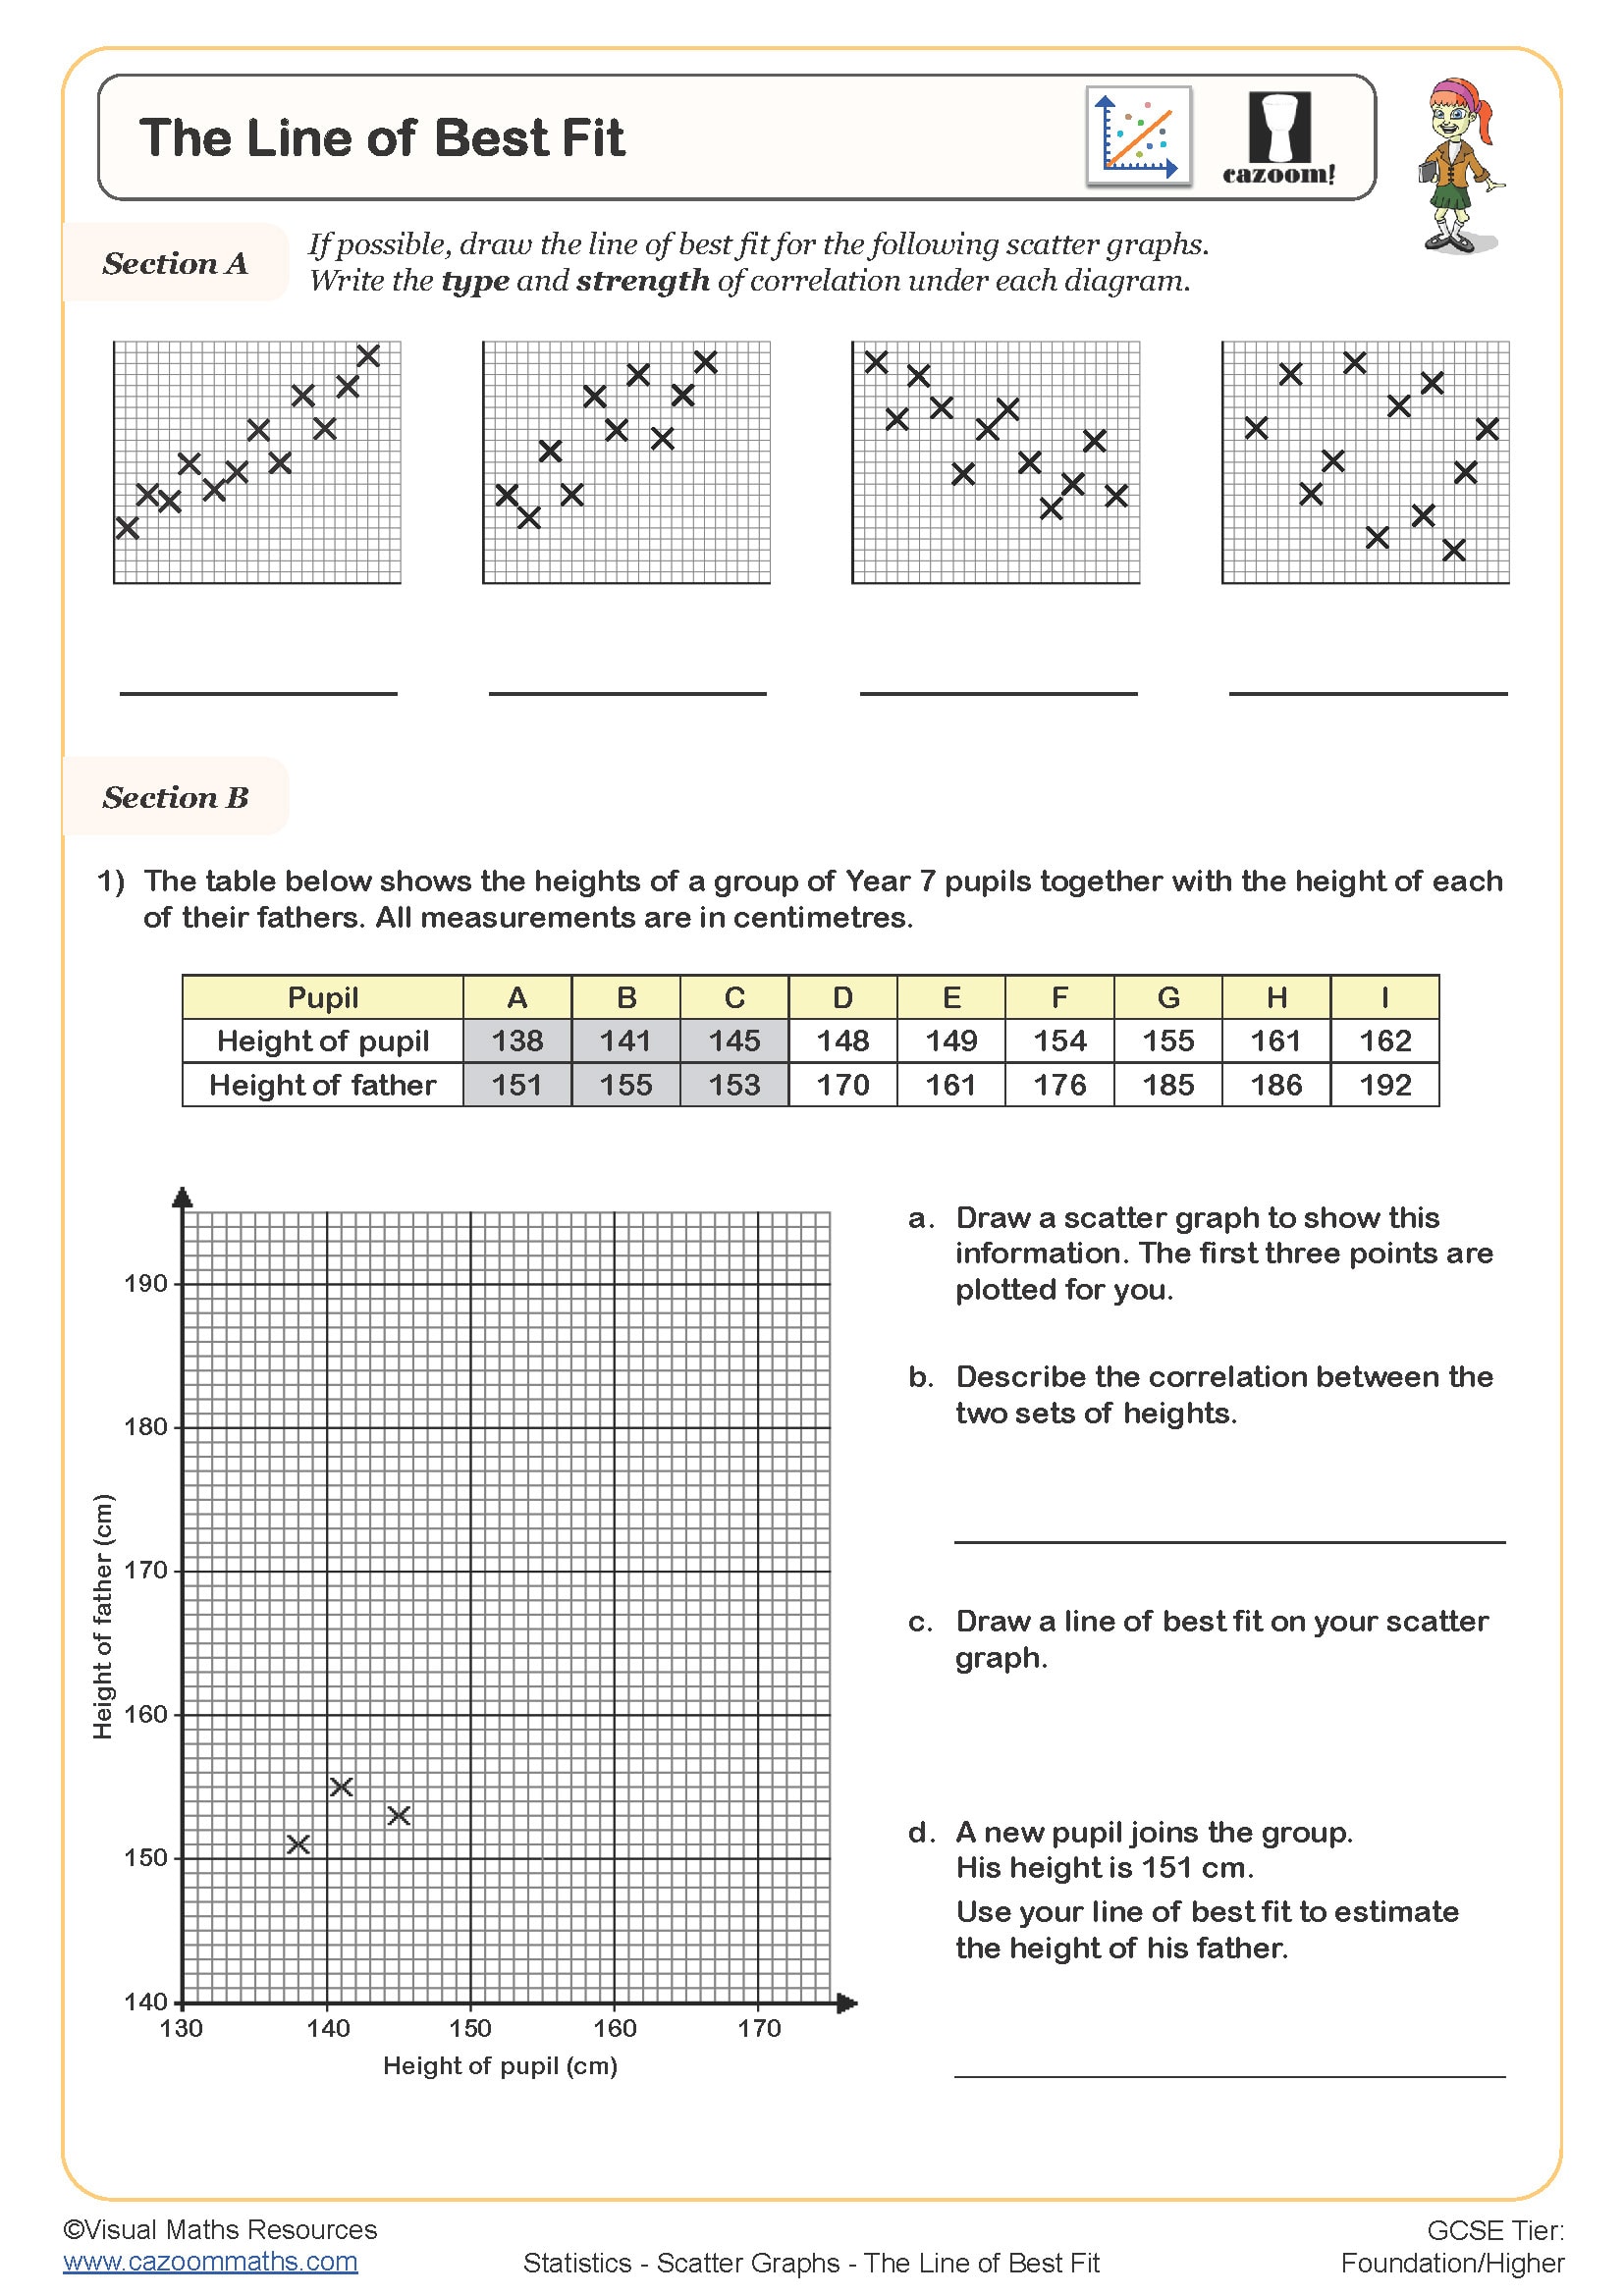
Students should already be comfortable reading and drawing scatter graphs, as well as understanding what correlation means. These foundational skills are essential because the worksheet builds upon them to explore the more nuanced concept of distinguishing between correlation and causation in data analysis.