Drawing Pie Charts (A) WORKSHEET
Drawing Pie Charts (A) WORKSHEET DESCRIPTION
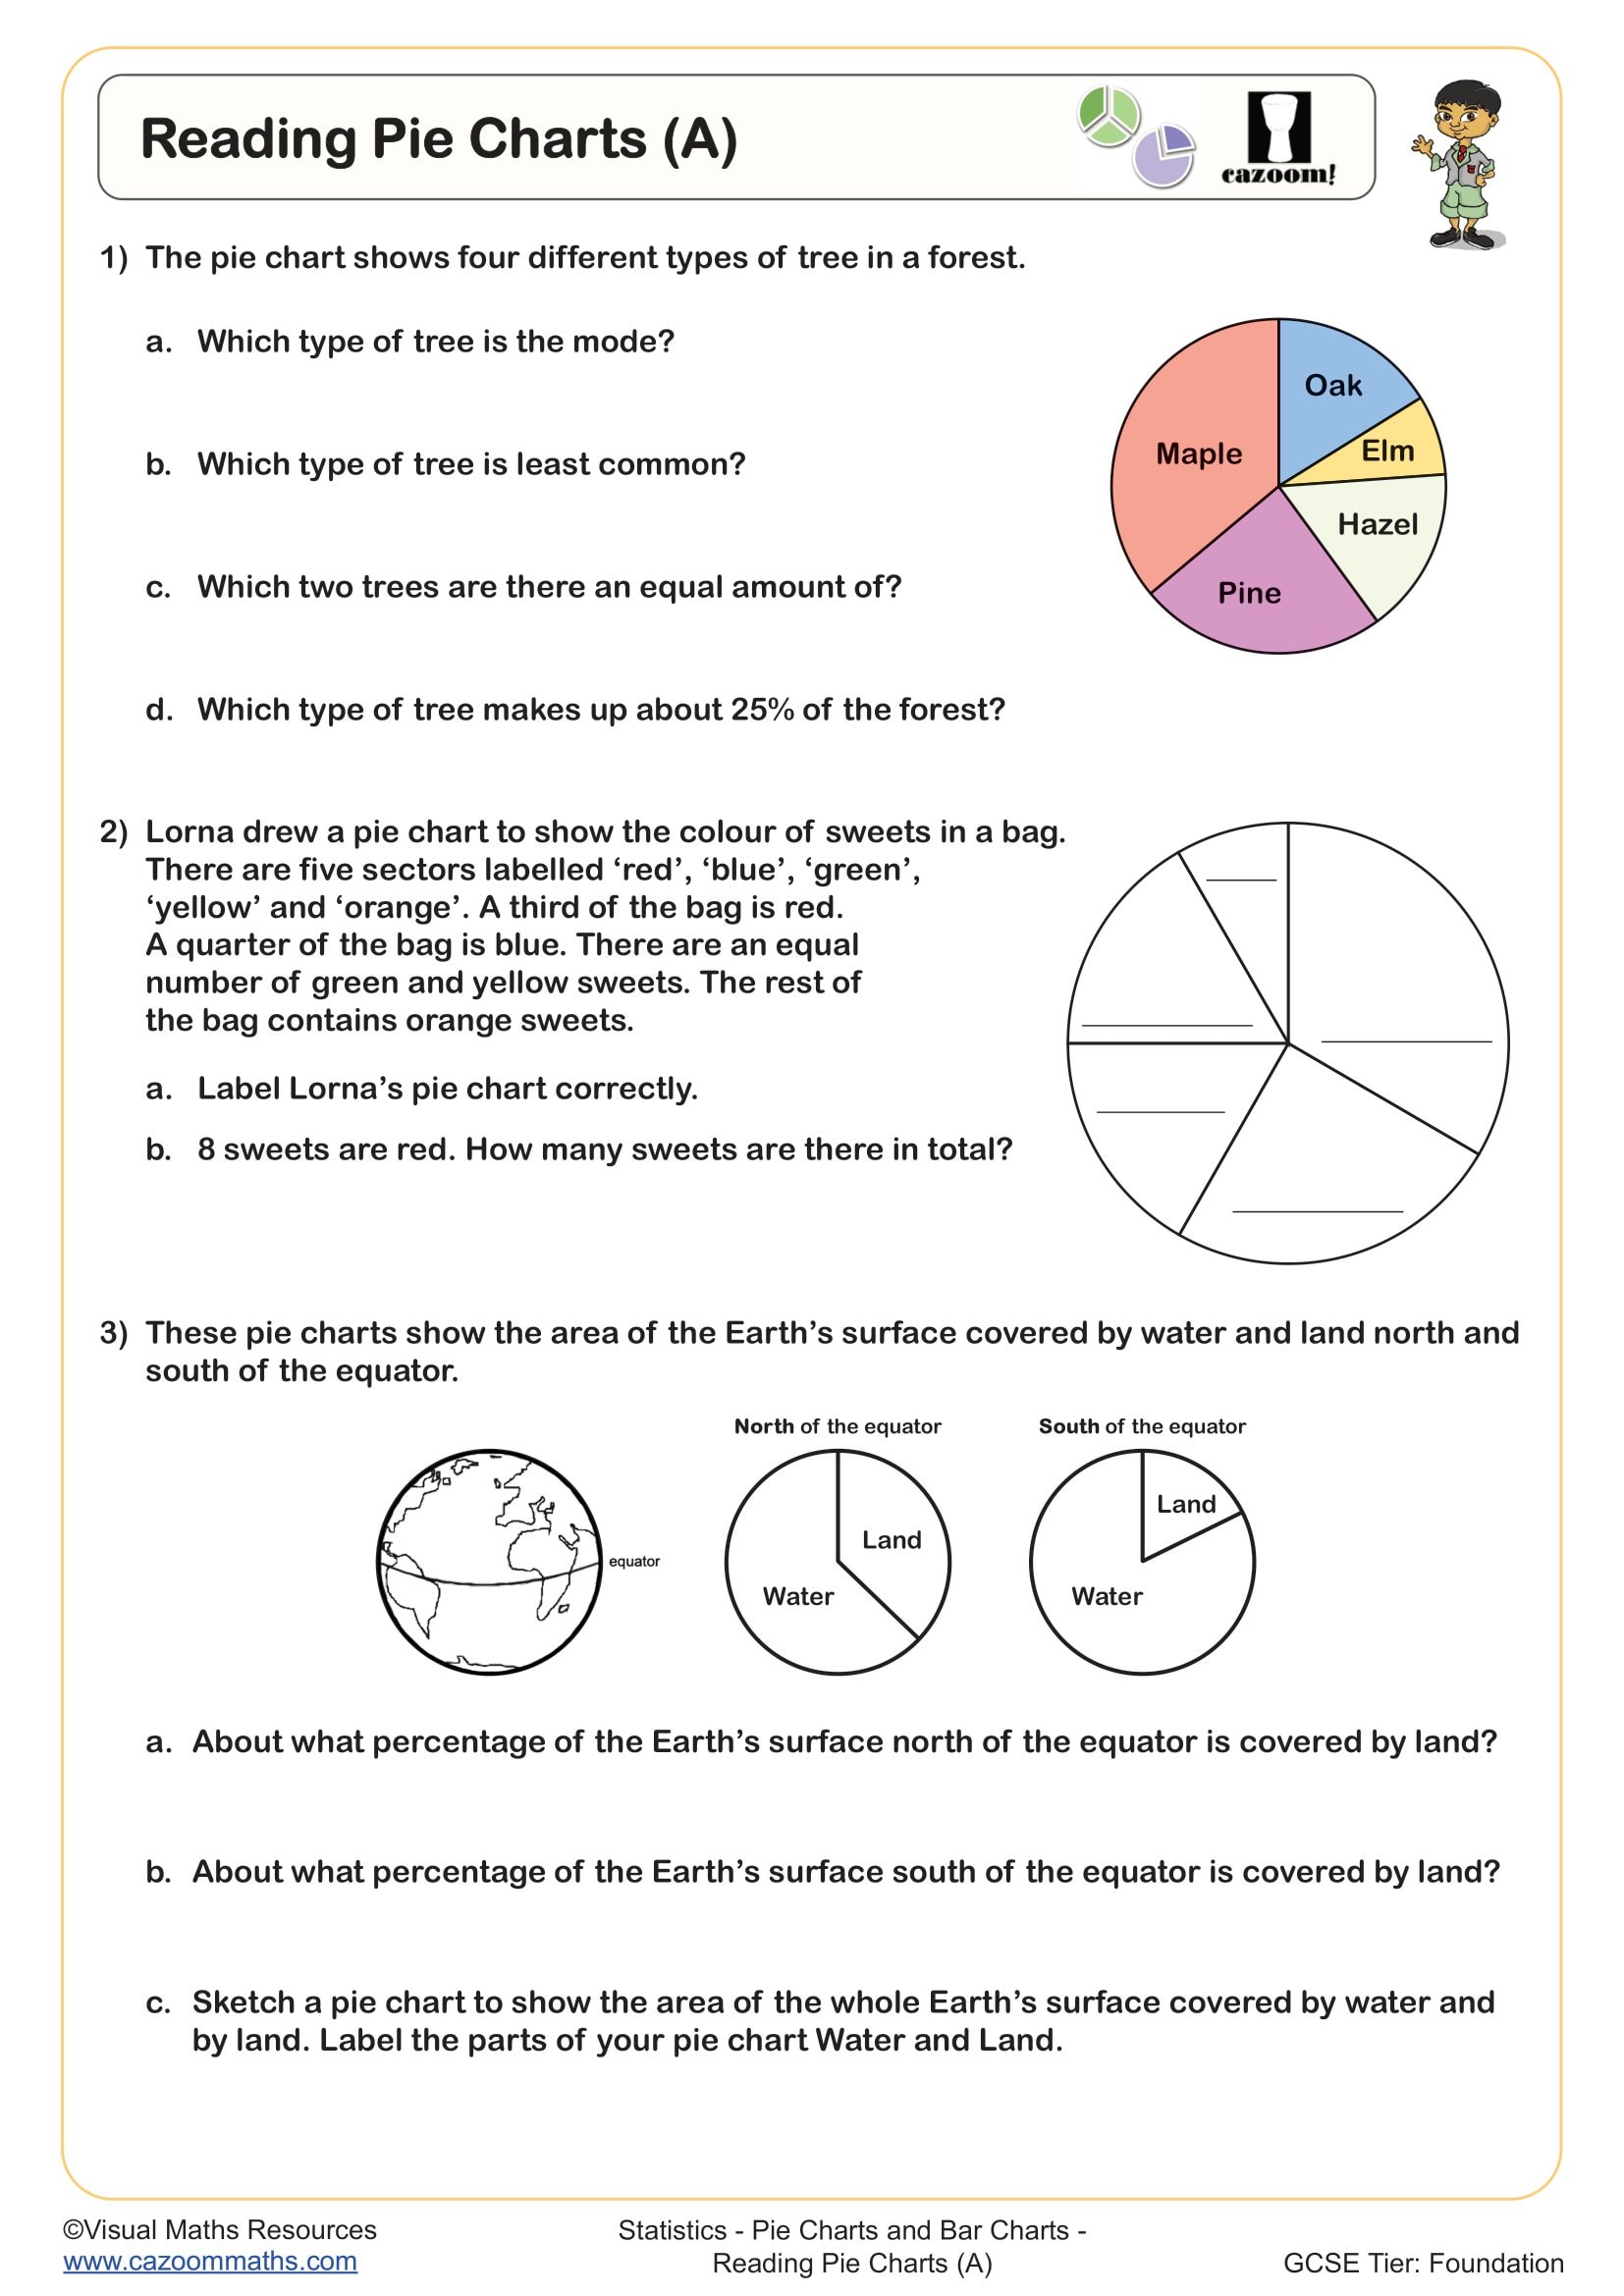
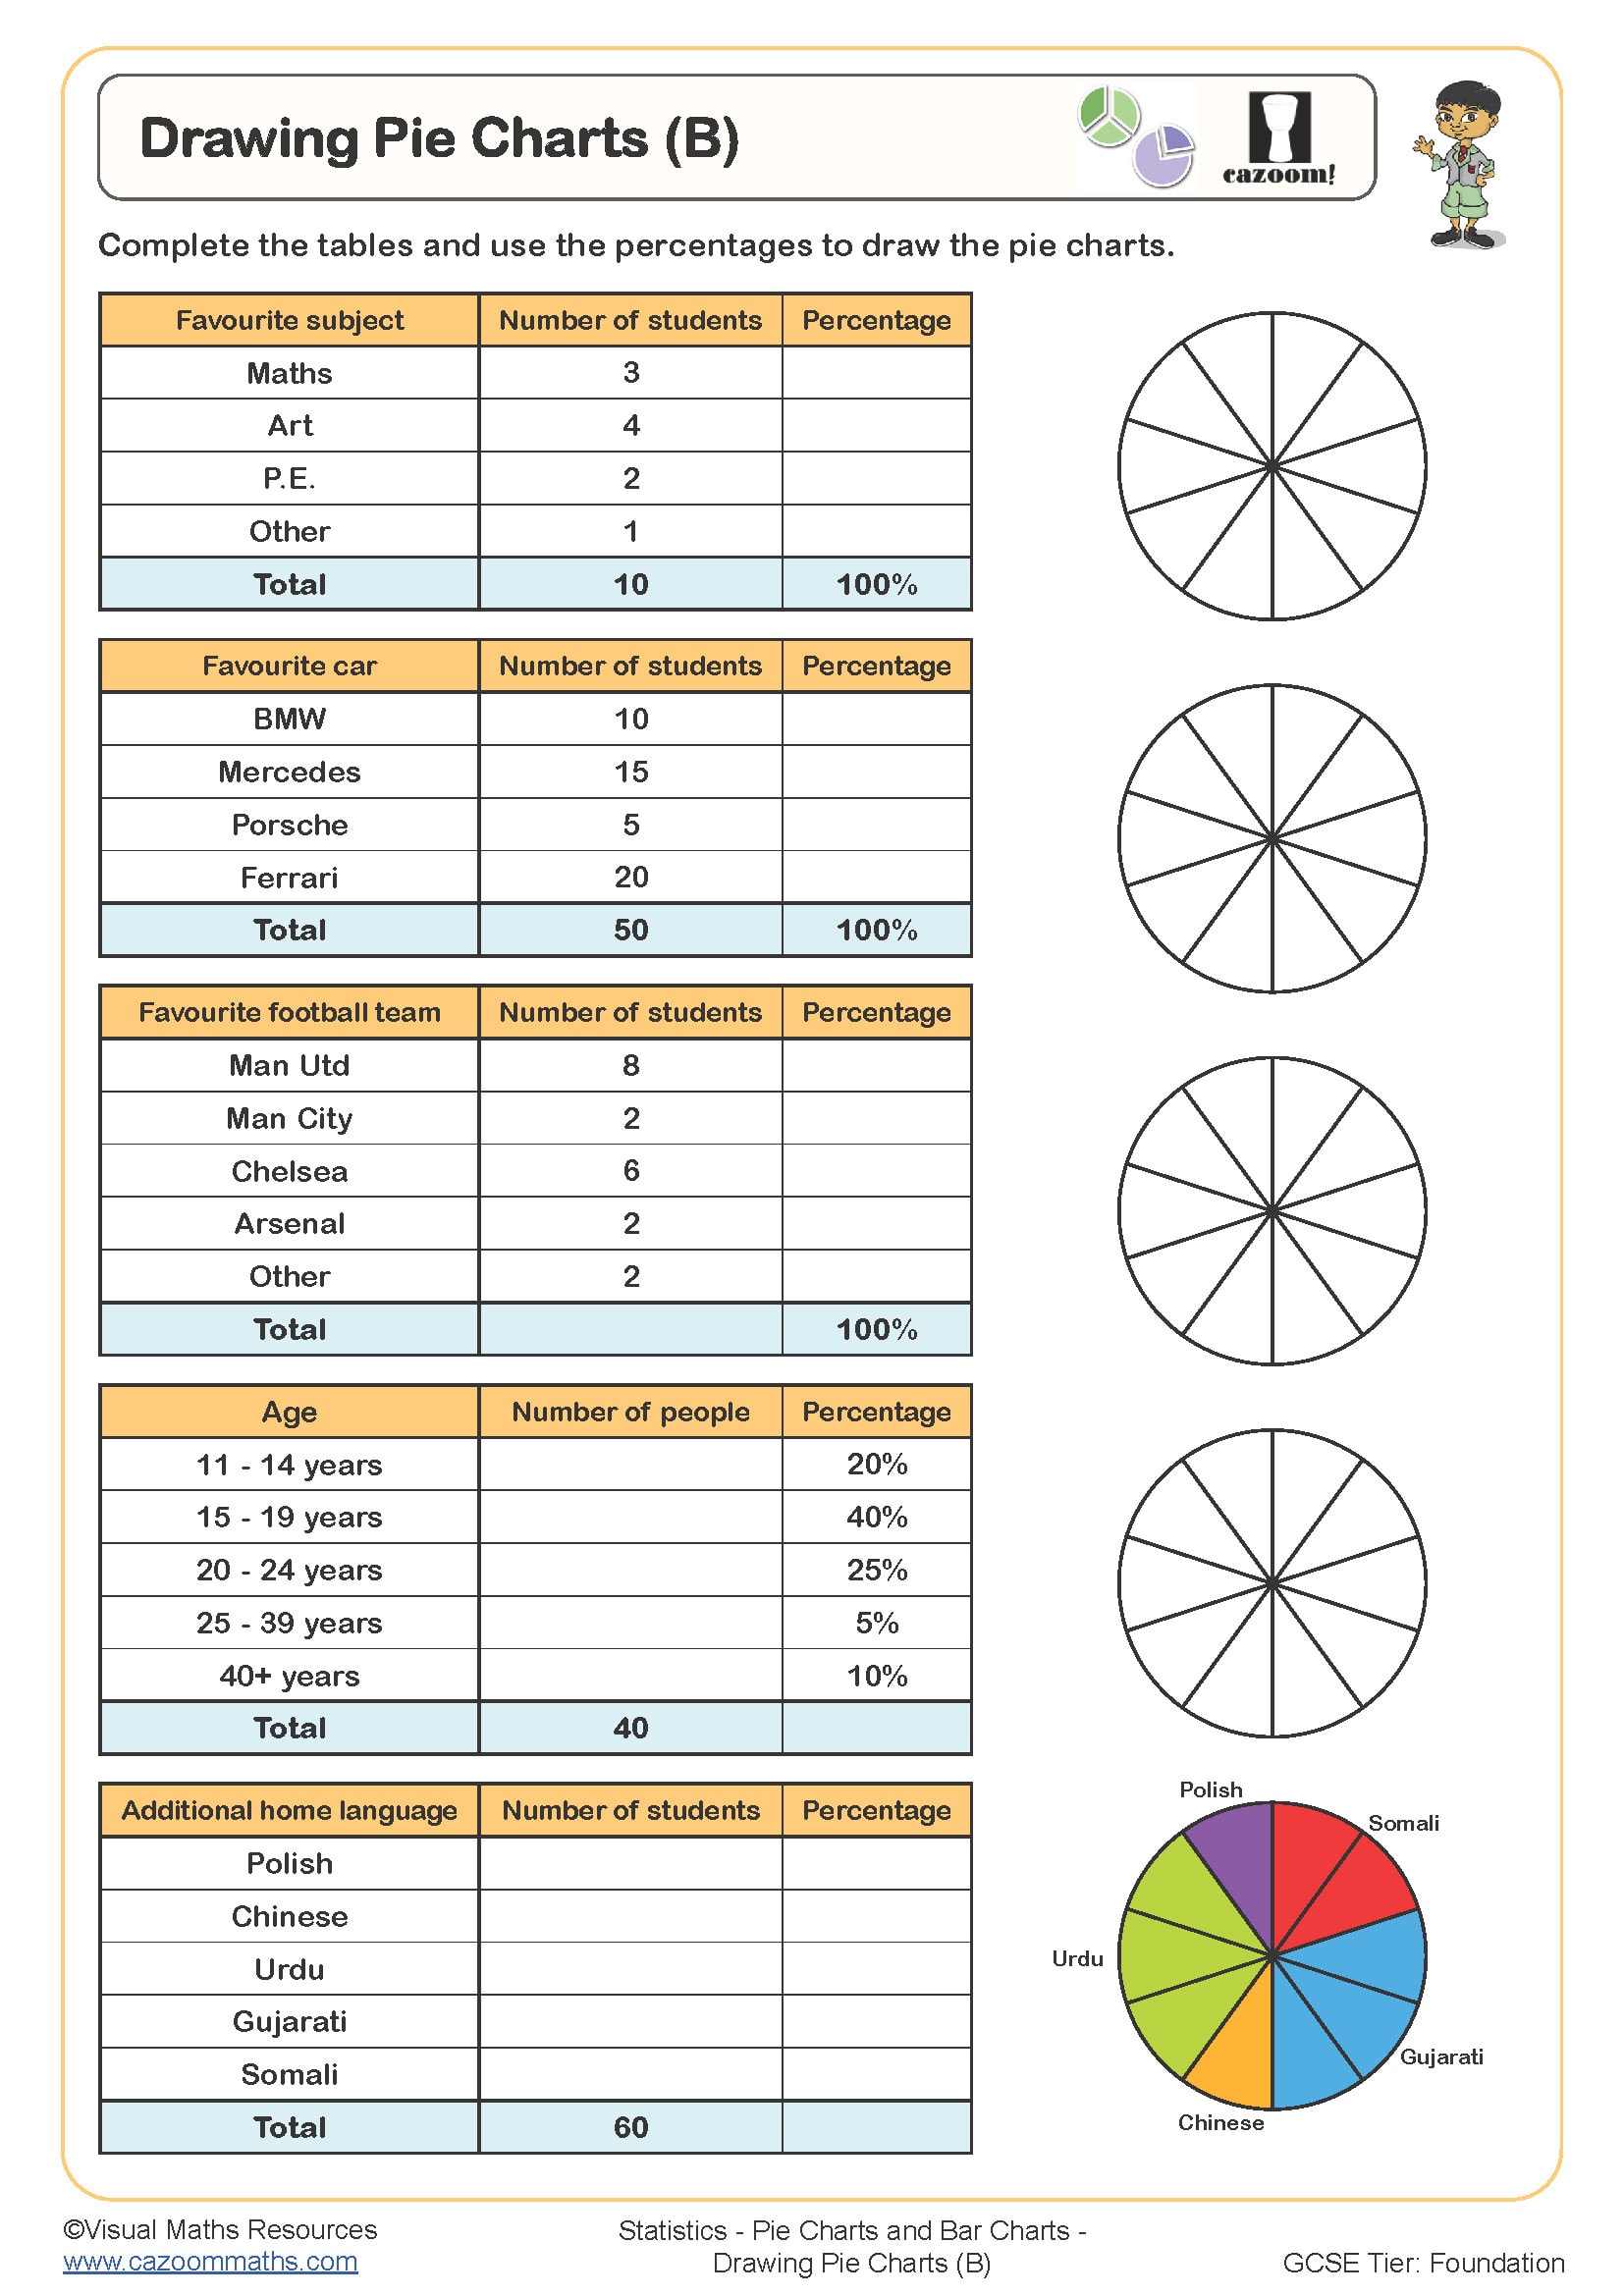
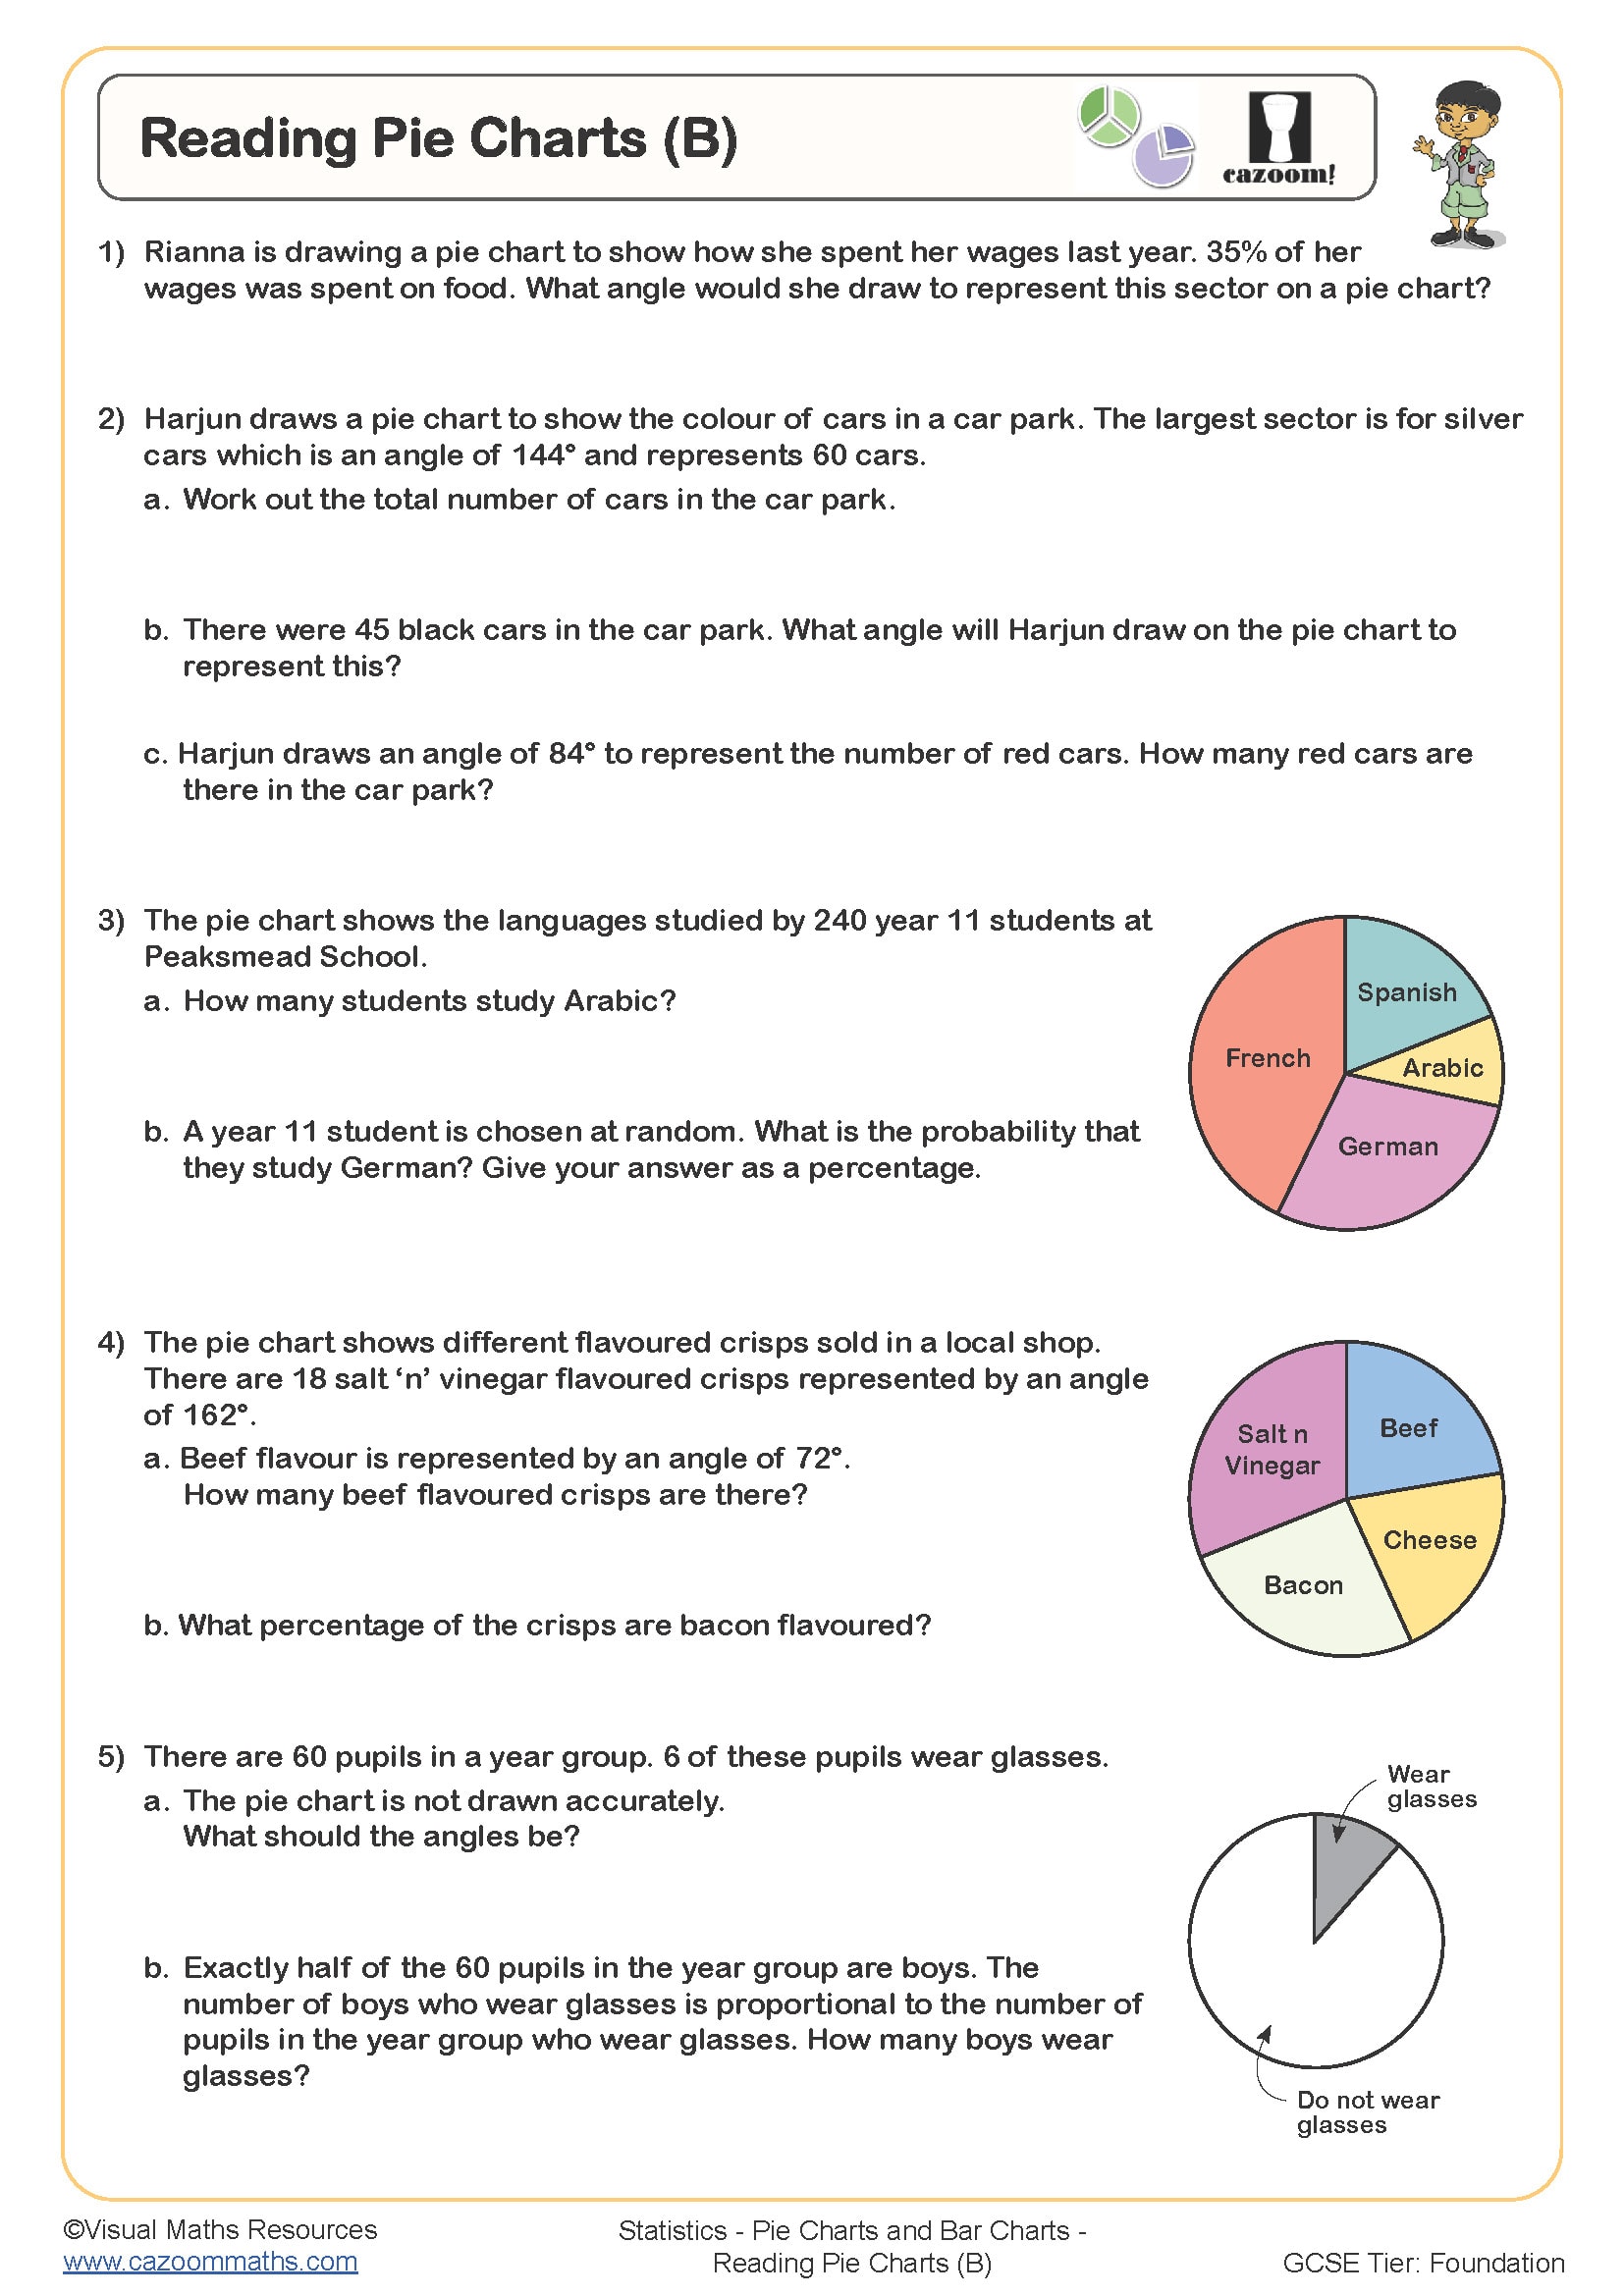
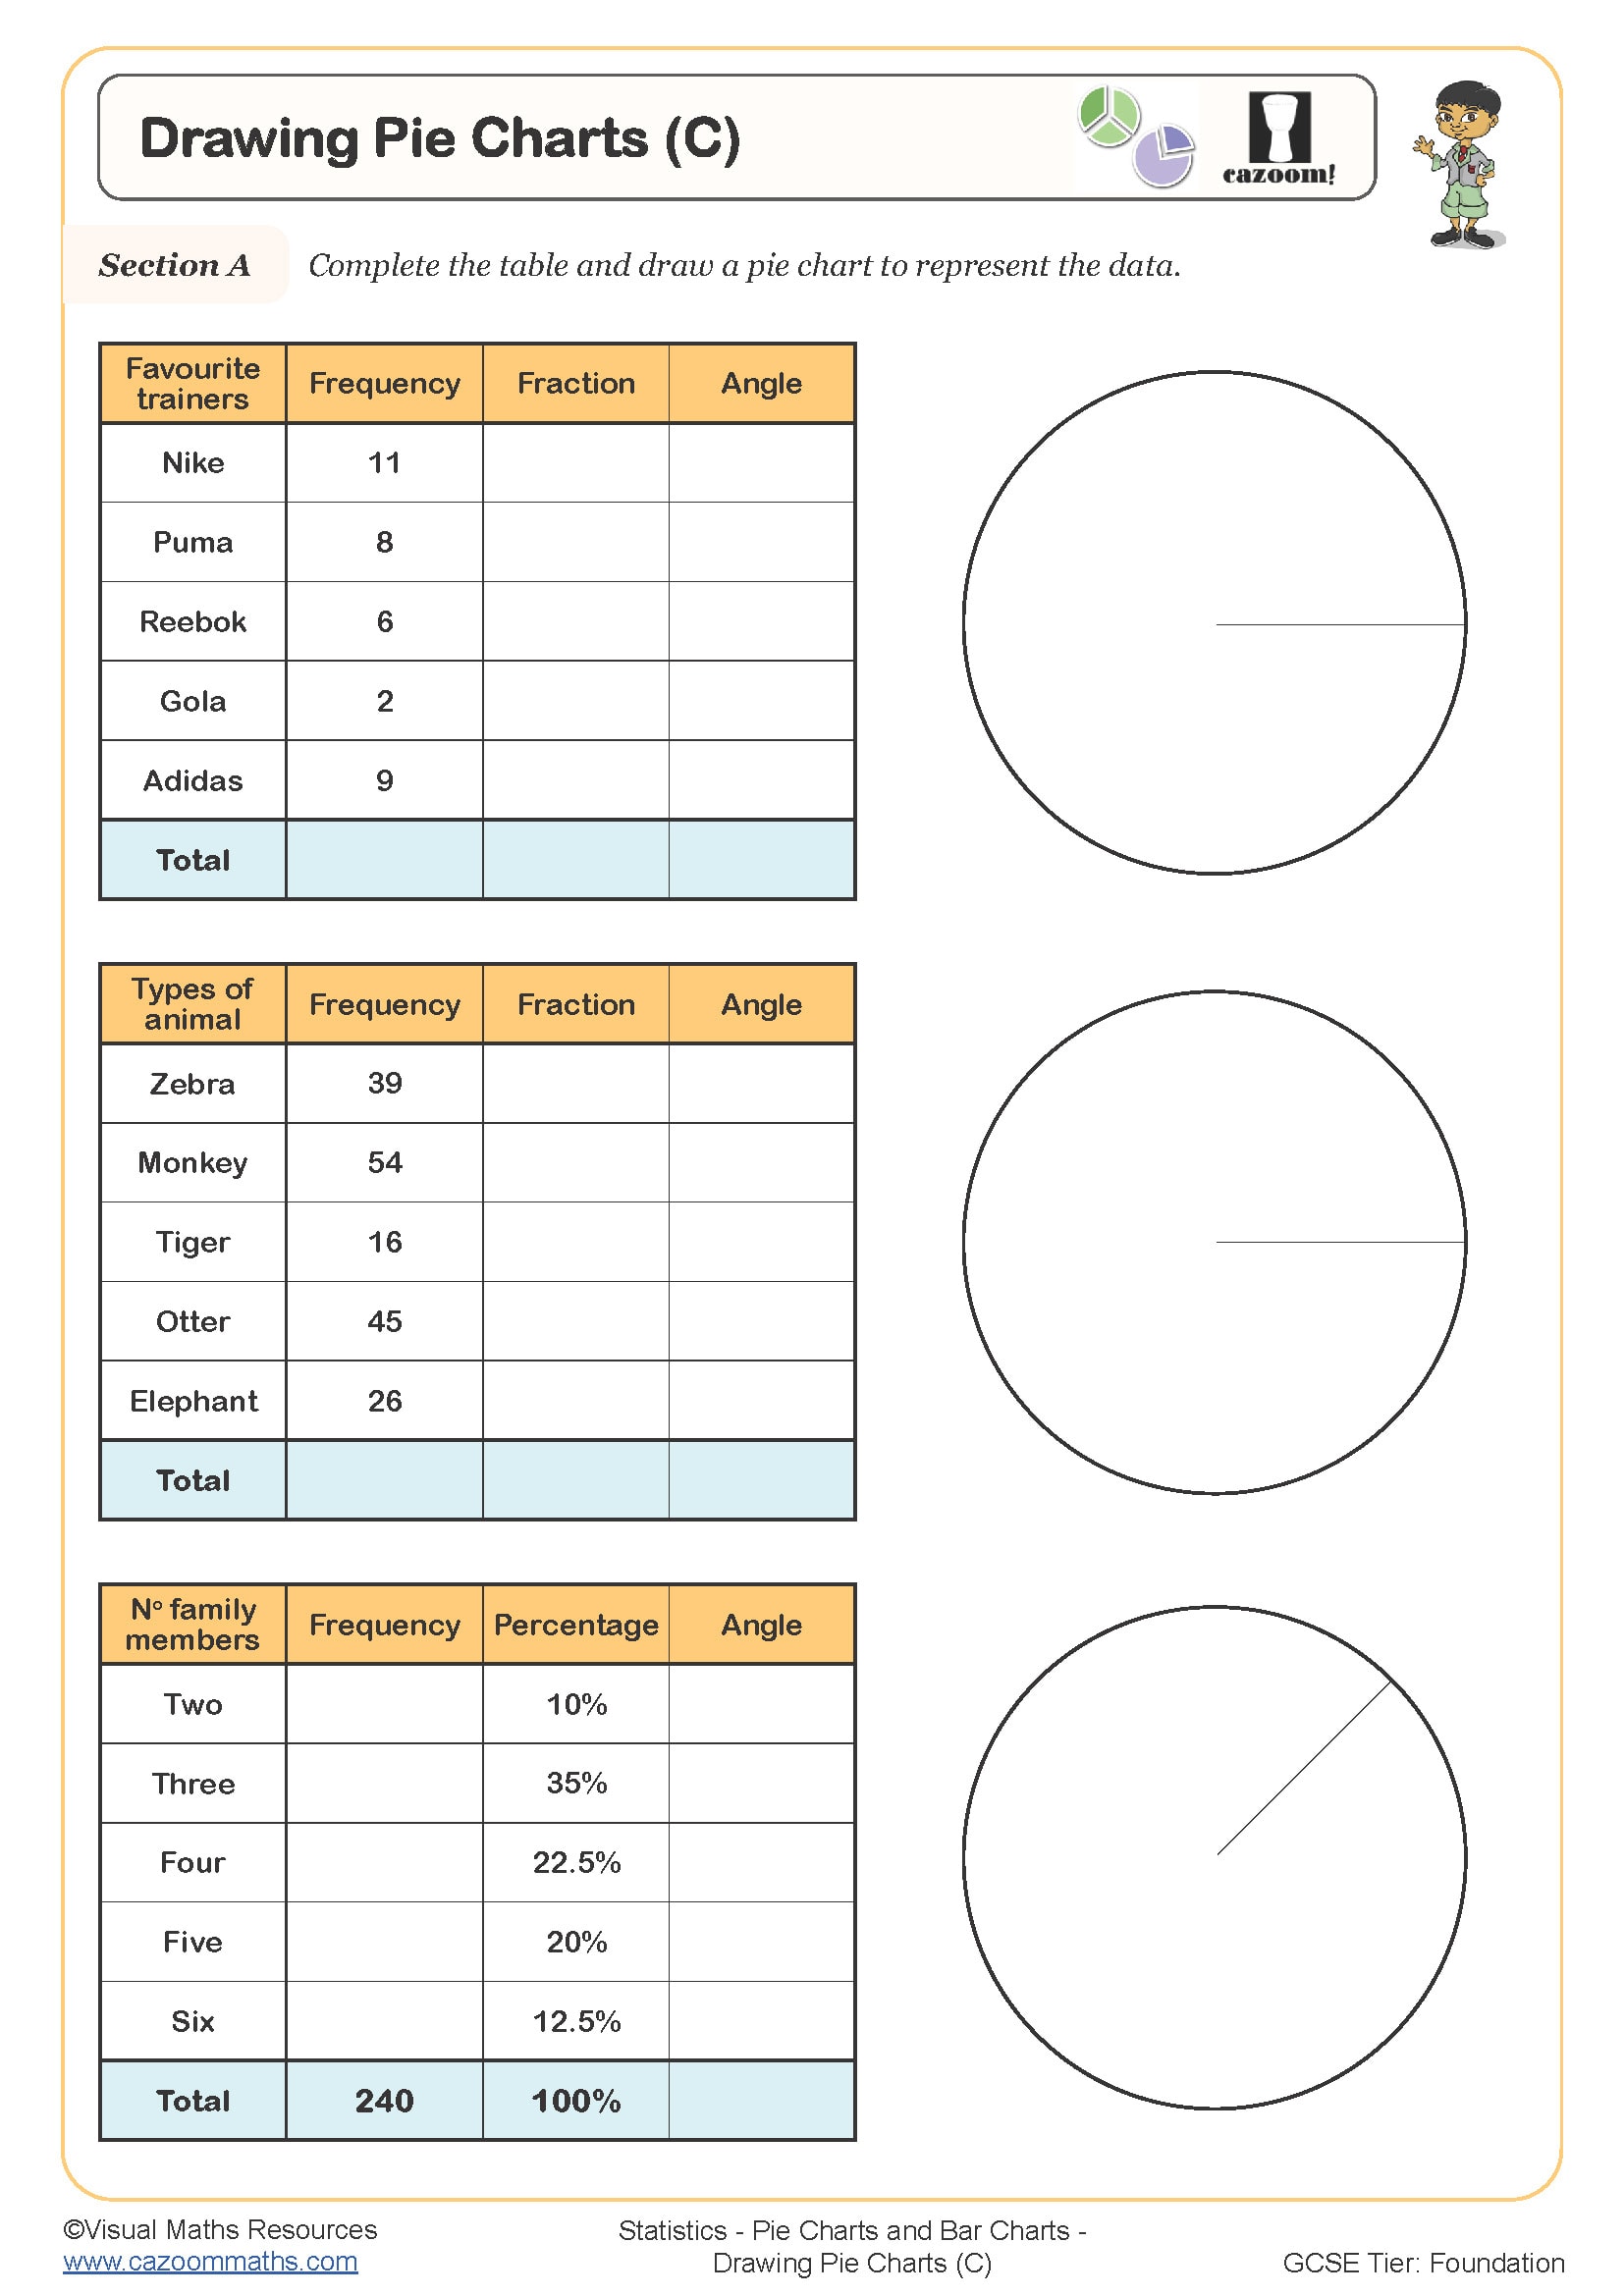
This worksheet provides some tables of information that can be presented as pie charts by shading sectors. The first two pie charts are sectioned into tenths, the third and fourth into eights and the last into twelfths. Learners will need to work out the number of sections from the data in each table. This worksheet can be followed by Drawing Pie Charts (B).
All worksheets are created by the team of experienced teachers at Cazoom Maths.
 Worksheet")
RELATED TO Drawing Pie Charts (A) WORKSHEET
Frequently Asked Questions
This worksheet is designed for Year 7 and Year 8 students who are developing their skills in data representation. It's particularly effective for learners who have a solid understanding of fractions, percentages, and angles, as these are the prerequisite knowledge areas needed to successfully complete the tasks.